Morphology of Experimental and Simulated Turing Patterns
Morphology of Experimental and Simulated Turing Patterns
Morphology of Experimental and Simulated Turing Patterns

You also want an ePaper? Increase the reach of your titles
YUMPU automatically turns print PDFs into web optimized ePapers that Google loves.
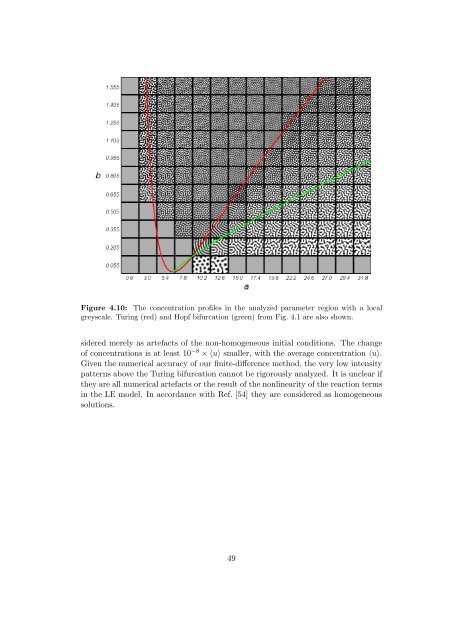
Figure 4.10: The concentration pr<strong>of</strong>iles in the analyzed parameter region with a localgreyscale. <strong>Turing</strong> (red) <strong>and</strong> Hopf bifurcation (green) from Fig. 4.1 are also shown.sidered merely as artefacts <strong>of</strong> the non-homogeneous initial conditions. The change<strong>of</strong> concentrations is at least 10 −8 × 〈u〉 smaller, with the average concentration 〈u〉.Given the numerical accuracy <strong>of</strong> our finite-difference method, the very low intensitypatterns above the <strong>Turing</strong> bifurcation cannot be rigorously analyzed. It is unclear ifthey are all numerical artefacts or the result <strong>of</strong> the nonlinearity <strong>of</strong> the reaction termsin the LE model. In accordance with Ref. [54] they are considered as homogeneoussolutions.49