Woodcock-Johnson® III - Riverside Publishing
Woodcock-Johnson® III - Riverside Publishing
Woodcock-Johnson® III - Riverside Publishing
- No tags were found...
Create successful ePaper yourself
Turn your PDF publications into a flip-book with our unique Google optimized e-Paper software.
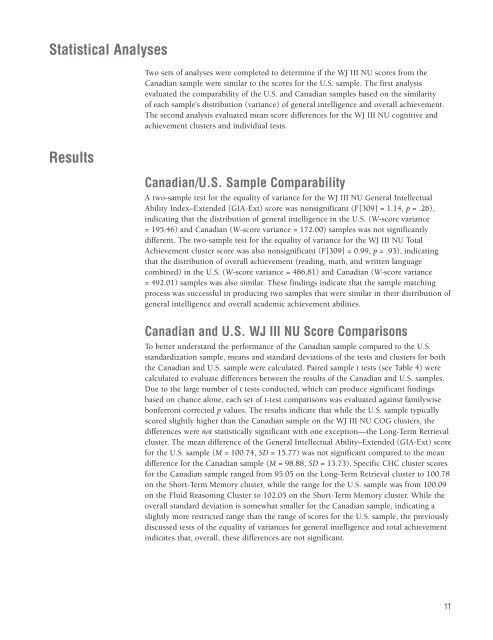
Statistical AnalysesTwo sets of analyses were completed to determine if the WJ <strong>III</strong> NU scores from theCanadian sample were similar to the scores for the U.S. sample. The first analysisevaluated the comparability of the U.S. and Canadian samples based on the similarityof each sample's distribution (variance) of general intelligence and overall achievement.The second analysis evaluated mean score differences for the WJ <strong>III</strong> NU cognitive andachievement clusters and individual tests.ResultsCanadian/U.S. Sample ComparabilityA two-sample test for the equality of variance for the WJ <strong>III</strong> NU General IntellectualAbility Index–Extended (GIA-Ext) score was nonsignificant (F[309] = 1.14, p = .26),indicating that the distribution of general intelligence in the U.S. (W-score variance= 195.46) and Canadian (W-score variance = 172.00) samples was not significantlydifferent. The two-sample test for the equality of variance for the WJ <strong>III</strong> NU TotalAchievement cluster score was also nonsignificant (F[309] = 0.99, p = .93), indicatingthat the distribution of overall achievement (reading, math, and written languagecombined) in the U.S. (W-score variance = 486.81) and Canadian (W-score variance= 492.01) samples was also similar. These findings indicate that the sample matchingprocess was successful in producing two samples that were similar in their distribution ofgeneral intelligence and overall academic achievement abilities.Canadian and U.S. WJ <strong>III</strong> NU Score ComparisonsTo better understand the performance of the Canadian sample compared to the U.S.standardization sample, means and standard deviations of the tests and clusters for boththe Canadian and U.S. sample were calculated. Paired sample t tests (see Table 4) werecalculated to evaluate differences between the results of the Canadian and U.S. samples.Due to the large number of t tests conducted, which can produce significant findingsbased on chance alone, each set of t-test comparisons was evaluated against familywisebonferroni corrected p values. The results indicate that while the U.S. sample typicallyscored slightly higher than the Canadian sample on the WJ <strong>III</strong> NU COG clusters, thedifferences were not statistically significant with one exception—the Long-Term Retrievalcluster. The mean difference of the General Intellectual Ability–Extended (GIA-Ext) scorefor the U.S. sample (M = 100.74, SD = 15.77) was not significant compared to the meandifference for the Canadian sample (M = 98.88, SD = 13.73). Specific CHC cluster scoresfor the Canadian sample ranged from 95.05 on the Long-Term Retrieval cluster to 100.78on the Short-Term Memory cluster, while the range for the U.S. sample was from 100.09on the Fluid Reasoning Cluster to 102.05 on the Short-Term Memory cluster. While theoverall standard deviation is somewhat smaller for the Canadian sample, indicating aslightly more restricted range than the range of scores for the U.S. sample, the previouslydiscussed tests of the equality of variances for general intelligence and total achievementindicates that, overall, these differences are not significant.11


