Woodcock-Johnson® III - Riverside Publishing
Woodcock-Johnson® III - Riverside Publishing
Woodcock-Johnson® III - Riverside Publishing
- No tags were found...
You also want an ePaper? Increase the reach of your titles
YUMPU automatically turns print PDFs into web optimized ePapers that Google loves.
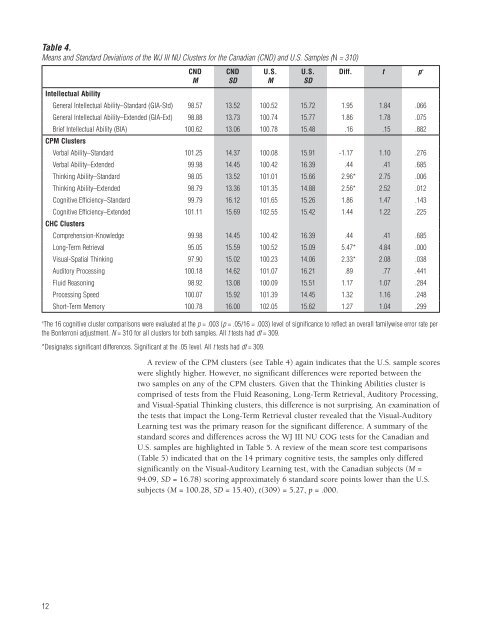
Table 4.Means and Standard Deviations of the WJ <strong>III</strong> NU Clusters for the Canadian (CND) and U.S. Samples (N = 310)CNDMCNDSDU.S.MU.S.SDDiff. t p aIntellectual AbilityGeneral Intellectual Ability–Standard (GIA-Std) 98.57 13.52 100.52 15.72 1.95 1.84 .066General Intellectual Ability–Extended (GIA-Ext) 98.88 13.73 100.74 15.77 1.86 1.78 .075Brief Intellectual Ability (BIA) 100.62 13.06 100.78 15.48 .16 .15 .882CPM ClustersVerbal Ability–Standard 101.25 14.37 100.08 15.91 -1.17 1.10 .276Verbal Ability–Extended 99.98 14.45 100.42 16.39 .44 .41 .685Thinking Ability–Standard 98.05 13.52 101.01 15.66 2.96* 2.75 .006Thinking Ability–Extended 98.79 13.36 101.35 14.88 2.56* 2.52 .012Cognitive Efficiency–Standard 99.79 16.12 101.65 15.26 1.86 1.47 .143Cognitive Efficiency–Extended 101.11 15.69 102.55 15.42 1.44 1.22 .225CHC ClustersComprehension-Knowledge 99.98 14.45 100.42 16.39 .44 .41 .685Long-Term Retrieval 95.05 15.59 100.52 15.09 5.47* 4.84 .000Visual-Spatial Thinking 97.90 15.02 100.23 14.06 2.33* 2.08 .038Auditory Processing 100.18 14.62 101.07 16.21 .89 .77 .441Fluid Reasoning 98.92 13.08 100.09 15.51 1.17 1.07 .284Processing Speed 100.07 15.92 101.39 14.45 1.32 1.16 .248Short-Term Memory 100.78 16.00 102.05 15.62 1.27 1.04 .299a The 16 cognitive cluster comparisons were evaluated at the p = .003 (p = .05/16 = .003) level of significance to reflect an overall familywise error rate perthe Bonferroni adjustment. N = 310 for all clusters for both samples. All t tests had df = 309.*Designates significant differences. Significant at the .05 level. All t tests had df = 309.A review of the CPM clusters (see Table 4) again indicates that the U.S. sample scoreswere slightly higher. However, no significant differences were reported between thetwo samples on any of the CPM clusters. Given that the Thinking Abilities cluster iscomprised of tests from the Fluid Reasoning, Long-Term Retrieval, Auditory Processing,and Visual-Spatial Thinking clusters, this difference is not surprising. An examination ofthe tests that impact the Long-Term Retrieval cluster revealed that the Visual-AuditoryLearning test was the primary reason for the significant difference. A summary of thestandard scores and differences across the WJ <strong>III</strong> NU COG tests for the Canadian andU.S. samples are highlighted in Table 5. A review of the mean score test comparisons(Table 5) indicated that on the 14 primary cognitive tests, the samples only differedsignificantly on the Visual-Auditory Learning test, with the Canadian subjects (M =94.09, SD = 16.78) scoring approximately 6 standard score points lower than the U.S.subjects (M = 100.28, SD = 15.40), t(309) = 5.27, p = .000.12


