Woodcock-Johnson® III - Riverside Publishing
Woodcock-Johnson® III - Riverside Publishing
Woodcock-Johnson® III - Riverside Publishing
- No tags were found...

Create successful ePaper yourself
Turn your PDF publications into a flip-book with our unique Google optimized e-Paper software.
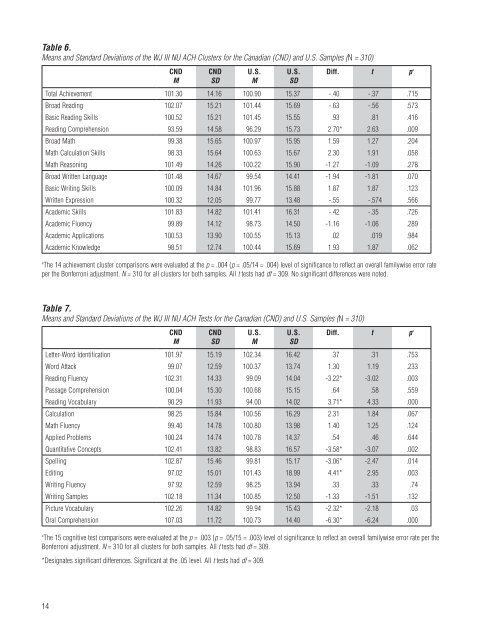
Table 6.Means and Standard Deviations of the WJ <strong>III</strong> NU ACH Clusters for the Canadian (CND) and U.S. Samples (N = 310)CNDMCNDSDU.S.MU.S.SDDiff. t p aTotal Achievement 101.30 14.16 100.90 15.37 -.40 -.37 .715Broad Reading 102.07 15.21 101.44 15.69 -.63 -.56 .573Basic Reading Skills 100.52 15.21 101.45 15.55 .93 .81 .416Reading Comprehension 93.59 14.58 96.29 15.73 2.70* 2.63 .009Broad Math 99.38 15.65 100.97 15.95 1.59 1.27 .204Math Calculation Skills 98.33 15.64 100.63 15.67 2.30 1.91 .058Math Reasoning 101.49 14.26 100.22 15.90 -1.27 -1.09 .278Broad Written Language 101.48 14.67 99.54 14.41 -1.94 -1.81 .070Basic Writing Skills 100.09 14.84 101.96 15.88 1.87 1.87 .123Written Expression 100.32 12.05 99.77 13.48 -.55 -.574 .566Academic Skills 101.83 14.82 101.41 16.31 -.42 -.35 .726Academic Fluency 99.89 14.12 98.73 14.50 -1.16 -1.06 .289Academic Applications 100.53 13.90 100.55 15.13 .02 .019 .984Academic Knowledge 98.51 12.74 100.44 15.69 1.93 1.87 .062a The 14 achievement cluster comparisons were evaluated at the p = .004 (p = .05/14 = .004) level of significance to reflect an overall familywise error rateper the Bonferroni adjustment. N = 310 for all clusters for both samples. All t tests had df = 309. No significant differences were noted.Table 7.Means and Standard Deviations of the WJ <strong>III</strong> NU ACH Tests for the Canadian (CND) and U.S. Samples (N = 310)CNDMCNDSDU.S.MU.S.SDDiff. t p aLetter-Word Identification 101.97 15.19 102.34 16.42 .37 .31 .753Word Attack 99.07 12.59 100.37 13.74 1.30 1.19 .233Reading Fluency 102.31 14.33 99.09 14.04 -3.22* -3.02 .003Passage Comprehension 100.04 15.30 100.68 15.15 .64 .58 .559Reading Vocabulary 90.29 11.93 94.00 14.02 3.71* 4.33 .000Calculation 98.25 15.84 100.56 16.29 2.31 1.84 .067Math Fluency 99.40 14.78 100.80 13.98 1.40 1.25 .124Applied Problems 100.24 14.74 100.78 14.37 .54 .46 .644Quantitative Concepts 102.41 13.82 98.83 16.57 -3.58* -3.07 .002Spelling 102.87 15.46 99.81 15.17 -3.06* -2.47 .014Editing 97.02 15.01 101.43 18.99 4.41* 2.95 .003Writing Fluency 97.92 12.59 98.25 13.94 .33 .33 .74Writing Samples 102.18 11.34 100.85 12.50 -1.33 -1.51 .132Picture Vocabulary 102.26 14.82 99.94 15.43 -2.32* -2.18 .03Oral Comprehension 107.03 11.72 100.73 14.40 -6.30* -6.24 .000a The 15 cognitive test comparisons were evaluated at the p = .003 (p = .05/15 = .003) level of significance to reflect an overall familywise error rate per theBonferroni adjustment. N = 310 for all clusters for both samples. All t tests had df = 309.*Designates significant differences. Significant at the .05 level. All t tests had df = 309.14