Woodcock-Johnson® III - Riverside Publishing
Woodcock-Johnson® III - Riverside Publishing
Woodcock-Johnson® III - Riverside Publishing
- No tags were found...

Create successful ePaper yourself
Turn your PDF publications into a flip-book with our unique Google optimized e-Paper software.
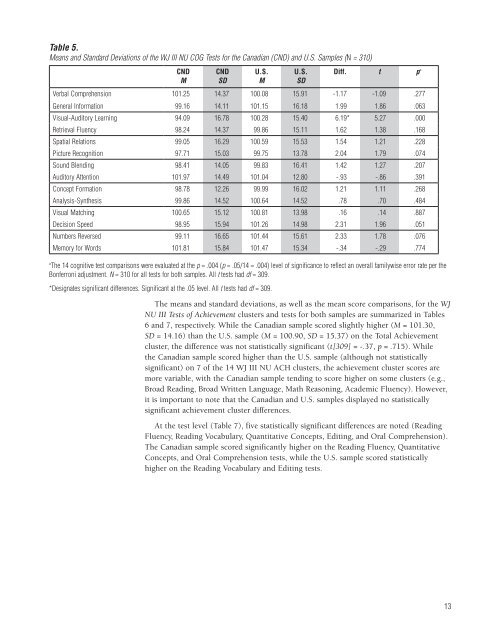
Table 5.Means and Standard Deviations of the WJ <strong>III</strong> NU COG Tests for the Canadian (CND) and U.S. Samples (N = 310)CNDMCNDSDU.S.MU.S.SDDiff. t p aVerbal Comprehension 101.25 14.37 100.08 15.91 -1.17 -1.09 .277General Information 99.16 14.11 101.15 16.18 1.99 1.86 .063Visual-Auditory Learning 94.09 16.78 100.28 15.40 6.19* 5.27 .000Retrieval Fluency 98.24 14.37 99.86 15.11 1.62 1.38 .168Spatial Relations 99.05 16.29 100.59 15.53 1.54 1.21 .228Picture Recognition 97.71 15.03 99.75 13.78 2.04 1.79 .074Sound Blending 98.41 14.05 99.83 16.41 1.42 1.27 .207Auditory Attention 101.97 14.49 101.04 12.80 -.93 -.86 .391Concept Formation 98.78 12.26 99.99 16.02 1.21 1.11 .268Analysis-Synthesis 99.86 14.52 100.64 14.52 .78 .70 .484Visual Matching 100.65 15.12 100.81 13.98 .16 .14 .887Decision Speed 98.95 15.94 101.26 14.98 2.31 1.96 .051Numbers Reversed 99.11 16.65 101.44 15.61 2.33 1.78 .076Memory for Words 101.81 15.84 101.47 15.34 -.34 -.29 .774a The 14 cognitive test comparisons were evaluated at the p = .004 (p = .05/14 = .004) level of significance to reflect an overall familywise error rate per theBonferroni adjustment. N = 310 for all tests for both samples. All t tests had df = 309.*Designates significant differences. Significant at the .05 level. All t tests had df = 309.The means and standard deviations, as well as the mean score comparisons, for the WJNU <strong>III</strong> Tests of Achievement clusters and tests for both samples are summarized in Tables6 and 7, respectively. While the Canadian sample scored slightly higher (M = 101.30,SD = 14.16) than the U.S. sample (M = 100.90, SD = 15.37) on the Total Achievementcluster, the difference was not statistically significant (t[309] = -.37, p = .715). Whilethe Canadian sample scored higher than the U.S. sample (although not statisticallysignificant) on 7 of the 14 WJ <strong>III</strong> NU ACH clusters, the achievement cluster scores aremore variable, with the Canadian sample tending to score higher on some clusters (e.g.,Broad Reading, Broad Written Language, Math Reasoning, Academic Fluency). However,it is important to note that the Canadian and U.S. samples displayed no statisticallysignificant achievement cluster differences.At the test level (Table 7), five statistically significant differences are noted (ReadingFluency, Reading Vocabulary, Quantitative Concepts, Editing, and Oral Comprehension).The Canadian sample scored significantly higher on the Reading Fluency, QuantitativeConcepts, and Oral Comprehension tests, while the U.S. sample scored statisticallyhigher on the Reading Vocabulary and Editing tests.13