Office of Naval Research - National Transportation Library
Office of Naval Research - National Transportation Library
Office of Naval Research - National Transportation Library

Create successful ePaper yourself
Turn your PDF publications into a flip-book with our unique Google optimized e-Paper software.
Appendix GAssessment <strong>of</strong> Short-Sea ShippingOptions for Domestic ApplicationsDecember 23, 2009Prepared for:Dr. Paul Rispin,<strong>Office</strong> <strong>of</strong> <strong>Naval</strong> <strong>Research</strong> (ONR),875 North Randolph Street, Room 273Arlington, VA 22203-1995Prepared by:Bahar Barami, Ph.D., Intermodal Infrastructure Security and Operations, RVT-51Michael Dyer, Engineer, Infrastructure and Facility Engineering, RVT-63Volpe <strong>National</strong> <strong>Transportation</strong> Systems Center<strong>Research</strong> and Innovative Technology Administration (RITA)US Department <strong>of</strong> <strong>Transportation</strong>55 BroadwayCambridge, MA 02142In partial fulfillment <strong>of</strong> the requirements for theReimbursable Agreement (RA)-VH99Agile Ports and Terminal Systems
PREFACE.............................................................................................................................................................5PURPOSE AND STUDY SCOPE .....................................................................................................................6SECTION 1.0 SHORT SEA SHIPPING IN THE U.S.: INFRASTRUCTURE AND CARGOCHARACTERISTICS..........................................................................................................................................71.1 CONCEPTS AND DEFINITIONS .....................................................................................................................7Early Institutional Forces Governing U.S. Coastal Shipping.......................................................................81-2 WATERWAY INFRASTRUCTURE AND FACILITIES.........................................................................................91-3 DOMESTIC COMMERCIAL CARGO TRAFFIC ..............................................................................................10SECTION 2.0 EXISTING SSS PRACTICES AND OPERATIONS............................................................142-1 CURRENT SSS SERVICE CORRIDORS .....................................................................................................142-2 CURRENT SSS MARKETS AND CARRIERS ...............................................................................................212-2-1 Inland Waterway Markets: Tug-Barge, COB and ATB Service ........................................................222-2-2 Coastal/Great Lakes Markets: Self-Propelled RoRo, COB, Fast Ferry............................................222-2-3 Coastal Container Feeder-Service on Self-Propelled Vessels ..........................................................28SECTION 3.0 MARKET CONDITIONS, SERVICE REQUIREMENTS AND POTENTIAL MARKETSIZE FOR VIABLE SSS SERVICE ................................................................................................................323-1 BASELINE COMMODITY MARKET CHARACTERISTICS...............................................................................323-2 REQUIREMENTS FOR VIABLE SSS SERVICE............................................................................................33Shipper Service Requirements ....................................................................................................................33Carrier Requirements for Market Entry .....................................................................................................34Commodity Market Requirements Favoring SSS Service ...........................................................................353-3 SSS CORRIDORS DESIGNATIONS ACCORDING TO POTENTIAL MARKET SIZE........................................36Market Size and Cost Parameters for each Corridor .................................................................................36SECTION 4.0 VESSELS AND THEIR RELATIVE PERFORMANCE.......................................................414-1 SELF-PROPELLED U.S. FLAG VESSELS...................................................................................................41Self-Propelled Tank Ships...........................................................................................................................42Self-Propelled RoRo, LoLo, LASH, and Feeder Ships................................................................................43Commercial High-Speed Catamaran Multi-Hull Vessels ...........................................................................45Military High Speed Multi-Hull RoRo, Trimaran, and LMSR Vessels .......................................................464-2 U.S FLEET OF TUG-BARGE VESSELS ......................................................................................................48Integrated Tug-Barge (ITB)........................................................................................................................49Articulated Tug-Barge (ATB)......................................................................................................................49SECTION 5.0 SSS COSTS: DIRECT CONSTRUCTION AND OPERATION COSTS VERSUSAVOIDED COSTS OF ALTERNATIVE MODES..........................................................................................535-1 VESSEL CONSTRUCTION AND OPERATING COST FOR SSS ....................................................................535-2 ESTIMATING REQUIRED FREIGHT RATE (RFR) FOR SSS.......................................................................545-3 ESTIMATING AVOIDED EXTERNAL COSTS OF HIGHWAY TRUCKING ........................................................56Avoided Costs <strong>of</strong> Urban Congestion...........................................................................................................57Avoided Costs <strong>of</strong> Highway Accidents and Spills.........................................................................................57Avoided Costs <strong>of</strong> Emissions and Air Pollution............................................................................................58Avoided Noise Costs ...................................................................................................................................60Avoided External Costs <strong>of</strong> Infrastructure Repair Not Paid for by User Fees.............................................605-4 ESTIMATING REDUCED COSTS OF MEETING FUTURE HIGHWAY CAPACITY NEEDS ...............................615-5 ESTIMATING THE POTENTIAL TO REDUCE FOSSIL FUEL CONSUMPTION.................................................635-6 ESTIMATING THE BENEFITS FROM IMPROVED DRIVER AND CREW PRODUCTIVITY.................................64SECTION 6.0 – SSS CHALLENGES, OPPORTUNITIES, AND POLICY OPTIONS.............................666-1 POTENTIAL IMPEDIMENTS TO EXPANDED SSS OPERATION....................................................................666-1-1 The Jones Act and the USCG Manning Requirements have Impeded the Deployment Self-PropelledVessels.........................................................................................................................................................66ONR SSS Final Report 2
6-1-2 Harbor Maintenance Tax (HMT) Raises the Costs <strong>of</strong> Shipping a Container by Water ....................686-1-3 Challenges Arising from the Failure to Account for External Costs Moving Freight.......................696-1-4 Challenges Arising from Lack <strong>of</strong> a Feeder Port System....................................................................696-1-5 Challenges Arising from the Failure to Integrate SSS in the Nation’s Freight Infrastructure..........696-2 OPPORTUNITIES AND RECOMMENDED POLICY OPTIONS ........................................................................706-2-1 Supporting the Design and Construction <strong>of</strong> More Efficient Self-Propelled Vessels..........................706-2-2 Removing the Disincentives for Domestic Marine Shipping by Exempting Import Containers fromDouble Payment <strong>of</strong> the HMT ......................................................................................................................716-2-3 Promoting Pricing Policies that Compensate for Lower External Costs <strong>of</strong> Marine Vessels andBolster Environmentally Efficient SSS Operations .....................................................................................726-2-4 Supporting a Feeder Port System and Transshipment Hubs: Lessons Learned from SuccessfulEuropean Operations..................................................................................................................................736-2-5 Deployment <strong>of</strong> Advanced Technologies could Facilitate Cost-Effective Marine Shipping andIntegrate SSS in the <strong>National</strong> Freight Network...........................................................................................76ACRONYMS.......................................................................................................................................................78REFERENCES...................................................................................................................................................80List <strong>of</strong> TablesTable 1 – SSS Freight Traffic by Value, Tonnage, and Ton-miles .....................................................12Table 2– Current SSS Corridors, Carriers, Vessel Types, and Service Frequency ..............................16Table 3 – Current Inventory <strong>of</strong> SSS Operators by Vessel Type and Corridor .....................................21Table 4 – Regional Cost and Transit Time Comparisons for Door-to-Door Delivery <strong>of</strong> a 40-FtContainer ..............................................................................................................................................38Table 5 - Total Shipper Costs per Mile and Percent Differential with Respect to Truck.....................38Table 6 – Comparison <strong>of</strong> Truck, Rail, and SSS Service.......................................................................39Table 7 - Cost <strong>of</strong> Moving a 40-foot Container in the Atlantic Corridor...............................................39Table 8 – Number <strong>of</strong> Jones Act Compliant Self-Propelled and Barge Vessels with PotentialApplication for SSS Service.................................................................................................................41Table 9 – Jones Act Compliant Self-Propelled Tank Ship and Non-Self-Propelled ATB Vessels inDomestic Commerce, 2007 ..................................................................................................................42Table 10 – Estimated Construction and Operating Costs for Representative SSS Vessels..................53Table 11 – Optimal SSS Speed and RFR rates for different Route Lengths........................................55Table 12 – A Comparison <strong>of</strong> Private and Public/External Costs <strong>of</strong> Moving a 40-foot FreightContainer in Two Corridors..................................................................................................................56Table 13 – Modal Comparison <strong>of</strong> Oil and Hazardous Materials Spill rates.........................................58Table 14 – Fuel Usage and Emission Levels for Truck, Rail, and Tug-Barge Modes.........................59Table 15 – TTI Estimates <strong>of</strong> Emissions per Ton Mile <strong>of</strong> Cargo Moved .............................................59Table 16 - CO2 Emissions for Alternative Modes ..............................................................................59Table 17 – Equivalency Units for SSS, Rail, and Truck ......................................................................62Table 18 – Equivalency Units for Carrying Capacity <strong>of</strong> Barge Tows and Alternative Highway andRail Modes ...........................................................................................................................................63Table 19 – Capacity Equivalency for Alternative Cargo Conveyance Modes....................................63ONR SSS Final Report 3
List <strong>of</strong> FiguresFigure 1 - U.S. Waterway Facilities by Geographic Region, 2007 ......................................................10Figure 2 - Waterborne Commerce <strong>of</strong> the United States .......................................................................11Figure 3 - Trends in Domestic Waterborne Commerce Ton-Miles, 1986-2005 ..................................13Figure 4 – SSS Corridors Identified by MARAD ................................................................................14Figure 5 – Major SSS Corridors and Services in North America.........................................................15Figure 6 - East Coast Region – North-South Corridor Map.................................................................18Figure 7 - East Coast Region – South Corridor Map ...........................................................................18Figure 8 - Gulf Coast and America's Heartland Corridors Map...........................................................19Figure 9 - West Coast Region - North Corridor Map...........................................................................19Figure 10 - West Coast Region - South Corridor Map.........................................................................20Figure 11 - Great Lakes Map................................................................................................................20Figure 12 – Columbia Coastal Transport Barge Tow...........................................................................23Figure 13 – Detroit Windsor Truck Ferry ............................................................................................24Figure 14 – OSG ATB Tug, under construction ..................................................................................25Figure 15 - Sea Trader, Osprey Line ....................................................................................................26Figure 16 - LoLo Barge at Pier, Osprey Line.......................................................................................27Figure 17 - TOTE Orca-Class Self-Propelled Ship..............................................................................28Figure 18 – Envisioned West Coast SSS Feeder Service Corridor ......................................................31Figure 19 – Domestic Waterborne Commerce by Commodity Group.................................................32Figure 20 - Overseas Houston Self- Propelled Tank Barge ...............................................................42Figure 21 - Austal Alakai Superferry ...................................................................................................45Figure 22 - Austal JHSV ......................................................................................................................47Figure 23 - Figure 23 Incat HSV-2 (Swift)...........................................................................................48Figure 24 - Hopper Barge Loaded with Containers ............................................................................49Figure 25 - “Deck” Barge Loaded with Containers .............................................................................52Figure 26 – Components <strong>of</strong> the External Costs <strong>of</strong> Moving a Container from Boston to New York....57Figure 27 – Modal Comparison <strong>of</strong> Ton Miles <strong>of</strong> Freight Carried per Gallon <strong>of</strong> Fuel.........................64ONR SSS Final Report 4
PrefaceThis report has been prepared for Dr. Paul Rispin, <strong>Office</strong> <strong>of</strong> <strong>Naval</strong> <strong>Research</strong> (ONR), as part<strong>of</strong> the research conducted by the Volpe Center in collaboration with the Center forCommercial Deployment <strong>of</strong> <strong>Transportation</strong> Technologies (CCDoTT). The report, originallysubmitted in a Draft form on June 30, 2009, was intended to build on the multi-year researchconducted at the Volpe Center and the CCDoTT on Agile Port Systems and High-Speed Shiptechnologies to assess the feasibility <strong>of</strong> dual-use deployment <strong>of</strong> the vessels. The projectactivities included the demonstration <strong>of</strong> the feasibility <strong>of</strong> domestic container feeder ports fora transportation and logistics system based on a generic short sea vessel focusing on the WestCoast operations for both domestic and international traffic.This report has been prepared by the Dr. Bahar Barami, Intermodal Infrastructure Securityand Operations (RVT-51) and Mr. Mike Dyer, Infrastructure and Facility Engineering (RVT-63). Dr. Paul Rispin has authorized granting <strong>of</strong> a clearance for the report to be distributed tothe members <strong>of</strong> the Committee on Marine <strong>Transportation</strong> System (CMTS) and the IntegratedAction Team (IAT) for conducting and Assessment <strong>of</strong> the MTS. This revised version <strong>of</strong> thedraft report reflects comments received from the ONR project sponsors, comments sent onSeptember 10, 2009 by Tanya Rawson, Port and Intermodal Security Division, Department<strong>of</strong> Homeland Security, and comments sent by James Pugh, MARAD, on September 22, 2009.Rod Cook, Chief, Intermodal Infrastructure Security and Operations Division, provided peerreview comments and quality control input.ONR SSS Final Report 5
Purpose and Study ScopeThe purpose <strong>of</strong> this study is to conduct a high-level analysis <strong>of</strong> markets for dual-use vesselswith potential military and commercial applications. The study conducts an assessment <strong>of</strong>the challenges and opportunities for SSS operations in the U.S. coastal and inland waterwaysfor the <strong>Office</strong> <strong>of</strong> <strong>Naval</strong> <strong>Research</strong> (ONR.) The emphasis will be on identifying theinfrastructure capacity constraints, vessel size, type and performance requirements, and theprospects for deployment <strong>of</strong> dual-use SSS vessels to meet military and civilian requirementsfor goods movement and logistics operations.One <strong>of</strong> the studies evaluated the feasibility <strong>of</strong> deploying dual-use High-Speed Trimaran andother ONR vessel technologies to meet the military and civilian supply chain servicerequirements for efficient door-to-door container service. Another project, funded throughthe CCDoTT FY07-08 program was designed to be a study on “East Coast Marine<strong>Transportation</strong> System Development based on High-Speed Trimaran (HST) for 140 53-FootTrailers” to assess the market potential for SSS operations to connect the ports <strong>of</strong> NewBedford and Fall River to Port Canaveral, Florida.This report will develop a broader context for the deployment <strong>of</strong> these dual-use technologiesby creating an analytical framework for the infrastructure, operational, vessel, and economicrequirements <strong>of</strong> viable and efficient SSS operations in the U.S., in the following section:Section 1.0 will review the SSS concepts and definitions and the institutional forcesin the U.S. governing the short sea operations in the context <strong>of</strong> the domestic marineinfrastructure and transportation markets;Section 2.0 will review the existing SSS practices, operations and freight corridors inthe U.S.;Section 3.0 will review SSS market conditions and service requirements, the factorfavoring SSS, and potential corridors based on estimated cargo volume and servicerequirements;Section 4.0 will describe vessel types and performance in the U.S.;Section 5.0 will document the cost components <strong>of</strong> SSS vessel construction andoperations and review research findings on impacts on freight capacity, energy use,and emissions;Section 6.0 will address challenges to market growth, opportunities for serviceimprovement, and policy options to promote SSS as a national transportation strategy.ONR SSS Final Report 6
Section 1.0 Short Sea Shipping in the U.S.: Infrastructureand Cargo Characteristics1.1 Concepts and DefinitionsThe term short sea shipping (SSS), commonly defined as “commercial waterbornetransportation that does not transit an ocean,” 1 refers to waterborne transportation <strong>of</strong>commercial freight between domestic ports using inland and intracoastal waterways. Today,a new term, Marine Highways, has been introduced to refer to this mode <strong>of</strong> transport.SSS is not a new mode <strong>of</strong> transporting goods. The practice dates back to early maritimecommercial practices when merchant vessels were small in cargo capacity and sailed withinsight <strong>of</strong> the coastline, moving cargo from one seaport to another. The mariners faced naturalhazards and threats to vessel safety, and had to follow sailing schedules dictated by thecondition <strong>of</strong> wind and tides. 2In the U.S. the historical context for SSS has been framed around the concept <strong>of</strong> maritimelaws and referred to by names such as “coastal trade,” “cabotage shipping,” “inlandshipping”, and “Jones Act service.” In fact, “cabotage shipping” has historically been usedinterchangeably with “coastal shipping” and in many applications the two terms define theSSS concept.Because <strong>of</strong> this historical context, two distinct definitions <strong>of</strong> the scope <strong>of</strong> SSS currently existin the U.S.: one that limits the scope to coastal shipping, and a broader one encompassing theentire scope <strong>of</strong> the coastal and inland waterways.The narrow perspective on the size <strong>of</strong> the SSS market limits the market only to the U.S.coastal traffic. According to this perspective, the distinction between coastal andriverine/brown-water shipping is crucial as far as the intent <strong>of</strong> the Jones Act is concerned. Tobe true to the spirit <strong>of</strong> the Jones Act, the advocates <strong>of</strong> this perspective maintain, only coastalshipping has utility for military power projection; riverine vessels have limited militaryutility because shallow water barges are incapable <strong>of</strong> transporting cargo to the combat theaterabroad. Because this limitation would thwart the rationale <strong>of</strong>fered for the legislativeprotection <strong>of</strong> the Jones Act, the proponents <strong>of</strong> this school <strong>of</strong> thought exclude not only riverinebarges that are incapable <strong>of</strong> sailing coastal routes, they also exclude domestic cargo routesfor which no rail or highway alternative exists and can only move by sea (e.g., Alaska orHawai’i). 3 Relying on this premise, several recent studies conducted on the feasibility <strong>of</strong>expanded SSS service in the U.S. have excluded shallow-, inland-, and brown-wateroperations that rely on tug-barge operations.1 MARAD, http://www.marad.dot.gov/marinehighways2 Gary A. Lombardo, “Short Sea Shipping: Practices, Opportunities and Challenges,” May 2004.3 This perspective is promoted by the researchers at the Institute <strong>of</strong> Global Maritime Studies (IGMS), inAmerica’s Deep Blue Highway: How Coastal Shipping Could Reduce Traffic Congestion, Lower Pollution, andBolster <strong>National</strong> Security, September 2008.ONR SSS Final Report 7
The broader scope for SSS includes riverine, shallow water, and Great Lakes routes,encompassing both existing markets and future market niches. According to this perspective,the relevant infrastructure boundaries <strong>of</strong> SSS operations are both the blue-water coastalwaterways as well as non-deep sea segments <strong>of</strong> the freight infrastructure. Theseinfrastructure segments are complementary to intermodal truck and rail transport andpotentially support an integrated model <strong>of</strong> domestic freight traffic flows. In this report, theterm SSS is used in the broad sense to encompass coastal, inland rivers, and the Great Lakesshipping.Early Institutional Forces Governing U.S. Coastal ShippingIn the 19 th century, coastal shipping was the dominant mode <strong>of</strong> transporting domestic andforeign trade goods in the U.S. In 1817, Congress passed the “cabotage law” barring foreignflaggedships from engaging in American coastal trade. The geographic reach <strong>of</strong> thiscabotage legislation was extensive and was eventually broadened to include trade betweenthe Atlantic and Pacific coasts and among non-contiguous parts <strong>of</strong> Puerto Rico, Alaska, andHawai’i.In 1860, coastal shipping engaged far more ships and crews than did traffic for overseastrade. In terms <strong>of</strong> tonnage, the volume <strong>of</strong> coastal trade equaled the tonnage carried in foreigntrade, as reported in a recent report by the Institute for Global Maritime Studies (IGMS)entitled America’s Deep Blue Highway. 4 According to the IGMS report, coastal shippingremained competitive, even though by mid 19 th century turnpikes had greatly improved andrailroads were firmly in place. Because builders <strong>of</strong> the nation’s railroad gave first priority tolaying tracks westward rather than north/south along the Atlantic seaboard, the continueddominance <strong>of</strong> Atlantic coastal trade was sustained. Coastal trade remained prosperous wellinto the 1860s, when “Coaster” ships were used to serve the new manufacturing industries,carrying textiles from New England cities to customers up and down the Atlantic coast andinto the Gulf as far as New Orleans, returning with items such as raw cotton and coal to meetthe region’s demand for raw material input and fuel. In 1830, New York was the nation’sleading port, followed by Philadelphia, Baltimore, Boston, New Orleans, and Charleston.Smaller ports along the coastal area served as “feeders” to these larger hubs. These “feederports” served as transshipment centers for both domestic and overseas traffic.Ship building as an industry peaked in the mid-19 th century. After 1865, American yardscould no longer compete with foreign-built shipyards and the industry went into a sharpdecline. However, coastal shipping thwarted competition from railroad for a bit longerbecause <strong>of</strong> prohibitions against railroads acquiring steamship operators. The MerchantMarine Act <strong>of</strong> 1920 and the related statutes, commonly known as the Jones Act, decreed thatvessels used to transport cargo and passenger to U.S. ports be owned by U.S. citizens, bebuilt in US ship yards and crewed by U.S. citizens. The passage <strong>of</strong> the Act coincided with aperiod in the nation’s transportation history in the 1920 associated with improved roads andintroduction <strong>of</strong> new cargo truck transport mode in competition with SSS.4 Institute for Global Maritime Studies, America’s Deep Blue Highway: How Coastal Shipping Could ReduceTraffic Congestion, Lower Pollution, and Bolster <strong>National</strong> Security, September 2008, http://www.igms.org; thestudy reports that in 1860, coastal trade carried some 2,644,000 tons <strong>of</strong> cargo compared to 2,545,000 tonscarried in foreign trade.ONR SSS Final Report 8
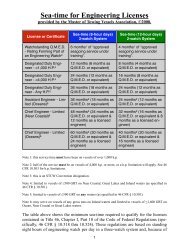
1-2 Waterway Infrastructure and FacilitiesThe types <strong>of</strong> SSS services provided in the U.S. are strictly governed by waterway facilitydepth, type <strong>of</strong> cargo carried, and location in the water transportation network for movinggoods and people referred to as the U.S. maritime transportation system (MTS). The U.S.MTS consists <strong>of</strong> 26,000 miles <strong>of</strong> navigable inland and intracoastal waterways, including11,000 miles <strong>of</strong> commercially active inland waterway navigable channels and 2,342 miles <strong>of</strong>Great Lakes and St. Lawrence Seaway. 5 These waterways consist <strong>of</strong> 9,584 “commercialfacilities” in the Atlantic, Gulf, and Pacific coasts, Great Lakes, and Inland waterways, eachcategorized according to channel depth and usage (Cargo, Passenger service, and Unused):• A total <strong>of</strong> 5,066 <strong>of</strong> the U.S. waterway facilities are deepwater facilities, where deepwateris defined as those with greater than 12 feet in depth. (Exceptions to this classificationare the 14- to 15-foot portions <strong>of</strong> the Columbia and Snake rivers that are classified asshallow water.)• A total <strong>of</strong> 4,518 <strong>of</strong> the U.S. waterway facilities are shallow water facilities, including theentire inland waterways facilities.The geographic distribution <strong>of</strong> the nation’s 9,584 deepwater and shallow water facilities byregion shows that deepwater facilities are fairly evenly distribution among the coastal andGulf ports, with the inland waterways exclusively classified as shallow-water facilities, asoutlined below and in Figure 1. Altogether, 21 percent <strong>of</strong> the facilities are located on theAtlantic Coast, 18 percent on the Pacific Coast, 24 percent on the inland rivers, 29 percent onthe Gulf Coast, and 8 percent on the Great Lakes: Atlantic Coast - 1,473 deepwater and 587 shallow water facilities Gulf Coast - 1,606 deepwater and 1,093 shallow water facilities Pacific Coast - 1,387 deepwater and 363 shallow water facilities Great Lakes - 600 deepwater and 154 shallow water facilities Inland river system - 2,321 shallow water facilities. 65 <strong>Office</strong> <strong>of</strong> Freight Management and Operations, Freight Facts and Figures, 2007, FHWA, USDOT.6 Based on data from USACE, U.S. Waterway System – <strong>Transportation</strong> Facts, 2007. Note that there are deepwater facilities on the inland waterway system as well, but the source does not identify them.ONR SSS Final Report 9
Figure 1 - U.S. Waterway Facilities by Geographic Region, 2007Geographic Distribution <strong>of</strong> the U.S.Waterway Facilities, 2007300025002000150010005000AtlanticGulfPacificGreat LakesInlandDeepw aterShallow WaterSource: Volpe Center-generated chart based on USACE, “The U.S. Waterway System – <strong>Transportation</strong> Facts”,Navigation Data Center, December 2007Two key points underscore the vast number <strong>of</strong> waterway facilities in the U.S., many <strong>of</strong> whichhave deepwater channels: Neither adequate channel depth nor access to waterway facilitiesin a region necessarily lead to active commercial use. Of the 5,066 deepwater terminals inthe U.S., only a fraction – approximately 300 terminals (or 6 percent) – handles significantvolumes <strong>of</strong> commercial traffic. About half <strong>of</strong> these 300 deepwater terminals are identified as“selected” by the Waterborne Commerce Report. These selected terminals handle more than1,000,000 tons <strong>of</strong> cargo annually. Of these, there are approximately 55 ports that handlemore than 10,000,000 tons annually, and have a channel depth <strong>of</strong> over 40 feet. In all, onlyabout half <strong>of</strong> all waterway facilities (5,279) are currently used for commercial cargo carriage.The remaining facilities are either used for passenger transportation (3,319 facilities) or are“unused” (986 facilities.) 71-3 Domestic Commercial Cargo TrafficUnlike the 19 th century shipping conditions, when a larger share <strong>of</strong> the nation’s cargotonnage was carried in domestic coastal traffic than in ocean-borne foreign trade, the volume<strong>of</strong> cargo carried for domestic trade today accounts for less than 40 percent <strong>of</strong> the total cargovolume. Today, foreign trade accounts for sixty two percent <strong>of</strong> the marine transportationshipments (1.6 billion short tons) and domestic trade for the remaining 38 percent (1 billionshort tons).The volume <strong>of</strong> commercial cargo shipped today through the marine transportation system(MTS) – with shipments amounting to 2.6 billion short tons <strong>of</strong> commercial freight – has7 USACE, The U.S. Waterway System – <strong>Transportation</strong> Facts”, Navigation Data Center, December 2007;http://www.iwr.usace.army.mil/NDC/factcard/fc07/factcard.pdfONR SSS Final Report 10
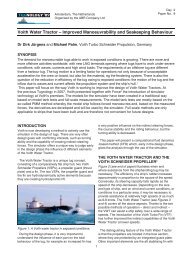
grown tw<strong>of</strong>old (from 1.3 billion tons) since 1967. The tonnage <strong>of</strong> goods transported fordomestic waterborne trade grew moderately until the 1980s, from 871 million tons to about 1billion tons (an 18 percent growth for the entire period,) but has since remained stagnant. Incontrast, the foreign waterborne commerce has grown from 466 million tons to 1.6 billiontons, a growth <strong>of</strong> 236 percent over the past four decades. Until 1993, domestic tonnageexceeded foreign trade tonnage by as much as a factor <strong>of</strong> 2. Subsequent to the rapid growthin the foreign-trade component <strong>of</strong> the U.S. waterborne commerce in the 1990s, a reversal inthe relative shares <strong>of</strong> domestic and foreign trade cargo has occurred. 8 Since 1994, theforeign trade component <strong>of</strong> the waterborne commerce has outpaced the domestic componentby 50% (Figure 2.)Figure 2 - Waterborne Commerce <strong>of</strong> the United StatesWaterborne Commerce in the U.S.1967-2006Millions <strong>of</strong> Short Tons3,0002,5002,0001,5001,00050001967197019751980198519901995200020052006Total Foreign Domestic.Source: Volpe Center-generated chart based on USACE, Waterborne Commerce <strong>of</strong> the US,Calendar Year 2006, Part 5, <strong>National</strong> Summaries.The distribution <strong>of</strong> the 1 billion tons <strong>of</strong> freight carried each year for domestic trade amongthe U.S. waterway segments is as follows:• Inland rivers carry over 60% <strong>of</strong> the tonnage (622 million tons);• Domestic ocean/coastwise, Gulf and St. Lawrence Seaway facilities carry less than athird <strong>of</strong> the volume (267 million tons); and the• Great Lakes carry the remaining 11 percent (115 million tons).Shares <strong>of</strong> the coastal, inland rivers and the Great Lakes traffic <strong>of</strong> the nation’s domesticfreight transportation have been moving on a downward slope. In the inland waterways,most <strong>of</strong> the waterborne transportation takes place on the Mississippi. Channel depthrestrictions and the presence <strong>of</strong> locks and dams in the Upper Mississippi, Illinois, and Ohio8 Waterborne Commerce <strong>of</strong> the United States, Calendar Year 2006, Part 5 – <strong>National</strong> Summaries, IWR,USACE, Release date: 07/04/2008.ONR SSS Final Report 11
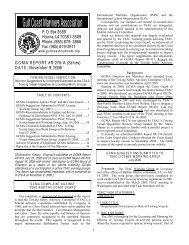
Rivers have restricted throughput for some <strong>of</strong> the facilities. Because <strong>of</strong> these infrastructureconstraints, the types <strong>of</strong> vessels used to carry cargo on these waterways have effectively beenrestricted to tugs and barges. 9 Because barges have traditionally carried low-value goods atlow speeds, the conventional expectations <strong>of</strong> the SSS growth potential in the U.S. have beenfor a low-growth scenario.Compared to over-the-road truck transportation, water transportation carriers receive only afraction <strong>of</strong> the total domestic freight revenues, less than 2 percent <strong>of</strong> the value <strong>of</strong> thedomestic freight carried in the lower 48 states. By tonnage, however, domestic waterborneshipping account for larger shares <strong>of</strong> the national cargo volume, depending on how the sharesare calculated. The data indicate the following distribution <strong>of</strong> freight shipments by value,tonnage, and ton miles for domestic shallow water and deep-water facilities. 10Table 1 – SSS Freight Traffic by Value, Tonnage, and Ton-milesMarine Facility Type Value (% U.S. CargoShipments)Tons (% U.S.Tonnage Carried)Ton Miles (% U.S.Ton Miles)Shallow Draft 0.7 3.9 6.7Great Lakes - 0.3 0.4Deep Draft 0.4 1.6 1.8Total Waterborne 1.1 5.8 9.0Source: Bureau <strong>of</strong> <strong>Transportation</strong> Statistics, U.S. DOT; the figures exclude wet bulk shipments and watertraffic on the nation’s inland waterways.The second factor contributing to the low levels <strong>of</strong> revenue generated in domestic waterbornemarkets is the continuing decline in the ton-miles or cargo carried on domestic waterways.As noted above in reference to the trends depicted in Figure 2, the tonnage carried on MTShas remained stable around 1 billion tons in the past decade; whereas the length <strong>of</strong> shipmentshas declined steadily. The average length <strong>of</strong> coastwise shipments declined from 1,496 milesin 1960 to 1,269 in 2004. Lower waterborne ton miles <strong>of</strong> freight not only reduce the level <strong>of</strong>revenues generated in the service, they also reduce the break-even distance at which domesticwater transport becomes a viable option. The total ton miles <strong>of</strong> domestic waterborne traffic(on coastal, Great Lakes, and inland waterways) declined from 873 billion ton-miles to 591billion ton-miles between 1986 and 2005 (Figure 3.)9 Of the 25,000 miles <strong>of</strong> navigable inland waterways and intra-coastal/coastal channels, 12,000 miles <strong>of</strong> thenavigable inland waterways capable <strong>of</strong> handling commercial traffic; there are over 1800 shallow waterterminals with channel depth <strong>of</strong> 14 feet or less (1,748 on the Mississippi River system, and 64 onColumbia/Snake River.)10 “Shipment Characteristics by Mode <strong>of</strong> Transport for the United States,” US Department <strong>of</strong> <strong>Transportation</strong>Bureau <strong>of</strong> <strong>Transportation</strong> Statistics, available fromhttp://www.bts.gov/publications/commodity_flow_survey/2002/united_states/html/table_01_b.html.ONR SSS Final Report 12
Figure 3 - Trends in Domestic Waterborne Commerce Ton-Miles, 1986-2005Domestic Waterborne Commerce,1986-2005Billion Short Ton-Miles10008006004002000198619901994199820022005Coastw iseInternalLakew iseTotalSource: Volpe generated chart based on data from USACE, Waterborne Commerce <strong>of</strong> the U.S. Calendar Year2005, Part 5, <strong>National</strong> Summaries, Table 1-9The flat domestic cargo tonnage volumes, coupled with the declining ton-miles in watertransportation, have created an underlying structural condition in the U.S. that has shiftedfreight transportation traffic away from the waterborne mode. The dampening effect <strong>of</strong> thisstructural condition on the U.S. SSS market share has been worsened by the influence <strong>of</strong>three related market forces: a) the growing demand for expedited truck service for movinghigh value, just-in-time shipments to regional distribution centers for inventoryreplenishment; b) emergence <strong>of</strong> major East-West large-volume, high-density rail corridorsfor the movement <strong>of</strong> imported goods; and the c) emergence <strong>of</strong> truck-dominatedtransshipment networks <strong>of</strong> inland distribution and consolidation centers in the major portregions. On balance, these factors have further dampened the growth <strong>of</strong> markets fordomestic water transportation, though many economic and policy factors have begun to shiftthe balance in favor <strong>of</strong> SSS, as addressed in Section 3.0 and 5.0.ONR SSS Final Report 13
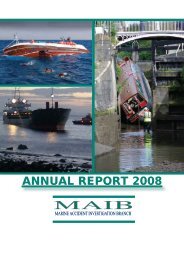
Section 2.0 Existing SSS Practices and OperationsThe Maritime Administration (MARAD) has defined the existing SSS corridors and carriersin the U.S. as part <strong>of</strong> the agency’s description <strong>of</strong> the Marine Highway (MH) Program. Notethat the scope <strong>of</strong> this study goes beyond the MARAD MH program. MARAD has pointedout that the MH program is for containers, trailers and rail cars only, and that no bulk cargoesare included. MARAD has also pointed out that the scope <strong>of</strong> the MH program also extends tothe <strong>of</strong>fshore foreign trades, such as Canada and Mexico. In this study, the scope <strong>of</strong> SSSoperations includes present and potential future bulk movements <strong>of</strong> cargo. 11Section 2-1 describes the corridors defines by MARAD. Section 2-2 describes the carrierscurrently serving the SSS markets.2-1 Current SSS Service CorridorsMARAD has identified about 40 marine highway coastal, intracoastal, and inland freightservices and 500 marine highway passenger services throughout the United States, includingservices provided to and from Canada, as depicted in Figure 4. 12Figure 4 – SSS Corridors Identified by MARADSource: http://www.marad.dot.gov11 Mr. James Pugh, MARAD, in comments sent on September 22, 2009, has pointed out that “Certainly, thereare bulk movements in short sea services, but they are not part <strong>of</strong> the Marine Highways program.”12 shttp://www.marad.dot.gov/documents/Marine_Highway_Program_brochure_(final.pdfONR SSS Final Report 14
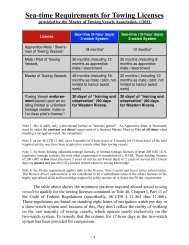
The SSS/Marine Highway services identified by MARAD are defined as cargo and passengerservices provided on the following vessel types:• Sea-going tug & barge vessels;• Riverine tug & barge combinations;• Intermodal operations involving container-on-barge (COB), and roll-on, roll-<strong>of</strong>f (RoRo);• Ferry services.Figure 5 depicts major corridors for SSS service in North America.Figure 5 – Major SSS Corridors and Services in North AmericaSource: http://www.marad.dot.govNote that some <strong>of</strong> the services identified by MARAD may no longer be operational. Table 2summarizes the existing SSS/Marine Highway Corridors as identified by MARAD.ONR SSS Final Report 15
Table 2– Current SSS Corridors, Carriers, Vessel Types, and Service FrequencyCorridor Carrier Vessel Type FrequencyEast CoastNew York – BostonColumbia Coastal COBWeeklyTransportOrient Point, NY- New London, CT Cross Sound FerryServiceFerry Service(Passenger, vehicle &2 ferries 7times dailytrailer)Norfolk – BaltimoreColumbia Coastal COBWeeklyTransportNorfolk - RichmondJames River Barge COB and RoRo WeeklyLine/ "64 Express"Elizabeth, NJ - San Juan, PR Horizon Lines Container, Reefer, WeeklyhazmatJacksonville (& the U.S. West Coast) Trailer Bridge COB, RoRo 3 weeklysailingsPort Everglades, FL – Puerto Rico Crowley Maritime COB, RoRo, (45ftdrybulk, 40 ft Reefer)Gulf Intracoastal WaterwayHouston - Pascagoula Osprey Lines Container WeeklyHouston – Brownsville/"Houston–Brownsville Barge Express Service"RichardsonMarine/SchaeferStevedoringContainerHouston - Puerto Rico Horizon Lines Container, Reefer &HazmatBrownsville - Port Manatee Sea Bridge Freight COB (600 TEUbarge)/general/ breakbulk service)Biweeklyserviceeveryfourteendaysa four-dayscheduledserviceAmerica's Heartland: Inland Waterways(The Mississippi, Ohio, and Missouri, Rivers up to the Great Lakes)New Orleans-Memphis Osprey Lines COB Weekly(Table continued on the following page)ONR SSS Final Report 16
Table 2 (Continued)Current SSS Corridors, Carriers, Vessel Types, and Service FrequencyCorridor Carrier Vessel Type FrequencyWest Coast and Alaska ServiceTacoma - Anchorage – Kodiak- Horizon Lines Container/WeeklyDutch HarborSpecialized CargoTacoma - Anchorage – Kodiak Horizon Lines Container/Specialized cargoTwo WeeklyServicesTacoma - AnchorageTOTEM OceanTrailersContainer, RoRo Two WeeklyServicesPacific Northwest- Hawaii Matson Navigation ContainerReefer, Special cargoWeeklyServiceTacoma – Oakland – Honolulu Horizon Lines Container Two WeeklyServicesDutch Harbor – KetchikanAlaskan MarineHighways SystemFerry, passenger/ carTacoma-Oakland-Honolulu Horizon Lines Container 3 weeklyLos Angeles-Honolulu-Oakland(California-Hawaii ExpressHorizon Lines Container 2 roundtripsailingsTacoma-Oakland-Honolulu-Guam Horizon Lines Container WeeklyOakland-Honolulu Matson Navigation Container,2 weeklySpecialized cargo,ReefersOakland-Long-Beach-Honolulu Matson Navigation COB, Specialized Weeklycargo, ReefersLos Angeles-Honolulu (Mid-Week Horizon Lines Container WeeklyExpress)PNW-Hawaii Matson Navigation Container, Reefer, WeeklySpecialized cargoGreat LakesDetroit-WindsorDetroit Windsor Hazmat,DailyTruck FerryPassenger/TruckOntario-Montreal McKeil Marine COBManitowaoc-LudingtonLake Michigan Car Passenger/truck/ Twice DailyFerryGeneral cargo FerryInterlake Services Various Carriers Various Cargo VariousSource: http://www.marad.dot.gov/ships_shipping_landing_page/mhi_home/mhp_map/mhp_ec-n_map/mhp_ec-n_map.htmONR SSS Final Report 17
Figure 6 - East Coast Region – North-South Corridor MapFigure 7 - East Coast Region – South Corridor MapONR SSS Final Report 18
Figure 8 - Gulf Coast and America's Heartland Corridors MapFigure 9 - West Coast Region - North Corridor MapSource: http://www.marad.dot.gov/ships_shipping_landing_page/mhi_home/mhp_map/mhp_ec-s_map/mhp_ec-s_map.htmONR SSS Final Report 19
Figure 10 - West Coast Region - South Corridor MapFigure 11 - Great Lakes MapONR SSS Final Report 20
2-2 Current SSS Markets and CarriersThe existing SSS corridors and carriers identified by MARAD’s Marine Highway Programare summarized in Table 3.Table 3 – Current Inventory <strong>of</strong> SSS Operators by Vessel Type and CorridorCarrier Vessels Service Region/CorridorAlaskan Marine Line RoRo AlaskaBridgeport Feeder Service RoRo Bridgeport, CTCross Sound Ferry Service Passenger/VehicleFerryOrient Point NY to NewLondon, CTColumbia CoastalContainer-on-barge NY-Boston, Norfolk-Baltimore(COB)Crowley MaritimeCOB, RoRo, Reefer, Port Everglades, Puerto RicoHMDetroit-Windsor Truck Ferry HM, Truck Ferry Great LakesFoss Maritime Self-propelled, COB Pacific West Coast,Columbia/Snake RiversHorizon LinesContainer, Reefer,HMHonolulu- Los Ángeles,Elizabeth, NJ-San Juan,Houston-Puerto RicoJames River Barge Lines COB, RoRo Route 64 Norfolk-RichmondMatson NavigationCOB, Oversized Pacific North WestCargoOsprey Lines/Sea TraderSelf propelled LoLo Houston-Pascagoula;Overseas Shipbuilding Group(OSG)Containership, COBSelf-propelledHandysize Tankships, ATBNew Orleans-MemphisEast, West, Gulf Coasts, AlaskaRichmond Marine Barge Express Houston-BrownsvilleSea Bridge COB, Break-bulk Brownsville-Port ManateeSea Point COB New Orleans-MemphisTidewater Bulk, Break-bulk Columbia, Snake RiversTotem Ocean Trailer Express Orca Class Self- Anchorage-Tacoma(TOTE)propelled RoRoTrailer Bridge RoRo, LoLo Jacksonville and Pacific CoastThree distinct SSS service markets are reflected in the SSS services summarized in Table 3above:a) Inland tug-barge transport for domestic shipments (including ATB);b) Coastal/Great Lakes services for domestic shipments with self-propelled vessels, fastferries or COB; andc) Feeder service to ocean carriers primarily on self-propelled vessel service.Each <strong>of</strong> the service classes fall into discrete market segments with fairly clear regional andgeographic boundaries and different vessel-service requirements, equipment need, andpricing. Service characteristics <strong>of</strong> each market segments, however, are <strong>of</strong>ten blurred andrepresent overlapping services. For instance, feeder services and coastal services overlap inthat they use similar self-propelled vessels for feedering, transshipment, and lighteringONR SSS Final Report 21
services, while many COB services conducted in coastal areas may or may not qualify to beclassed as feedering.2-2-1 Inland Waterway Markets: Tug-Barge, COB and ATB ServiceOf the total 1 billion tons <strong>of</strong> domestic freight transported by water, about 60 percent istransported on the in inland rivers. Tug-barge is the service traditionally used for inland rivertransport. Of the remaining domestic waterborne freight, about a third is carried on thecoastal waterways and the intracoastal Gulf routes. The Great Lakes carry the remaining 10percent <strong>of</strong> the domestic waterborne traffic.The fleet <strong>of</strong> vessels serving the domestic waterborne trade is comprised <strong>of</strong> about 28,000 drybulk barges, 4,200 liquid tank barges, and 4,560 tug-tow boats. The service, conducted at aspeed <strong>of</strong> about 5-7 knot on dry bulk hopper barges and liquid tank barges, has beenpredominantly for low-value, bulk commodities such as coal, minerals, petroleum, andgrains.2-2-2 Coastal/Great Lakes Markets: Self-Propelled RoRo, COB, FastFerryThis market is characterized as potential high-density domestic commodity markets thatcould support large volume <strong>of</strong> truckloads on RoRo. With the emergence <strong>of</strong> newlycontainerized bulk commodities, container-on-barge (COB) service is also a growing vesseltype for this market segment. Competition for SSS operators comes from rail carload andintermodal trailer service and long-haul trucking service. Some examples <strong>of</strong> SSS services inthis market include the following classes <strong>of</strong> service:• Self-propelled tanker fleets distributing domestic liquid bulk cargo and providinglightering service;• Self-propelled and COB/ATB vessels for domestic delivery <strong>of</strong> dry bulk cargo;• Fast Ferries, RoRo, and COB service for Great Lakes.Modernization <strong>of</strong> traditional tug-barge transport began about 30 years ago with introduction<strong>of</strong> the domestic COB service in the U.S. COB operations began along the Atlantic Coastrange and on the Columbia River System in the Pacific Northwest, when internationalcontainerization had reached a critical mass and pushed intermodal operations beyond thedeep water ports. Only a handful <strong>of</strong> the COB operations that began in 1975 has survived todate, with many businesses changing ownership structure. Of the 15 COB firms that beganoperations 30 years ago, the Alabama COB Feasibility study identified only five as still inoperation, as follows: 13• Columbia Coastal (New Jersey-based); <strong>of</strong>fering Coastal COB service;• Osprey Lines, LLC. (Texas-based); <strong>of</strong>fering Inland COB service;• Tidewater Marine (Washington-based); <strong>of</strong>fering Inland COB service;• Foss Maritime (Oregon-based); <strong>of</strong>fering Inland COB service;• ACBL (Indiana-based); <strong>of</strong>fering Inland COB.13 Reeves and Associates, “Analysis <strong>of</strong> the Potential Markets for Short Sea Shipping Services ove the Ports <strong>of</strong>Fall River and New Bedford,” prepared for the Massachusetts Department <strong>of</strong> Business and Technology andSeaport Advisory Council, March 29, 2006.ONR SSS Final Report 22
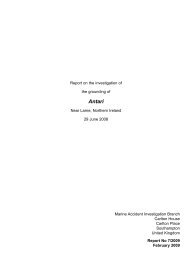
The above list <strong>of</strong> COB carriers does not include other SSS operators operating feeder servicewith small containerships/LoLo vessels, RoRo vessels and ferries, described in this section.The following is an overview <strong>of</strong> the SSS services that have been provided in the past or arecurrently in effect.Columbia Coastal TransportColumbia Coastal Transport provides COB service on the Atlantic coast, from Portland,Maine to Miami, as well as several Gulf and Caribbean ports. On the Norfolk to Baltimoreroute, according to MARAD, the service currently moves 1,800 containers per week bybarge. 14 The Columbia Coastal fleet <strong>of</strong> COB has capacities <strong>of</strong> 450 to 912 TEUs (5,300 to10,267 tons), including some refrigeration service (Figure 12.) 15Figure 12 – Columbia Coastal Transport Barge TowSource: Columbia Coastal Transport website.Their privately owned and operated tug-and-barge firm began operating the Albany ExpressBarge service in 2003, as part <strong>of</strong> an initiative to help alleviate port capacity problems at thePort Authority New York/New Jersey (PANY/NJ) and relieve congestion on crowdedroadways in the New York City area. This service moved containerized cargo up and downthe Hudson River between the PANYNJ and the Port <strong>of</strong> Albany and was part <strong>of</strong> a proposedPort Inland Distribution Network (PIDN) that would include multiple rail and short seashipping services between the PANY/NJ in the south and the Port <strong>of</strong> Albany in the north(approx. 150 miles). The service received a public subsidy to allow the service to charge arate 10 percent below the truck rate to compensate for the slower speed <strong>of</strong> moving containersby barge. The regional planning groups had hoped that within 15 years some 18 percent <strong>of</strong>the containerized cargo could move into and out <strong>of</strong> the PANY/NY by barge. However, evenwith a discount, the cargo volumes did not meet expectations during the operational period,and the twice-weekly Albany Express service has since been terminated.Detroit-Windsor Truck FerryThe Detroit-Windsor truck ferry has been operating since 1990 as a freight ferry on theDetroit River, carrying hazardous materials, oversized/overweight cargo (e.g., house trailersand industrial equipment), and some time sensitive shipments on a barge. The companyoperates a scheduled service on a reservation basis. During the 20-minute crossing, the14 As reported in the MARAD Marine Highway video, reporting that the carrier moves the equivalent <strong>of</strong> 3 lanes<strong>of</strong> traffic 8 miles long, at 1/8 th <strong>of</strong> the fuel consumption <strong>of</strong> trucks.15 Columbia Coastal transport website, http://www.columbia-coastal.com/CCTransport_New_Site_1_2004/index10B.html.ONR SSS Final Report 23
driver <strong>of</strong> the trailer stays with the load and then drives <strong>of</strong>f. The carrier has carved out a nichemarket in the corridor because both the Ambassador Bridge and the Detroit-Windsor Tunnelhave banned transport <strong>of</strong> hazardous materials. 16 Figure 13 shows the Detroit Windsor TruckFerry.Figure 13 – Detroit Windsor Truck FerrySource: http://www.truckferry.com/New England Fast FerryNew England Fast Ferry operates passenger service, with some limited cargo capacity,between New Bedford and Nantucket/Martha’s Vineyard, Massachusetts. The company isconsidering starting up a New Jersey-New Bedford RoRo cargo service with medium-speedvessels with catamaran-hull design. The new service is planning truck-competitive operationswith overnight bypass <strong>of</strong> congested New York area through scheduled departures from NewJersey at 8 pm, arriving in New Bedford 5:00 pm the next morning. Two catamaran vesselsare under consideration: a 260-foot RoRo with a 24 trailer capacity at a cost <strong>of</strong> $25 million,or a 320-ft RoRo with a 42-trailer capacity at a cost <strong>of</strong> $30 million. 17 The company isenvisioning a port-to-port, next morning container service at a rate <strong>of</strong> $350 per trailer. Keyto holding operating costs would be using the crew to load and discharge the trailers, ratherthan relying on more costly port labor. The service is still at the planning stage, looking for“cornerstone” contract with a major trucking company to provide base cargo volume. 18OSG Self-propelled Tanker Fleets Distributing Domestic Liquid Bulk Cargo andProviding Lightering ServiceOverseas Shipbuilding Group (OSG) is an example <strong>of</strong> a carrier delivering bulk liquidproducts for domestic commerce. OSG owns and operates 35 Jones Act tank vessels,consisting <strong>of</strong> “Handysize” (40,000 to 50,000 deadweight tons) tank ships and ArticulatedTug-Barge (ATBs) in all four U.S. coastwise markets: Gulf, west coast, east coast, and the16 NYU Rudin Center and Rutgers University, Bi-State Domestic Freight Ferries Study, prepared by Allison deCerreno, Martin Robins, Pippa Woods, Anne Strauss-Wieder, Ryan Yeung, September 2006.17 Note that these vessel cost estimates include lower-cost used and rehabilitated vessels.18 Reeves and Associates, “Analysis <strong>of</strong> the Potential Markets for Short Sea Shipping Services ove the Ports <strong>of</strong>Fall River and New Bedford,” prepared for the Massachusetts Department <strong>of</strong> Business and Technology andSeaport Advisory Council, March 29, 2006.ONR SSS Final Report 24
Alaska North Slope. The ATBs’ cargo capacities range from 25,000 to 54,000 deadweighttons. OSG is phasing out its older tank vessels and replacing them with state-<strong>of</strong>-the-artdouble hull tonnage, including twelve Veteran Class MT-46 Jones Act product tankers beingbuilt at the Aker Philadelphia Shipyard, as mandated by the Oil Pollution Act <strong>of</strong> 1990 (OPA90). 19 The OSG ATB fleet has cargo capacities similar to those <strong>of</strong> the Handysize tankers.These ATB units serve as both refined petroleum product carriers and crude oil lighteringvessels at U.S. ports where very large crude carriers (VLCC) use shuttle service to transfercargo to smaller ships <strong>of</strong>fshore, because depth restrictions at approaches to the terminalsprevent them from <strong>of</strong>floading directly at the port. Figure 14 shows a new OSG ATB tugboatunder construction.Figure 14 – OSG ATB Tug, under constructionSource: OSG website.Osprey Lines Self-propelled and COB Vessel Service in Gulf-Coast Markets forLiquid, Drybulk and Break-bulk CargoOsprey Lines, LLC started business in 2000 as a spin<strong>of</strong>f from Maersk’s acquisition <strong>of</strong> Sea-Land to provide U.S. flag container feeder service to transport import containers in the GulfCoast region. The service initially focused on COB operations between New Orleans andHouston, and then expanded into domestic service on the Sea Trader self-propelled lift onlift<strong>of</strong>f (LoLo) containerships. The Sea Trader was a 13.5-knot, 286-foot-long, 248 TEU(124 FEU) U.S. flag containership converted from an <strong>of</strong>fshore service vessel (OSV) capable<strong>of</strong> carrying 2,500 tons <strong>of</strong> cargo for both international and domestic containers. 20 The vessel19 http://www.osg.com/ks_usflag.htm20 Reeves and Associates, “Analysis <strong>of</strong> the Potential Markets for Short Sea Shipping Services ove the Ports <strong>of</strong>Fall River and New Bedford,” prepared for the Massachusetts Department <strong>of</strong> Business and Technology andSeaport Advisory Council, March 29, 2006.ONR SSS Final Report 25
operated on a 7-day cycle around the Gulf <strong>of</strong> Mexico, using boom cranes to load anddischarge containers, transporting finished manufactured goods and building supplies to andfrom ports in Houston, New Orleans, Tampa, and other cities. 21 The 13.5-knot speed <strong>of</strong> theSea Trader made the move about half the time <strong>of</strong> a tug-and-barge service. The faster speedallowed Osprey to compete with trucking along the Houston-Tampa routes because <strong>of</strong> thetruckers’ difficulty <strong>of</strong> finding drivers and the undesirability <strong>of</strong> the route for truckers (a longdistanceroute that required multiple transit days and had no backhaul loads.) Declining railservice in the corridor, and capacity shortage at the Port <strong>of</strong> Houston due to large influxes <strong>of</strong>international cargo also contributed to the initial success <strong>of</strong> the Sea Trader service that shiftsome traffic to Osprey. (Figure 15)Figure 15 - Sea Trader, Osprey LineSource: GAO Report, 2005.Though initially the service attracted enough business to cover most <strong>of</strong> its operating expensesand <strong>of</strong>fer truck competitive prices, the service had operated below full capacity. 22 OspreyLine has since discontinued the Sea Trader service, but continues to provide weekly COBand LoLo container on barge service with scheduled services 23 (Figure 15), on its AmericanHeartland Corridor service via the Mississippi River from the Gulf Intracoastal (Houston,Lake Charles, New Orleans, Mobile, and Pascagoula) to Memphis and Chicago. (Figure 16)21 A 7-day cycle means that the vessel returns to its port <strong>of</strong> origin every 7 days. A shipper moving goods fromHouston to Tampa, for example could make one shipment every 7 days on this service.22 GAO, “Freight <strong>Transportation</strong>: Short Sea Shipping Option Shows Importance <strong>of</strong> Systematic Approach toPublic Investment Decisions,” July 2005.23 Kirby Marine purchased majority holding in Osprey. Osprey’s founder formed a new Coach Line, and isplanning on purchases <strong>of</strong> four new 125 FEU, 13.5 know containerships to operate on the coastal and Gulfmarkets.ONR SSS Final Report 26
Figure 16 - LoLo Barge at Pier, Osprey LineSource: Osprey Line website.Trailer BridgeTrailer Bridge has provided LoLo and RoRo container on barge (COB) services betweenmainland coastal ports <strong>of</strong> New York and Jacksonville and Puerto Rico, and services to theWest Coast. The company operated the “Atlantic Highway” COB service between PortNewark and Jacksonville in 1999 with a transit time <strong>of</strong> 3 days. Among the corridor shipperswere General Motors with shipments <strong>of</strong> auto parts to and from San Juan, and paper and pulpshipments <strong>of</strong> forest products and lumber. The service had to be terminated when a hurricanedelayed the barges carrying the ToysRUS shipments, leading to the loss <strong>of</strong> the account.Contributing to the service vulnerabilities were the high costs <strong>of</strong> the Port <strong>of</strong> Newarklongshoremen. Trailer Bridge also operates the Triple Stack Box Carriers® service on theWest Coast, with a fleet <strong>of</strong> triple-deck RoRo vessels. Trailer Bridge, the first carrier to <strong>of</strong>fera fleet <strong>of</strong> LoLo vessels built for 53 foot containers, <strong>of</strong>fers integrated service with Pacerdoublestack trains, providing through bill-<strong>of</strong>-lading to Southern California in 12 days fromSan Juan and to Northern California/the Pacific Northwest in 16 days (from San Juan).Totem Ocean Trailer Express, Inc. (TOTE)TOTE, a privately owned company, began operating a fleet <strong>of</strong> 600 RoRo trailer cargo shipsin Alaska in 1975 between the Ports <strong>of</strong> Anchorage and Tacoma, Washington. The servicehas stayed consistently pr<strong>of</strong>itable and truck competitive. TOTE provides a short-sea servicebetween two U.S. ports with Jones Act ships, operating on a “blue water” route <strong>of</strong> over 1,400nautical miles with challenging conditions, in what is essentially an island service, that is,cargo carriage to a site virtually lacking access via surface transportation.The most modern ships in the TOTE fleet are the Orca class vessels with the followingattributes: Length: 839-feet; Beam: 118-feet; Service Speed: 24 knots; Capacity: 600 FEUcontainers plus 220 vehicles served by 13 internal ramps. The ships have fuel-efficientdiesel-electric plants with twin engines for navigation and propulsion system redundancy.There are also numerous environmental protective features such as double hull fuelONR SSS Final Report 27
compartments and a fresh water ballast system that does not discharge to the ocean. 24 Thehull is designed with high freeboard and a flared bow for operation in rough seas. (Figure 17)Figure 17 - TOTE Orca-Class Self-Propelled Ship.Source: TOTE website.2-2-3 Coastal Container Feeder-Service on Self-Propelled VesselsFeeder service is commonly defined as the movement <strong>of</strong> the container by sea along the samecoastline for the purpose <strong>of</strong> providing container service between major deepwater “megaports”and the region’s secondary and tertiary ports. A key characteristic <strong>of</strong> the feederservice is that coastal markets are served by small self-propelled containerships that transportimported containers from Tier 1 international gateways to regional or Tier 2 ports close toinland destination. 25Feeder services are <strong>of</strong>ten associated with the need for specialized vessels and ship designs forcoastal traffic to move containers from major import ports to smaller regional ports. Part <strong>of</strong>the reason is that strong currents along the Pacific Coast lanes preclude operations by pushpulltug barge operations. However, many <strong>of</strong> the self-propelled feeder services that havebeen planned or initiated in the past have not yet been implemented on a large scale. For afeeder port service to succeed, the domestic marine leg <strong>of</strong> the import containers needs to becoordinated with the schedules <strong>of</strong> the international deep-sea liner services from Asian andEuropean ports to the Tier 1 U.S. ports. Another barrier to greater expansion <strong>of</strong> feederservice on the West Coast is the relatively high cost <strong>of</strong> cargo handling which give truckingoperations an edge over marine transport, as evident from the account <strong>of</strong> why feeder serviceshave not been sustainable. Below are some examples <strong>of</strong> the current efforts in feeder service.Matson Navigation and Horizon Lines Feeder Container ServicesMatson Navigation and Horizon Lines are the only two container feeder shipping linesMARAD has identified in the U.S. These shipping lines operate only on the West Coastmarkets, with neither operating feeder services in mainland U.S. ports. Matson beganoperating the Pacific route service in the 19 th century in 1882, and later initiated containerservice between the U.S. Mainland-Hawaii, claiming some 70 percent <strong>of</strong> market share.24 Totem Ocean Trailer Express, Inc. website, http://www.totemocean.com/default.htm.25 Tami Porter, “U.S. Container Feeder Network: Status Update,” Horizon Lines, Inc., Presentation at theJournal <strong>of</strong> Commerce Marine Highway Conference, Jacksonville, Florida, April 2, 2009.ONR SSS Final Report 28
Between 1994 and 1999 Matson ran a single surplus 2,100-TEU container vessel on a weeklyservice between the Los-Angeles-Seattle and Los-Angeles-Vancouver lanes, a service thathas since been discontinued.26 Matson also took delivery <strong>of</strong> two 2,400-TEU containershipsat the cost <strong>of</strong> $100 million from the Kvaerner/Aker Shipyard in Philadelphia for servinginternational feeder service, empty-container repositioning, and domestic routes, but thisservice too was discontinued in 1999 due to poor financial performance. The service failedprimarily due to the high stevedoring costs. The company gained a key account withAnheuser Busch for domestic short-sea delivery but found it difficult to work out the detailedperformance arrangements or work out partnership agreements with trucking companies whosaw the service as a threat. 27Horizon Lines has operated some container services between Hawaii and Los Angeles in thepast and is planning feeder services for moving import containers for Maersk, Evergreen, orHanjin Shipping. As <strong>of</strong> this date, however, the feeder services have not started. Horizon hasmaintained that a Coastwise Container Feeder Network will serve as a safety valve forrelieving pressure at the nation’s “Gateway Corridor” ports, but that the recent economicdownturn has delayed the carrier’s plans to begin service. At a recent conference, Horizon’sdirector <strong>of</strong> terminal operations stressed the need for government action in support <strong>of</strong> the TitleXI ship building financing, elimination <strong>of</strong> the HMT for domestic container moves, anddevelopment <strong>of</strong> a <strong>National</strong> Port Development Plan. 28James River Barge and Norfolk-Richmond Feeder Cargo ServiceThe James River Barge Line initiated the Norfolk-Richmond “64 Express” tug-barge COBservice on December 1, 2008 with weekly tug-tow feeder service between Richmond andHampton Roads, using a hopper barge and pusher tug. The barge travels once weeklybetween the cities, carrying up to 128 20-foot containers. The service moves containersarriving at the deepwater port <strong>of</strong> Norfolk inland to Richmond on the river. (The companymotto is: “We've brought the ports <strong>of</strong> Hampton Roads 100 miles west!”) From Richmond,the service moves cargo back to Norfolk for shipment overseas. 29 The service is described asessentially a trucking service on the water that provides seamless door-to-door containerservice. The company relies on partnerships with trucking companies throughout centralVirginia and <strong>of</strong>fers rates that are competitive with all truck rates. The 64 Express sailsSunday at 1400 each week from Portsmouth Marine Terminal and 1700 from NorfolkInternational Terminal for Richmond; with cargo arriving in Richmond at 1000 on Monday,with door-to-door cargo delivery option available to shippers.Sea Point, LLCThe Sea Point service is an example <strong>of</strong> SSS feeder service for dealing with containerimbalance and the need for empty container repositioning. The service, however, no longer26 http://www.matson.com/matnav/about_us/index.html27 Reeves and Associates, “Analysis <strong>of</strong> the Potential Markets for Short Sea Shipping Services ove the Ports <strong>of</strong>Fall River and New Bedford,” prepared for the Massachusetts Department <strong>of</strong> Business and Technology andSeaport Advisory Council, March 29, 2006.28 Tami Porter, Horizon Lines Inc., Presentation at the Journal <strong>of</strong> Commerce Marine Highway Conference,Jacksonville, Florida, April 2, 2009.29 64 Express website, http://www.64express.com/home.aspx.ONR SSS Final Report 29
exists. 30 Sea Point service was developed as a container transshipment terminal in Venice,Louisiana, with plans to provide an alternative to west coast ports. Through these feederoperations, containers move into south Louisiana and are transshipped on COB to “MiddleAmerica”(defined on their route map to include the Gulf Coast and the Mississippi Riverbasin.) The Sea Point business plan consisted <strong>of</strong> <strong>of</strong>fering the shipper a trade<strong>of</strong>f between thesavings on inland transportation costs using barges and the added time required for “all watertransit”.31 The Port <strong>of</strong> Baton Rouge had promoted COB service as the preferred alternativefor container movements to the Gulf and Midwest states. 32West Coast Corridor Feeder Service ProspectsUnlike the East Coast, the prospects for a viable feeder service on the West Coast have beenconsidered dim by some because <strong>of</strong> labor issues, and lack <strong>of</strong> port density and minimal freightvolumes along the north-south cargo routes. A recent study conducted at the University <strong>of</strong>Southern California (USC) study has concluded that a RoRo feeder services on the WestCoast would be a viable option and possibly instrumental in alleviating congestion at thethree “mega-ports” <strong>of</strong> Los Angeles-Long Beach (LA/LB), San Francisco-Oakland, andSeattle-Tacoma. The study evaluated opportunities for re-directing empty container flows tosecondary ports, and for feedering and transloading the movement <strong>of</strong> international containersto and from the manufacturing areas on the U.S.-Mexico border. The study evaluated thetype <strong>of</strong> maritime and port operation best suited for these market segments, and determinedthat RoRo SSS vessels are most suitable for initial operations. This study also argued infavor <strong>of</strong> the establishment <strong>of</strong> regional port systems to provide an appropriate institutionalapparatus for the coordination <strong>of</strong> public and private investments in SSS. 33 The study foundthe feeder port concept feasible for RoRo services that require the movement <strong>of</strong> container-on-chassis/tractor-trailers. Because RoRo service can move the local export and importcontainers and international empty boxes within the regional port transload system, terminalhandlingcosts are avoided since they require only loading and unloading ramps. The studyidentified significant congestion and air quality benefits from a feeder port system comparedto the current pricing strategies implemented for relieving port congestion (e.g., PierPass feescharged trucking services for peak hour container pickup.) Pricing measures such asPierPass have the effect <strong>of</strong> shifting traffic in time. The impact <strong>of</strong> a feeder service, the studyconcluded, would be to shift traffic in place by strengthening container handling capacity atsmaller ports such as San Diego, Port Hueneme, Stockton, and Sacramento in California andports <strong>of</strong> Portland and Vancouver in Oregon. Figure 18 depicts the envisioned West Coastfeeder port service.30 As pointed out by Mr. James Pugh, MARAD, in comments sent on September 22, 2009.31 Sea Point website, http://sea-point.net/container/.32 Port <strong>of</strong> Baton Rouge website, http://www.portgbr.com/content.php?display=container.33 Le-Griffin and Moore, “Potential Impact <strong>of</strong> Short Sea Shipping in the Southern California Region”,University <strong>of</strong> Southern California (USC), Department <strong>of</strong> Civil and Environmental Engineering, <strong>Research</strong>Project Report, METRANS Project 65-A0047, February, 2006.ONR SSS Final Report 30
Figure 18 – Envisioned West Coast SSS Feeder Service CorridorSource: Le-Griffin and Moore, USC, February, 2006.To summarize, Section 2-1 described the existing SSS markets, as identified by MARAD infive key corridors served by about 16 carriers. Section 2-2 identified 3 prototype SSSmarkets: Inland Tug-Barge markets, Coastal/Great Lakes RoRo and Fast Ferry markets, andthe Coastal Feeder Network, showing that:• The traditional tug-barge service and new ATBs serve an important niche market for lowmargin,low priority shipments, and that they should remain a core market for SSSservice;• The Coastal and Great Lakes services need to be augmented by the service <strong>of</strong> a morerobust self-propelled fleet <strong>of</strong> vessels for RoRo, LoLo, and break-bulk service; thissegment has not been able to be sustained given the high costs <strong>of</strong> stevedoring services,short shipment distances that make competition with the trucks more difficult, andabsence <strong>of</strong> mass cargo volumes;• The Coastal container feeder markets have yet to be developed; they <strong>of</strong>fer the greatestpotential for incremental improvements in serving congested and capacity constrainedcoastal corridors for delivery <strong>of</strong> import containers.To assess the extent to which SSS services in these markets are potentially sustainable, and toidentify the factors that would make SSS a viable alternative for moving freight, accuratecost and operational data are needed. Many <strong>of</strong> the companies that in the past have beenactive are no longer in business, partly because <strong>of</strong> the current economic downturn.Operational data are currently lacking, partly because <strong>of</strong> the privately- held nature <strong>of</strong> thebusinesses. Sections 3 through 5 will attempt to provide a better understanding <strong>of</strong> theeconomic performance <strong>of</strong> these SSS operations.ONR SSS Final Report 31
Section 3.0 Market Conditions, Service Requirements andPotential Market Size for Viable SSS Service3-1 Baseline Commodity Market CharacteristicsThe composition <strong>of</strong> the domestic cargo shipped in the U.S. waterborne commerce ismarkedly different from the composition <strong>of</strong> cargo shipped in international trade. The U.S.domestic waterborne cargo trade is largely dominated by dry and liquid bulk products.Eighty five percent <strong>of</strong> the 1 billion tons <strong>of</strong> cargo shipped for domestic waterborne commercein 2006 was coal, bulk petroleum, crude materials and chemicals (Figure 19). These productsare transported in dry- or liquid-bulk form in self-propelled tankers, tank barges pulled bytugs, and in dry-bulk barges. Only about 15 percent <strong>of</strong> the domestic waterborne cargo – foodproducts and manufactured equipment – is currently suitable for containerization. Figure 19shows the breakdown <strong>of</strong> the domestic waterborne trade by commodity class.Figure 19 – Domestic Waterborne Commerce by Commodity Group8%PrimaryManufacGoods5%Domestic Waterborne Commerce byCommodity Group, 2006 (1.0 BillionShort Tons)Food/FarmProductsManufacEquipment2%Coal22%Chem&Related21%CrudeMaterials7%Petro&Petro Products35%Volpe generated chart based on IWR, USACE data.Adversely influencing the size <strong>of</strong> the domestic markets for waterborne trade are twointerrelated factors: the low value <strong>of</strong> the bulk cargo carried and the short distances shipped.Together, these two factors explain why the share <strong>of</strong> waterborne domestic cargo transportedin the U.S. is so small.Bulk commodities have lower per-unit cargo value than containerized cargo. Since shippingcharges are ad-valorem, domestic bulk commodities, dry or wet, have traditionally claimed asmall share <strong>of</strong> the transportation revenues. This condition has been further exacerbated whencoupled with large volumes <strong>of</strong> empty containers shipped by water, and increasingly shortershipment distances. Together these factors further stifle the growth <strong>of</strong> markets forwaterborne domestic cargo transportation.ONR SSS Final Report 32
3-2 Requirements for Viable SSS ServiceShippers and carriers have different requirements for a viable freight service. <strong>Research</strong>findings suggest that for a carrier, the primary requirement for a sustainable service is aminimum volume commitment; for a shipper, the primary requirement for using a service isreliability. A feedback loop or vicious cycle might be at the heart <strong>of</strong> much <strong>of</strong> the performancegap today: lack <strong>of</strong> service reliability for a SSS carrier may <strong>of</strong>ten be tied to the lack <strong>of</strong> volumecommitment. 34Shipper Service RequirementsFor the shipper, the critical service requirement for committing any level <strong>of</strong> cargo to SSScarriers is service reliability, followed by cost and transit time. A study on the feasibility <strong>of</strong> acontainer-on-barge (COB) movement <strong>of</strong> cargo within the freight corridor served by the Port<strong>of</strong> Mobile and the inland waterway system for the Alabama Freight Mobility programindicated that shippers give the reliability <strong>of</strong> the shipment arrival the highest priority (with 48percent considering it the highest priority), followed by cost (a high priority for 37 percent <strong>of</strong>the survey respondents) and transit times (high priority for 15 percent <strong>of</strong> respondents.) Thestudy found that longer transit times are not necessarily detrimental to SSS markets andconcluded with the following statement:“Alternative modes need not be faster or cheaper; they can be competitive if they arereliable.” 35Service unreliability has traditionally been caused by a combination <strong>of</strong> three factorsprevailing in tug-barge service: unpredictable service hours arising from weather-relatedvulnerabilities and seasonality <strong>of</strong> service, lack <strong>of</strong> scheduled services because <strong>of</strong> lack <strong>of</strong>volume commitment, and inherent delays caused by the difficulty <strong>of</strong> controlling the tugbargecombination coupled with the need to switch gears when entering the harbor. TheAlabama Freight Mobility Study described some <strong>of</strong> these root causes <strong>of</strong> service unreliabilityin tug-barge operations: 36a) Weather delays are <strong>of</strong>ten caused by uncertainties <strong>of</strong> towing a barge in a heavy storm;towed barges must <strong>of</strong>ten wait for seas to subside before crossing, particularly whenhazardous materials and petroleum products are carried.b) Difficulty <strong>of</strong> controlling towed barges in congested waterways and the frequent needfor helper tugs in port add to service unreliability; tug-barge tows face delays becausethey have to wait to cross the harbor entrance; once in the harbor they face furtherdelays because they must switch from towing gear to pushing gear;34 “Alabama Freight Mobility Study, Phase I: Business Perspectives on the Feasibility <strong>of</strong> Container-on-BargeService,” April 9, 2007.35 “Alabama Freight Mobility Study, Phase I: Business Perspectives on the Feasibility <strong>of</strong> Container-on-BargeService,” Prepared for the Coalition <strong>of</strong> Alabama Waterway Association, prepared by Hanson Pr<strong>of</strong>essionalServices, Inc., Nashville, Tennessee, April 9, 2007.36 “The Articulated Tug/Barge – AT/B: The History and State <strong>of</strong> the Art,” Robert P. Hill, President, Ocean gtug& Barge Engineering Corp. Undated.ONR SSS Final Report 33
c) Tug-barge vessels’ variable operating schedules pose an inherent conflict with thegrowing shift <strong>of</strong> the business model for petroleum terminal operations to supplydelivery methods centered on reduced inventory holdings and demand for on-timedelivery <strong>of</strong> replenishment products.This perception has reinforced the belief that because SSS service cannot compete withtrucking in transit times, then the only market niche for this service is the low-cost, lowprioritybulk shipments. There is evidence suggesting that this perception is not supported bywhat we know about the minimum service requirements <strong>of</strong> the carriers and shippers, and howthey can be reconciled.Carrier Requirements for Market EntrySuccess factors for surviving in the COB business include the ability to achieve economies <strong>of</strong>scale to satisfy specific markets and waterway operational constraints, and achieve areasonable balance <strong>of</strong> service reliability and cost performance. The Alabama COBFeasibility study identified the following success factors for COB SSS operations:• Bundling <strong>of</strong> services and prices to stay competitive with rail and trucking carriers. Thisincludes the ability to bundle land-side operations, terminal equipment, and stevedoringservices into their price since these charges are too complex for the customers to dealwith separately (particularly since these costs are highly visible and could potentiallycreate competitive disadvantage if not bundled properly.)• Enabling customers to leverage COB by using it as part <strong>of</strong> an intermodal end-to-endservice with the same bill <strong>of</strong> lading (BOL), with emphasis on demonstrating measures <strong>of</strong>“equivalency <strong>of</strong> performance” with rail and truck service;For traditional tug-barge service, the primary requirement for the entrance <strong>of</strong> a carrier in acorridor is minimum volume commitment. Carriers need a minimum critical mass thatwould allow them to enjoy modest scale economies. Service unreliability is <strong>of</strong>ten related tothe absence <strong>of</strong> a regular service schedule because the barge service has not obtained theminimum volume commitment to allow the service to be sustained on a regular basis, as theAlabama COB study has pointed out. This is because barge service is conducted under twooperational conditions:a) “Unit Tows” in which barges and tows are assigned for the purpose <strong>of</strong> uninterruptedmove from a single origin-destination port pair. This service format, prevalent in theliquid bulk petroleum and chemical processing industry, follows relatively reliableand predictable schedules;b) “Line-Haul Service” for moving dry cargo, in which a tug is assigned to a route, and anumber <strong>of</strong> barges are assigned to utilize the tug’s available capacity. This servicerelies on a “first come, first serve” arrangement with no predictable schedule. Whentraffic volume is low, barges in the line-haul arrangement are “tramped” to secureONR SSS Final Report 34
37Lack <strong>of</strong> volume commitment in a corridor, a commitment a carrier needs in order to achieveeconomies <strong>of</strong> scale in serving the corridor, <strong>of</strong>ten leads to service reliability problems whichin turn become a self-fulfilling prophesy, perpetuating the vicious cycle <strong>of</strong> the initial lack <strong>of</strong>volume commitment.The Alabama Feasibility Study concluded that carriers desiring to enter the market for COBtug-barge operations encounter two key impediments: a) they depend on mass volumecommitments, and b) they need to move faster to maintain their market share. Becausetowed barges are essentially low-cost, slow-speed conveyances, as shipping markets becomemore competitive, they can maintain their market share only if they move faster because theycannot lower their already low rates any further. 38Commodity Market Requirements Favoring SSS ServiceTug-barge vessels are particularly suited to meet a unique requirement <strong>of</strong> shippers <strong>of</strong> bulkcommodities. The Alabama COB study found that when shippers or logistics managersselect their mode <strong>of</strong> transport they take into account the cargo weight, dimension, and otherhandling requirements. 39 Many bulk commodities are heavy and “weigh out before they bulkout.” The study team conducted a survey <strong>of</strong> shippers in the Alabama and Port <strong>of</strong> Mobilecatchment area and found that a combination <strong>of</strong> the cargo weight and bulk determines theoptimal mode and conveyance. Cargo can be loaded to a container’s maximum capacity intwo ways:a) Fully loading the container by volume so that the container “cubes out”; orb) Loading the container to its capacity by weight, so that it “weighs out” before it cubesout.Most commonly shipped commodities on tug-barge service are heavy-weight products andhazardous materials that weigh out before they cube out a container. For dense and heavycargo, the container cannot be loaded to its maximum capacity because it would exceed thestructural limits <strong>of</strong> the box or the legal limits <strong>of</strong> the vehicle on the road. Approximately 45percent <strong>of</strong> the shippers weigh out before the volumetric capacity <strong>of</strong> the container is reached,the Alabama COB feasibility study found. The report pointed out that this cargo attributerepresents a significant advantage for COB operations over trucking for overweight loads.Shippers pay for the use <strong>of</strong> a container whether or not they can fill it up. Offering a COBservice will allow 45 percent <strong>of</strong> the shippers to load to a weight higher than the limitsimposed by the highway size and weight limits. Two common types <strong>of</strong> inland barges,designed to meet the waterway limits imposed by locks and waterway depth and dimensions,are available to meet these commodity needs:37 “Alabama Freight Mobility Study, Phase I: Business Perspectives on the Feasibility <strong>of</strong> Container-on-BargeService,” Prepared for the Coalition <strong>of</strong> Alabama Waterway Association, prepared by Hanson Pr<strong>of</strong>essionalServices, Inc., Nashville, Tennessee, April 9, 2007.38 Alabama Freight Mobility Study, April 2007.39 Alabama Freight Mobility Study, April 2007.ONR SSS Final Report 35
a) Hopper barges (195 feet long and 35 feet wide, carrying 1,500 tons <strong>of</strong> bulk cargo inwaterways 9 feet deep;) andb) Liquid tank barges (195 feet long and 35 feet wide, carrying 10,000 barrels <strong>of</strong> liquid.)The core commodities that are primary candidates for moving on inland waterways, asidentified in Section 3-1, have a high volume-to-value ratio, consisting <strong>of</strong> commodities suchas coal, petroleum, construction materials, grains, fertilizers, chemicals, and minerals. Thetug-barge operators that carry these commodities enjoy economies <strong>of</strong> scale in this market andcompete with railroads for market share. Competition from inland waterway operations hasbenefited the shippers and the environment in many regions as tug-barge operations not onlykeep the rail rates low, but also consume less fuel and generate lower emissions.3-3 SSS Corridors Designations According to Potential Market SizeA recent study conducted for the U.S. DOT identified four key potential short-sea corridorsin the U.S. These designated corridors are characterized by their potential for high volumes<strong>of</strong> traffic, balance <strong>of</strong> directional flows, prospective port locations outside <strong>of</strong> major congestionareas, and geographic diversity. The corridors were identified by Global Insight based on theparameters <strong>of</strong> a cost model developed to estimate corridor-level market penetration rates,terminal costs, distribution costs, and end-to-end line-haul and drayage costs to potentialcorridor shippers and carriers. The cost model developed a business case based on thecatchment area <strong>of</strong> a 250-mile port hinterland at each end <strong>of</strong> the SSS corridor. The SSSmarket penetration rate was calculated based on the assumption that as the distance from theport location grows the benefit from diversion <strong>of</strong> cargo from highway declines. In thisrespect, in addition to cargo volumes, port geography and competition from existing rail andtruck modes for door-to-door service represented critical factors in the estimated market sizefor SSS. The study identified the following four corridors:• Gulf to Atlantic Coast Corridor – between the ports <strong>of</strong> Beaumont, TX and Camden, NJ;• Atlantic Coast Corridor – between the ports <strong>of</strong> Port Canaveral, FL and New Haven, CT;• Pacific Coast Corridor – between the ports <strong>of</strong> San Diego and Oakland, CA and Astoria,Oregon;• Great Lakes Corridor – between the ports <strong>of</strong> Milwaukee, WI and Muskegon, MI. 40Market Size and Cost Parameters for each CorridorAs noted above, in making modal choices for shipping cargo from locations A to B, shippersmake trade<strong>of</strong>fs among several cost- and service- performance criteria. One trade<strong>of</strong>f isbetween delivery speed and price as shippers trade <strong>of</strong>f low transit times for a lower rate. TheGlobal Insight’s economic model estimated market penetration for SSS by balancingequipment utilization (to reflect carrier discounting in order to fill available vessel capacity)with reasonable modal shares for intermodal moves. Considering corridor-level traffic40 Global Insight, “Four Corridor Case Studies <strong>of</strong> Short-Sea Shipping Services: Short-Sea Shipping BusinessCase Analysis”, submitted to the U.S. DOT, <strong>Office</strong> <strong>of</strong> the Secretary, in association with Reeve & Associates,August 15, 2006.ONR SSS Final Report 36
volumes, density and direction, market penetration rates for SSS were assumed at 12 percentto 25 percent <strong>of</strong> the target corridor freight volume, based on estimated freight volumesobtained from the Federal Highway Administration (FHWA) Freight Analysis Framework(FAF) database.The relevant costs for SSS operations included direct vessel operating costs (vesselmovement and crew costs, maintenance costs, and fuel and consumables); capital costs; andcosts associated with trailer/container loading/unloading. Non-vessel operating costsincluded port/stevedoring charges and terminal costs, equipment leasing/purchase costs,drayage costs, sales/administration overhead, and the Harbor Maintenance Tax (HMT)charges. Also included were the costs associated with repositioning the container/trailers,costs in which rail and truck carriers have an advantage because <strong>of</strong> greater latitude in findingbackhaul loads. The study also compared “best-in-class” SSS costs with representative“status quo” carrier costs. Trucking costs included driver wages, trailer/tractor costs, fuel,tire, oil, insurance costs, and tolls.Vessel types included in the Global Insight study were assumed as follows:• Self-propelled RoRo and LoLo vessels were assumed to be available for moving trailersand container vessels in all corridors; (with the exception <strong>of</strong> the Great Lakes where onlyRoRo vessels were considered (to account for the short steaming distance across LakeMichigan and the subsequent premium on minimizing port time for trailer ferry service.)• Vessel capacities were assumed to be limited to 1,200 TEU LoLo containerships (600FEU containers or capacity for carrying 500 trailer loads with a mix <strong>of</strong> sizes); and RoRovessels were assumed to have a 400-trailer capacity on the Gulf Coast-Atlantic CoastCorridor and the Pacific Corridor. For the Atlantic Coast corridor, vessels modeled were200 TEU LoLo container vessels and 140-trailer RoRo vessels to reflect the relativelyhigh levels <strong>of</strong> freight density and service frequency requirements <strong>of</strong> the corridor.• Crew sizes <strong>of</strong> 12 for the larger coastal vessels and 10 for smaller vessels were assumed.This assumed that new manning agreements would be in effect with the Sea Farers Unionwith respect to the USCG manning requirements for self-propelled vessel operating alongthe contiguous coast <strong>of</strong> the United States.• Average vessel speed <strong>of</strong> 25 knots was assumed for the coastal corridors and 20 knot forthe Great Lakes. These relatively high speeds (compared to the lower tug-barge speeds<strong>of</strong> under-10-knots in inland waterways) were assumed in order to <strong>of</strong>fer “truckcompetitive”transit times.• Vessel capital costs were assumed lower than prices currently charged by U.S. shipyards.Comparing the regional costs and transit times for the three alternative modes are Tables 4and 5.ONR SSS Final Report 37
Table 4 – Regional Cost and Transit Time Comparisons for Door-to-Door Delivery <strong>of</strong> a40-Ft ContainerCorridorTruck Rail Intermodal SSSCosts Transit time(hours)Cost Transit time(hours)Costs Transit time(hours)Atlantic $1,881 54.5 $1,070 60.5 $1,045 70.0Gulf/Atlantic $2,405 67.5 $1,286 86.0 $1,314 111.0Pacific Coast $1,757 56.0 $1,014 62.0 $1,184 115.0(San Diego –Astoria)Great Lakes $599 9.5 NA NA $467 7.5Source: Global Insight, “Four Corridor Case Studies <strong>of</strong> Short-Sea Shipping Services: Short-Sea ShippingBusiness Case Analysis”, August 15, 2006.Table 5 - Total Shipper Costs per Mile and Percent Differential with Respect to TruckCost Components Truck Rail SSS (Status Quo) SSS (Best in Class)Gulf/North AtlanticShipper Costs/mile $1.77 $1.06 $1.13 $1.03% Differential - -40% -36% -42%South Atlantic-North AtlanticShipper Costs/mile $1.73 $1.09 $1.12 $1.00% Differential - -37% -35% -42%Pacific Coast, San Diego, CA-Astoria, ORShipper Costs/mile $1.58 $1.01 $1.29 $1.14% Differential -36% -18% -28%Pacific Coast, Oakland-AstoriaShipper Costs/mile $1.59 $1.35 $0.95 $0.86% Differential - -15% -40% -46%Pacific Coast, Oakland-San DiegoShipper Costs/mile $1.56 $1.90 $1.93 $1.75% Differential - +22% +22% +12%Great LakesShipper Costs/mile $1.51 NA $1.32 $1.24% Differential - NA -12% -18%Source: Global Insight, “Four Corridor Case Studies <strong>of</strong> Short-Sea Shipping Services: Short-Sea ShippingBusiness Case Analysis”, August 15, 2006.To summarize, assessment <strong>of</strong> the corridor market potential and the relative cost distributionfor each mode’s “value-chain” in the Global Insight study found the following for eachcorridor: In the Gulf/North Atlantics Coast Corridor, SSS provides the lowest cost to the shipperswhen compared to per-mile costs for the highway mode (based on highway- and notnautical-miles), though at significantly greater transit times. 41 Providing significant scale41 This is due to the longer distance that a vessel has to travel between Beaumont, Texas and Camden, NewJersey, since it has to steam around Key West before heading North or West. The choice <strong>of</strong> Camden for thedestination port was based on its large hinterland, but the location adds 3.5 hours to the travel time.ONR SSS Final Report 38
economies within the corridor are the large volumes <strong>of</strong> chemicals and petroleum andheavy loads <strong>of</strong> crude minerals and raw materials, the core commodities for SSS market.The hazardous nature <strong>of</strong> the cargo and the typical loads that exceed highway weight andsize limits and/or cause excessive pavement wear & tear, and therefore higher costs fortruck shippers provide the needed volume commitments to support reliable SSS serviceschedules. (Table 6)Table 6 – Comparison <strong>of</strong> Truck, Rail, and SSS Service(Gulf to Atlantic Coast Corridor)Performance Truck Rail SSS(StatusQuo)SSS (Bestin-Class”Total Miles (Door-to-Door) 1,470 1,699 2,091 2,091Transit Hours (Door-to-Door) 67.5 86.0 111.0 111.0Carrier Cost per Highway Mile ($) $1.64 $0.87 $099 $0.89Operating Margin 10% 30% 10% 10%Shipper Cost per Highway Mile * $1.77 $1.06 $1.13 $1.03Differential: SSS Shipper Costs- -40% -36% -42%Compared to Truck Shipper Costs**Source: Global Insight, “Four Corridor Case Studies <strong>of</strong> Short-Sea Shipping Services: Short-Sea ShippingBusiness Case Analysis”, submitted to the U.S. DOT, <strong>Office</strong> <strong>of</strong> the Secretary, in association with Reeve &Associates, August 15, 2006.* Shipper costs include any “markup” or pr<strong>of</strong>it margin added to the carrier’s costs, as well as incrementalinventory carrying costs incurred by slower transit times <strong>of</strong> rail and SSS service options, plus the HMT fee forSSS paid by the shipper.** The “Differential” is calculated as the ratio <strong>of</strong> the shipper costs for trucking service to shipper costs for railand SSS service. In the Atlantic Corridor (South Atlantic to North, SSS economics represent a significantadvantage over truck transportation, and a modest advantage over rail (Table 7.)Table 7 - Cost <strong>of</strong> Moving a 40-foot Container in the Atlantic Corridor(North Atlantic to South Atlantic)Cost Components Trucking Rail Intermodal SSS (Best-in-Class)Line haul $1,796 $544 $426Drayage (origin) $211 $219Terminal (origin) $52 $65Terminal (destination) $52 $65Drayage (destination) $211 $219Equipment $46 $51Repositioning $85Total cost $1,881 $1,070 $1,045Transit Time 54.4 hours 60.5 hours 70.0 hoursSource: Global Insight, “Four Corridor Case Studies <strong>of</strong> Short-Sea Shipping Services: Short-SeaShipping Business Case Analysis”, submitted to the U.S. DOT, <strong>Office</strong> <strong>of</strong> the Secretary, in associationwith Reeve & Associates, August 15, 2006.ONR SSS Final Report 39
In the South Pacific Corridor, Global Insight analysis showed mixed results. Inclusion <strong>of</strong>Oakland as a point in the corridor improved capacity utilization but had the drawback <strong>of</strong>higher costs <strong>of</strong> marine terminal stevedoring services (costs that can be as much as 50%higher than the Gulf and Atlantic Coast corridors.) The study considered these higherterminal costs as the “deal breaker” for SSS on the Pacific Coast. In the Great Lakes Corridor, the model results showed that SSS is superior to trucking inboth transit times and cost, assuming service frequency <strong>of</strong> 2 daily services in eachdirection. (Port pairs <strong>of</strong> Milwaukee, WI and Muskegon, MI connect two primaryinterstate networks (I-94 and I-90 in WI and I-96 in MI).Key conclusions about the conditions that make SSS commercially viable include:• The corridor is commercially viable when the cargo markets have enough density toenable relatively larger vessels that provide scale economies to operate. These scaleeconomies would lower per trip operating and capital costs and would allow high enoughservice frequency to be truck competitive.• SSS service is commercially viable and competitive with ground alternative on a door-todoorbasis when the vessel capital and crew costs and marine terminal stevedoringexpenses are reasonable (i.e., achieved at “best in class” levels.) This parity is achievedin three <strong>of</strong> the four corridors. Pacific Coast is less competitive because <strong>of</strong> high terminalcosts.• SSS is particularly competitive for heavy loads and hazardous shipments that generallymove over the road.• When SSS provides a more direct port-to-port routing and/or avoids areas <strong>of</strong> trafficbottleneck and urban congestion it can be highly competitive in both transit times andcosts, as in the Great Lakes Corridor.To summarize, Section 3.0 identified the shipper and carrier requirements for service cost,speed and reliability, and developed operating cost estimates for SSS operations based onoperational scenarios developed for four freight corridors. The Corridor designation andmarket sizing study indicate that with the exception <strong>of</strong> one segment in the West Coast (theOakland-San Diego Corridor) all corridors could potentially support a viable SSS operationin some segments, with shipper costs lower than alternative truck costs at rates between 12 to40 percent.ONR SSS Final Report 40
Section 4.0 Vessels and their Relative PerformanceFeasibility and sustainability <strong>of</strong> a reliable SSS service within any freight corridor within theU.S. is closely linked to the cargo markets served in the corridor, the geography <strong>of</strong> the regionand its port system, and the available vessels and lift equipment. This section providesinformation on the SSS vessel cost structure by describing the spectrum <strong>of</strong> vessel typessuitable for SSS service, including conventional tug-tow combinations, tankers and selfpropelledcommercial and military ships and ferries for serving coastal (blue-water) andriverine (brown-water) freight markets.Generally two broad classes <strong>of</strong> vessels are used for non deep-sea shipping: self-propelledvessels and tug-barge combinations. Tug-Barge combinations are currently the dominantvessel types for SSS service, including Articulated Tug-Barges (ATB) that operate atrelatively low speeds (<strong>of</strong>ten less than 10 knots per hour.) Self-propelled vessels include shipsthat carry containers (lift on-lift-<strong>of</strong>f or LoLo ships), trailers (roll on-roll-<strong>of</strong>f, or RoRo ships),small petroleum tankers that serve as “lightering ships” for larger oil tankers, and ships thatcarry barges (called Lighter (Barge) Aboard Ship or LASH vessels). These vessels areconstructed in a variety <strong>of</strong> speed and hull types for civilian and military purposes. 42Table 8 shows the current inventory <strong>of</strong> the Jones Act compliant U.S.-flag fleet <strong>of</strong>approximately 37,000 vessels, consisting primarily <strong>of</strong> dry bulk and liquid barges. Somepublications have put the size <strong>of</strong> the fleet to 39,000. 43 Note that not all the U.S. Flag vesselsoperate in the domestic coastal trade or on inland waterways.Table 8 – Number <strong>of</strong> Jones Act Compliant Self-Propelled and Barge Vessels withPotential Application for SSS ServiceUS Flag Vessels (County <strong>of</strong> Registry)# <strong>of</strong> JonesAct VesselsSelf Propelled Tankers 95Self-Propelled Freight Ships (Container, Dry-bulk, RoRo, General Cargo) 200Tug/Tow boats 4,560Dry Bulk Barges 28,000Liquid Bulk barges 4,200Total Jones Act Fleet 37,055Source: MARAD, based on data from the United States Army Corps <strong>of</strong> Engineers.4-1 Self-Propelled U.S. Flag VesselsSelf-propelled vessels suitable for SSS service in the U.S. are relatively small in numbers (afleet size <strong>of</strong> fewer than 300) and range <strong>of</strong> capabilities. The following sections describe thecurrently active or potential fleet for coastal and/or inland SSS operations.42 Mr. James Pugh, MARAD, in an e-mail sent on September 22, 2009, has pointed out that the MH programhas not identified any LASH operations.43 Maritime Cabotage, Annual Report, 2007, and the Jones Act Report, November 2007.ONR SSS Final Report 41
Self-Propelled Tank ShipsIn 2007, the tank vessels serving the U.S. coastal trade included crude tankers (also calledcrude carriers), product tankers, and tank-barges, including Articulated Tank Barges or ATB(Table 9.) ATBs are classified as non-self-propelled tug-barge combinations, as described inSection 4-2.Table 9 – Jones Act Compliant Self-Propelled Tank Ship and Non-Self-Propelled ATBVessels in Domestic Commerce, 2007Type Fleet DWT MetricTonsTon Miles(Billion)AverageMiles perShipment(Million)Self-Propelled Crude Tankers 13 2,068 27.8 44.9 1,615Self-Propelled Product Tankers 44 1,909 35.6 44.7 1,256Tank Barges/ATB 116 2,045 67.4 30.1 447Total 173 6,022 130.8 119.7 915Source: MARAD, Coastal Tank Vessel Market Snapshot, 2007, <strong>Office</strong> <strong>of</strong> Policy and Plans, August 2008,Tables 1 and 3.According to the MARAD Fleet Report on the inventory and traffic volumes for coastal tankvessels, the volume <strong>of</strong> trade carried on crude carriers and product tankers, measured bymetric tons carried, declined moderately between 2002 and 2007, while the volume <strong>of</strong> tradeon tank barges stayed relatively stable. MARAD has reported that new tank vessels are moreproductive than the older vessels they have replaced because they require less maintenanceand dry-docking time. New tankers also have 2 to 3 times more pumping capacity (and lesstime required for load per discharge) than older tankers. Figure 20 shows a Self-propelledLube Oil Barge with the following characteristics: 46,000 deadweight tons, 183 meters long,33.2 meters in breadth, 12.2 meters draft, service speed 15 knots, cargo pumps at 3,600meters 3 /hour (15,800 gpm).Figure 20 - Overseas Houston Self- Propelled Tank BargeSource: Pr<strong>of</strong>essional Mariner website, https://www.pr<strong>of</strong>essionalmariner.comMARAD has attributed the decline in the self-propelled product- and crude-tanker tradeslargely to “import substitution” in the petroleum trades. In 2007, imports accounted for 65ONR SSS Final Report 42
percent <strong>of</strong> U.S. consumption <strong>of</strong> petroleum products, up from 58 percent five yearspreviously. The inventory <strong>of</strong> tank barges, however, grew by 52 vessels between 2002 and2007, to a total <strong>of</strong> 116 (99 <strong>of</strong> which were double-hull bottoms.) The relative growth in thetank-barge fleet and tonnage trade, according to the MARAD report, reflects the steadilygrowing markets for domestic oil and petroleum products, and the fact that tank bargescomplement imports by redistributing products in the intra-coastal trades. MARAD hasidentified three service markets for the U.S. tanker fleet: 44• Crude tankers serving the Alaska and West Coast crude oil trades;• Product tankers serving the coastal and inter-coastal petroleum products and chemicaltrades, but also supplementing crude carriers in the Alaska/West Coast crude oil trade;• Tank barges and ATBs moving petroleum products and chemicals in the coastal andshort-sea haul (Gulf inter-coastal to South Atlantic) trades.MARAD has pointed out that the transition to double-hull tank bottoms has also been afactor in the growth in the tank-barge fleet, reporting that the year-end 2007 orders fordouble-hull tank barges and product tankers were at record levels and exceeded the existing25-year old single-hull fleets. MARAD has cautioned that given the expected upgrade andexpansion <strong>of</strong> the coastal product tanker and tank barge fleet, tank vessel operators “will facea significant risk <strong>of</strong> underutilized vessels and reduced earnings.” 45 Recent shipbuildingactivity for the U.S. short sea trade has been focused on tank ships, including the followingtank ships built in the U.S. shipyards:o Aker Philadelphia Shipyard has built 3 new 46,000 deadweight ton (dwt) doublehulledproduct tankers for Overseas Ship-Holding Group (OSG), leading a class <strong>of</strong> 16vessels (Figure 14).o General Dynamics Nassco has built the Golden State, leading a class <strong>of</strong> nine 49,000dwt ton product tankers for U.S. SSS operations.o Atlantic Marine has completed assembly <strong>of</strong> three 42,400-dwt product carriers withtwin-screw diesel electric propulsion as part <strong>of</strong> a modular construction processinvolving several partners, for AHL Shipping. 46Self-Propelled RoRo, LoLo, LASH, and Feeder ShipsFleet data on the number <strong>of</strong> Roll-on/Roll-<strong>of</strong>f (RoRo) and Lift on/Lift-<strong>of</strong>f (LoLo) ships inU.S. Flag vessels indicate that there are about 40 RoRo vessels and 75 LoLo containerships.MARAD fleet data suggest that the U.S. flag RoRo vessels have been growing in numbers(from 32 in 2001 to 40 in 2005), while the containership fleet has declined slightly (from 78to 75). It is not known how many <strong>of</strong> these Jones Act vessels operate in domestic SSSoperations. Totem Express is an example <strong>of</strong> a successful deployment <strong>of</strong> self-propelled U.S.flag ships for domestic service.44 MARAD, Coastal Tank Vessel Market Snapshot, 2007, <strong>Office</strong> <strong>of</strong> Policy and Plans, August 2008.45 MARAD, Coastal Tank Vessel Market Snapshot, 2007, <strong>Office</strong> <strong>of</strong> Policy and Plans, August 2008, p. 8.46 https://www.pr<strong>of</strong>essionalmariner.com, December 2008.ONR SSS Final Report 43
Lakers are examples <strong>of</strong> self-propelled bulk cargo vessels designed specially for the GreatLakes. The vast majority <strong>of</strong> the Lakers are self-unloading dry bulk carriers, allowing thecargo to be released through hatches that feed a conveyor belt running along the bottoms <strong>of</strong>the ship. The configuration allows vessels to unload at a rate <strong>of</strong> up to 1,000 metric tons perhour without the need for shoreside personnel or equipment. Has a fleet <strong>of</strong> 13 AmericanFleet 1,000 feet (300 meter) Lakers that operate on the GLDLS. Single longest route is Port<strong>of</strong> Duluth-Superior down as far as Lake Erie Canal. Lakers carry iron ore and coal fordomestic steel production, transport coal for electricity, and move limestone for cementproduction. Because the upper lake ships operate exclusively on freshwater, they experienceless corrosion and enjoy life spans <strong>of</strong> up to 50 years, compared to 25 years for ocean goingships. The size <strong>of</strong> the Lakers prevents them from transiting Welland Canal so they operateonly in the upper four Great Lakes. 47RoRo Feeder Ships are a variation <strong>of</strong> a feeder containership used to convey vehicles or otherlarge cargo. In a RoRo ship containers are placed on wheeled conveyors that are drivenaboard the ship through cargo hold doors in the sides and stern <strong>of</strong> the ship, then thecontainers are moved by ramps and elevators to their places in the cargo hold. The driver'scab is detached from the conveyor and driven back on shore. The container and conveyorremain on board to be unloaded at their destination.Lighter (Barge) Aboard Ship (LASH) Vessels represent a higher-speed version <strong>of</strong> thecontainership. On LASH vessels, barges (lighters) loaded with cargo are hoisted on boardthe 800-feet long vessel by a crane on board the ship and stored in cargo holds. The hostvessel could be a break bulk ship on which the barge is directly loaded. The advantage <strong>of</strong>LASH vessels is that they can be moved easily ashore or transported up rivers in areas thatlack marine facilities. Barge-carrying ships provide a new transport capability that mayinfluence military logistics in ports and over undeveloped beaches. To explore militaryapplications <strong>of</strong> these new 'floating containers,' DOD has conducted demonstration studieswhere LASH barges were used to perform a variety <strong>of</strong> sea tests at Coronado, California. Thetests related to barge towing, handling and maneuvering, barge marshalling (clustering) atsea, cargo handling from barges at sea, and helicopter/ barge interaction. The testsdemonstrated that cargo barges from commercial barge-carrying ships can be handled andunloaded by the amphibious forces.The U.S. Maritime Security Program (MSP) maintains a modern U.S.-flag fleet providingmilitary access to vessels and vessel capacity. As <strong>of</strong> October 1, 2008, the MSP fleetconsisted <strong>of</strong> the following 13 carriers and 59 U.S. flat vessels:1. American International Shipping, LLC (1 RO/RO vessel)2. APL Marine Services, Ltd. (9 containerships)3. Central Gulf Lines, Inc. (4 RO/RO vessels)4. Farrell Lines Inc. (2 RO/RO and 3 containerships)5. Fidelio Limited Partnership (7 RO/RO vessels)6. Hapag-Lloyd USA, LLC (5 Geared Container vessels)47 GLSLS Study: Final Report, Prepared for Transport Canada, USACE, USDOT, St. Lawrence SeawayManagement Corporation, St. Lawrence Seaway Development Corporation, Environment Canada, U.S. Fish &Wildlife, Fall 2007.ONR SSS Final Report 44
7. Liberty Global Logistics (1 RO/RO vessel)8. Maersk Line, Ltd. (17 containerships and 2 Geared container vessels)9. Marmar Tanker LLC (1 tanker)10. Luxmar Tanker LLC (1 tanker)11. Patriot Shipping LLC (1 Heavy Lift)12. Patriot Titan LLC (1 Heavy Lift vessel)13. Waterman Steamship Corp. (2 RO/RO, 2 Geared Container vessels.)Commercial High-Speed Catamaran Multi-Hull VesselsMany different types <strong>of</strong> commercial multi-hull and high-speed vessels have been developedin the past thirty years, mostly in the passenger trade, whether as ferries or as excursionvessels (e.g., whale watching, eco-tours). Catamarans have dominated this class and grownin size and capacity, accompanied by advances in power plants, propulsion units (i.e., waterjets as an alternative to propellers), ride control, and navigation. Hull and superstructureconstruction <strong>of</strong> these craft are nearly universally <strong>of</strong> aluminum. The largest catamaranstopped out at about 110 meters in length in the late 1990s and remain there today.Incat, a 112 meter diesel-powered high speed catamaran is an example <strong>of</strong> the currentevolution <strong>of</strong> the type. It has an 800 passenger/355 cars capacity (total deadweight <strong>of</strong> 1,380tons), with a 38 to 47 knots service speed and 36,000 KW (48,000 hp) power. For the U.S.Jones Act markets, the Alakai, owned and operated by Hawaii Super Ferry Inc., operatedbetween Oahu and Maui, with a capacity <strong>of</strong> 866 passengers and 282 cars built by AustalUSA (Mobile, AL). The service speed was 35 knots from four marine diesels rated at 8,177KW (10,966 hp) each, a total <strong>of</strong> 32,710 KW (43,864 hp). 48 Hawaii Super Ferry is no longerin operation. 49 Figure shows the Austal Alakai Supeferry, 107 meters long, 23.8 meters inbreadth, 3.6 meters draft.Figure 21 - Austal Alakai SuperferrySource: Austal website, http://www.austal.com/files/delivery/DS_HawaiiSuperferry.pdf.48 Austal website, http://www.austal.com/files/delivery/DS_HawaiiSuperferry.pdf.49 Tanya Rawson, DHS, in an e-mail dated September 10, 2009, pointed out that Hawaii Super Ferry stoppedoperations in March 2009 and entered bankruptcy proceedings in July 2009.ONR SSS Final Report 45
Fast Freighters (or Fast Ferries) are self propelled vessels that use powerful engines withhigher fuel consumption to operate at high speeds. Examples are the auto and truck ferries inservice New England and the Great Lakes. Typical fast ferries use 20 times more fuel perTEU per mile than containerships. The GLSLS study on new vessel technologies concludedthat the most promising waterborne vessel technologies are small and large 20-knotcontainerships that can carry both international and domestic containers. 50Partial Air Cushion Supper Catamaran (PACSCAT) is a new technology at the design stageconsidered for operation on the Great Lakes/St. Lawrence Seaway (GLSLS). The vessel isdesigned as a “surface-effect ship”, i.e., a vessel that uses an air cushion to partially lift itselfout <strong>of</strong> the water. The prototype has been developed for operation on the GLSLS to reducethe draft <strong>of</strong> the vessel as well as its wake. At lower speeds, water displacement mode is ineffect; at higher speed the vessels raises itself out <strong>of</strong> the water, an improvement achieved atthe cost <strong>of</strong> higher fuel consumption. 51Military High Speed Multi-Hull RoRo, Trimaran, and LMSR VesselsThe U.S. military has leased the RoRo HSV-X1 (Joint Venture, jointly developed by theArmy, Navy, Marines, and Coast Guard) and TSV-1X (Spearhead, developed by the Army),Incat 96-meter and 98-meter wave-piercing catamarans, respectively, and run them throughmulti-year trials to evaluate their performance and help define future operational roles.These vessels were also used in service for sustainment deliveries <strong>of</strong> Army prepositionedstocks and troop transport. The U.S. military has entered into similar leasing and test andevaluation programs with Austal, including the West Pac Express (Marines) and JHSV(Army and Navy). The West Pac Express is a RoRo vessel with 2,500 square meters <strong>of</strong>vehicle deck space and seating for 900 troops. The JHSV (635 deadweight tons, 103 meterslong) is also a RoRo vessel, with 2,500 square meters <strong>of</strong> vehicle deck space and seating for900 troops (see Figure 22). 5250 GLSLS Study: Final Report, Prepared for Transport Canada, USACE, USDOT, St. Lawrence SeawayManagement Corporation, St. Lawrence Seaway Development Corporation, Environment Canada, U.S. Fish &Wildlife, Fall 2007.51GLSLS Study: Final Report, Prepared for Transport Canada, USACE, USDOT, St. Lawrence SeawayManagement Corporation, St. Lawrence Seaway Development Corporation, Environment Canada, U.S. Fish &Wildlife, Fall 2007.52 Volpe Center, “Theater Support Vessel (TSV) Evaluation”, for the U.S. Army Tank-automotive &Armaments Command, November 2007. The leases on the HSV-X1 and TSV-1X were not renewed, in partbecause <strong>of</strong> significant critical systems problems identified during ocean crossings. An analysis by the VolpeCenter for the U.S. Army Tank-automotive & Armaments Command recommended against renewing the TSV-1X lease, noting the failure <strong>of</strong> the superstructure vibration/dampening system and subsequent misalignment <strong>of</strong>he superstructure (deckhouse) with the hull, air supply, exhaust, and quality problems for the main engines andthe ship service diesel generators, and unacceptably long parts delivery and repair times.ONR SSS Final Report 46
Figure 22 - Austal JHSVSource: Austal website, http://www.austal.com/index.Military Multi-Hull High-Speed Trailership (HSTT-180) is another potential vessel for SSSnot yet proven feasible for commercial domestic operations. The HSTT-180 is a vesselintended for dual-use with a dual powering arrangement for two service speeds and modifiedmilitary configuration that includes a spare deck over the top cargo deck for additional cargoarea for light weight materiel. Its principal characteristics are: 181 meters in length, 32meters beam, and 8 meters draft; commercial deadweight <strong>of</strong> 2,000 tons, and cargo area <strong>of</strong>2,680 square meters. 53 The Center for the Commercial Deployment <strong>of</strong> <strong>Transportation</strong>Technologies (CCDoTT) is conducting research for ONR on HSTT-180. The HSTT-180power plant consists <strong>of</strong> four marine diesel engines with a total power <strong>of</strong> 32,000 KW (43,000hp) installed in the center and wing hulls and two gas turbines <strong>of</strong> 36,000 KW (48,000 hp)both installed in the center hull. The designers identify service speeds <strong>of</strong> 26 knots using thethree diesel engines and 40 knots using all four engines. The HSTT designers have identified40 knots as a service speed in both military and commercial modes <strong>of</strong> operation.Cost comparisons <strong>of</strong> the High Speed Trimaran Trailership HSTT-180 vis-à-vis traditionaltug-barge in studies conducted by CCDoTT were conducted for the U.S. west coast SSSservices on several routes <strong>of</strong> various lengths. For the large 27-knot RoRo container ship,they found that a Los Angeles -to-San Francisco service would cost $1,341 to $1,783 percontainer compared with an average truck cost <strong>of</strong> $950 paid by shippers ($2.78/mile). Thestudy estimated that the largest contributors to the total cost (accounting for approximately80 percent <strong>of</strong> the total per trailer cost) were the fuel, drayage, and stevedoring components <strong>of</strong>costs associated with handling containers twice in port. 54 Herbert Engineering and SAICinvestigated the economics <strong>of</strong> container shipments on the Trimaran Trailership HSTT-180and found that the freight rate per mile ranged between $2.75 and $3.85 per trailer-equivalenthighway mile), based on the assumption <strong>of</strong> a 26-knot service speed from four diesel engines(32 MW). 55 Figure 23 shows Incat HSV (Swift), 627 deadweight tons, 98 meters long, 27meters in breadth, 3.4 meters draft.53 Vom Saal et al, Dual-Use Short Sea Shipping Trimaran Trailership HSTT-180”, Marine Technology, v. 42,number 3, July 2005.54 CCDoTT, “Operational Development <strong>of</strong> Short Sea Shipping to Serve the Pacific Coast”, CooperativeAgreement No. N00014-04-2-0003, Agile Port and High Speed Ship Technologies, July 2008.55 Vom Saal et al, Marine Technology, July 2005.ONR SSS Final Report 47
Figure 23 - Figure 23 Incat HSV-2 (Swift)Source: Military Sealift Command Ship Inventory website,http://www.msc.navy.mil/inventory/ships.asp?ship=163&type=HighSpeedVessel.Strategic deployment <strong>of</strong> military vessels is currently carried out by the fleet <strong>of</strong> Large MediumSpeed Roll-On-Roll-Off (LMSR) ships and commercial RoRo vessels. The LMSR is part <strong>of</strong>the Navy's Military Sealift Command (MSC) which provides ocean transportation for DODcargo and U.S. forces around the world. More than 70 strategic sealift ships transport militaryequipment, supplies and petroleum to support U.S. forces overseas. Sealift capacity hasgrown primarily by replacing smaller, aging ships with new large-capacity, medium-speedroll-on/roll-<strong>of</strong>f ships. The LMSRs provide the platforms for the Army’s afloat prepositioningprogram and add significant square footage to the surge fleet. In addition, the Marine Corpsis adding 3 additional RO/RO ships to the service’s Maritime Prepositioning Ships program,bringing the total to 16.4-2 U.S Fleet <strong>of</strong> Tug-Barge VesselsA fleet <strong>of</strong> conventional tug-barge combinations dominates the U.S. waterborne traffic fordomestic commercial traffic. The typical inland tow, e.g., those operating on the MississippiRiver, is a tugboat connected to a raft <strong>of</strong> barges by wires, with the barges – up to 35 innumber – themselves connected to each other in a tow by wires. As noted in Section 4-1,there are currently about 28,000 barges and 4,560 tug boats in use in the U.S. As far asfederal safety and regulatory requirements are concerned, a tug is a full-class ocean vesselthat meets the national and international maritime standards for operating in coastal areas.These safety regulations also require a tug escort for tankers carrying petroleum oils,pursuant to 46 CFR regulations. As far as the USCG manning requirements are concerned,some types <strong>of</strong> tugs are treated differently from self-propelled vessels, and require a smallercrew size, as described below. Figure 24 shows a hopper barge loaded with containers.ONR SSS Final Report 48
Figure 24 - Hopper Barge Loaded with ContainersSource: Bautch, Doris (Great Lakes Region Director, MARAD), presentation to meeting <strong>of</strong> the Society <strong>of</strong> <strong>Naval</strong>Architects and Marine Engineers, “Heartland Intermodal Partnership”, January 27, 2005More advanced versions <strong>of</strong> the tug-barge combination are two generations <strong>of</strong> tug-bargevessels, Integrated Tug-Barge (ITB) and Articulated Tug-Barge (ATB), designed to eliminatethe tow line and achieve better efficiency and control in ocean conditions, as describedbelow.Integrated Tug-Barge (ITB)Integrated Tug-Barge (ITB), a combination <strong>of</strong> tug and barge vessels characterized by a rigidconnection between the two vessels, has been around since the late 1800s. The modernversion <strong>of</strong> ITB, in service since the 1950s, was the first design evolution to marry the tug andthe barge and eliminate the long tow lines (“hawse”) in common use for long range bargemovements in coastal waters. The components <strong>of</strong> an ITB are typically connected togetherrigidly by many steel cables/wires, with the intent <strong>of</strong> operating as a single hydrodynamicbody. The advantages <strong>of</strong> this arrangement relative to the tug-tow – less wave-makingresistance <strong>of</strong> a virtual single vessel and better directional control <strong>of</strong> the barge by the tug –have been known by naval architects for over 100 years.The design <strong>of</strong> an ITB was conceived in such a way that allows the vessel to operate in onemode only, i.e., as a tug pushing a barge, and does not have the ability to separate and towunder differing sea conditions. The Coast Guard treats ITBs as self-propelled vessels and hascreated regulations to address their safety issues and manning requirements, raising thevessels’ construction and operating costs. Because <strong>of</strong> the higher constructions and manningcosts, and for reasons related to maintenance difficulties with the wire connections, no newITBs have been constructed in the U.S. since the 1980s. 56Articulated Tug-Barge (ATB)Articulated Tug Barge (ATB) is a vessel that allows tug and the barge to operateindependently as a tug and tow together or separately with other vessels. The existing fleet<strong>of</strong> ATBs in the U.S. consists primarily <strong>of</strong> large, 10,000+ DTW tank barges with hinge-like56 Hill, “The Articulated Tug/barge - AT/B, The History and State <strong>of</strong> the Art, undated,http://www.oceantugbarge.com/PDF/history.pdf.ONR SSS Final Report 49
connections between the tug and the barge. These connections increase the stability, speed,and maneuverability <strong>of</strong> the tug-barge unit compared to traditional units, as described in thefollowing segment.Currently there are about 166 Jones Act ATBs in the U.S. fleet, 99 <strong>of</strong> which are doublehulled.The modern ATBs have improved significantly on the performance <strong>of</strong> ITB and haveaddressed some <strong>of</strong> the tug-barge disadvantages. New ATBs have proven superior inperformance to traditional tug-barge combinations and move about 20 percent faster.The ATB, first conceptualized by naval architect Edwin Fletcher in the early 1970’s, is asingle-degree-<strong>of</strong>-freedom system involving large transverse pins connecting the tug’s bowand barge’s stern. This arrangement enables the ATB to function hydrodynamically muchlike a self-propelled ship and reduces wave-induced hull loads and stresses in both tug andbarge by allowing them to rotate freely relative to each other about the transverse axis.ATBs are now growing in size and number in the United States, particularly in the bulk oiltrade.ATB’s more sophisticated design helps it to better combine the economics <strong>of</strong> tugboat andbarge operation with the speed and weather-reliability <strong>of</strong> a ship, mainly through optimizedhydrodynamic flow for the connected units. This results in service speeds up to 13 knots forbarges in bulk cargo services and up to 15 knots in RoRo or container services, comparedwith the typical 7-knot speed <strong>of</strong> a tug-tow. 57ATB vessels have emerged as the unintended beneficiaries <strong>of</strong> the differential treatment <strong>of</strong>tug-barge and self-propelled vessels. The growth in the ATB vessel market in the recentyears has in turn contributed to the improved prospects for SSS operations in the U.S. Asnoted above, an ATB is an assembly <strong>of</strong> a tug and a barge that stays coupled throughspecially-designed machinery at most times but can be decoupled. ATBs are thus regulatedas tugs and barges and not as ships, face lower operating costs, and have smaller crewrequirements than self-propelled ships with the same voyage, service, cargo and capacity.ATBs have other inherent operating advantages such as higher flexibility and safety, and canbe cheaper to operate than standard tug & barge, but they are also more efficient and lesscostly to operate than tug-barge groupings such as ITBs that are classified as ships.The differential treatment <strong>of</strong> non-self-propelled vessels has benefited the prospects forexpansion <strong>of</strong> SSS service because <strong>of</strong> the superior performance <strong>of</strong> ATBs compared totraditional tug-barge combinations. Though on the grounds <strong>of</strong> economic efficiency thecriticism <strong>of</strong> the Federal regulations for differential treatment <strong>of</strong> self-propelled and tug-bargevessels is valid, it should be noted that because <strong>of</strong> the superior efficiency <strong>of</strong> ATBs comparedto conventional tug-barge combinations, the SSS markets have benefited significantly fromavailability <strong>of</strong> lower-cost and reasonably efficient ATBs, even if they are not as fast and fuelefficient than self propelled ships. With the growing diversity <strong>of</strong> SSS markets in the U.S.,the hope is that faster and more fuel-efficient self-propelled vessels will enter the market andexpand the choices available to users.The Crowley Maritime Intercon System is a good example <strong>of</strong> an ATB with articulatedconnection between the tug and barge consisting <strong>of</strong> a pair <strong>of</strong> port and starboard rams in the57 Ibid.ONR SSS Final Report 50
hull structure <strong>of</strong> the tug. The end <strong>of</strong> each ram is geared to engage a vertical rack <strong>of</strong> teeth onthe barge notch wall at a chosen height allowing for choices <strong>of</strong> draft for both units(depending on loading and sea conditions). This establishes the transverse horizontal axisallowing independent pitching motions <strong>of</strong> the tug and the barge. Crowley has described theadvantages <strong>of</strong> the articulated (or ‘hinged’) connection system between the tug and barge in itsATB system an important feature for allowing relative movement about the transverse axisand independent pitching motion <strong>of</strong> the tug and barge. This feature, not previously availablewith an ITB, has greatly reduced structural loads and stresses at the point <strong>of</strong> connection andreduced the excessive load on the barge hull that wave-induced motions generate. CrowleyMaritime has also identified several other advantages:Improved reliability/safety over towed barges;Improved operating efficiency over towed barges and tankers;Lower capital cost compared to new tankers;Faster construction cycle, as ATB's can be delivered in a fraction <strong>of</strong> the timecompared to new-build tankers; 58Good directional stability for new barges; andMany safety features similar to those found on modern tank ships.ATB vessels are available as “lightering ships” for liquid bulk transport. “Lighteringoperations” involving delivery <strong>of</strong> partial loads from large crude oil tankers too heavy forentry in the harbor or for transporting petroleum products from refineries to markets haveemerged as growing markets. The growing demand for ATB in SSS lightering service isbeing met by newly built ATBs and Handy-sized tank ships, as inventoried Section 4-1. Thenew fleet <strong>of</strong> ATB liquid bulk tank barges has grown larger in size and capacity and hasimproved transit times and safety and environmental protection features relative to towedbarges. ATBs also have capital- and operating-cost advantages relative to tank ships,advantages that compensate for their slower speeds. In fact, the larger new liquid bulk ATBsare approaching and even in some cases exceeding the specifications <strong>of</strong> modern Handy-sizedtank ships in cargo capacity, speed, and pumping rates. Although tank ships have advantagesin range, speed, and operational capability for blue-water operations, ATB vessels canperform very well for dedicated SSS operations in the future. ATBs now coming into serviceare nearly all built for the liquid bulk trade, and are not suitable for alternate use as containercarriers because <strong>of</strong> the pumping gear and other fixed appurtenances on deck. Fleetconstruction data show that none <strong>of</strong> the current container-on-barge (COB) services, eitheractive or proposed, involves the use <strong>of</strong> ATBs. Future entrance <strong>of</strong> ATBs for COB operationswould significantly increase operating speeds and reduce transit times and would be likely to<strong>of</strong>fer new opportunities for improved COB service performance. Figure 25 shows a “Deck”barge loaded with containers.58 Crowley Marine website, http://www.crowley.com/petroleum-chemical-transportation/atb-advantages.aspONR SSS Final Report 51
Figure 25 - “Deck” Barge Loaded with ContainersSource: MARAD, January 27, 2005ONR SSS Final Report 52
Section 5.0 SSS Costs: Direct Construction and OperationCosts Versus Avoided Costs <strong>of</strong> Alternative ModesThis section reviews the performance and operational parameters <strong>of</strong> the existing as well asevolving vessel systems, their construction and operating costs, the avoided external costs <strong>of</strong>highway trucking, and estimates <strong>of</strong> their potential impacts.5-1 Vessel Construction and Operating Cost for SSSCapital and operating costs for several prototype SSS vessels have been estimated by GlobalInsight. Table 10 shows the range <strong>of</strong> capital and operating cost for five prototypecontainerships and RoRo vessels <strong>of</strong> different size and operating capabilities. The capitalcosts range between $38 million to $90 million for speeds <strong>of</strong> about 25 knows. Dailyoperating costs range between $12,000 and $21,000.Table 10 – Estimated Construction and Operating Costs for Representative SSS VesselsContainershipsRoRo VesselsCost Components 500 TEU 200 TEU 350 Trailer 140 Trailer 200 TrailerFerryCapital Costs $80 $38 $90 $44 $50($Million)Speed (Knots) 25 25 25 25 20Crew size 12 10 12 10 8Vessel ExpensesCrew Costs/Day $7,500 $6,500 $7,500 $6,500 $5,000Maintenance $1,750 $875 $1,750 $875 $1,000Costs/DayConsumables $1,000 $600 $1,000 $600 $600Insurance & Other $1,250 $625 $1,250 $625 $700CostsSubtotal Costs/Day $11,500 $8,600 $11,500 $8,600 $7,300Depreciation* $8,767 $4,164 $9,863 $4,822 $5,479Total Expense/Day $20,267 $12,764 $21,363 $13,422 $12,779Source: Global Insight, based on Reeves and Associates estimates; p. 38* Assumes straight-line depreciation over vessel life <strong>of</strong> 25 year.Data in Table 10 are based on direct construction and operating costs involved in movingfreight within a corridor. There are economic models that have estimated the RequiredFreight Rate (RFR) for each mode, trucking, rail, and SSS. For SSS carriers to competesuccessfully against the other mode, they have to charge a rate at or above their RFR in orderto break even. In addition to RFR, available economic models estimate the direct costs borneby the private shippers or carriers as well as the external costs <strong>of</strong> conducting that freightmove, i.e., the costs not paid by the users. For purposes <strong>of</strong> economic analysis, the directoperating costs <strong>of</strong> SSS should be compared with the avoided costs <strong>of</strong> moving cargo on thehighway by alternative modes on truck or rail. The avoided costs include external costs <strong>of</strong>ONR SSS Final Report 53
congestion, emission, and safety costs, and also reduced or avoided costs <strong>of</strong> futureinfrastructure expansion. Section 5-2 reviews available estimates <strong>of</strong> the RFR for SSSservices. Section 5-3 reviews the avoided external costs <strong>of</strong> highway congestion, fuel use andemission – per- trip and per-mile – when SSS services are used for moving freight as analternative to trucking. Section 5-4 describes the impacts <strong>of</strong> SSS in terms <strong>of</strong> avoided futurecosts <strong>of</strong> infrastructure expansion.5-2 Estimating Required Freight Rate (RFR) for SSS<strong>Research</strong>ers at the U.S. Merchant Marine Academy have developed a cost model todetermine the required freight rate (RFR) that the SSS operator must charge to break even.Lombardo and colleagues developed the model based on the prevailing national freight ratesfor moving a standard overland RoRo by truck, and equivalent SSS vessel operating costs formoving a single RoRo ship carrying 80 trailers. Based on the findings <strong>of</strong> cost model, theRFR for moving a truckload was estimated at about $1.25 per statute miles. The cost modelalso estimated the RFR for SSS and assumed that for SSS to be sustainable the RFR must belower than this standard $1.25 rate per statute mile. 59The model calculated the RFR for SSS as a function <strong>of</strong> operating speed (allowed to varybetween 5 knots and 40 knots), route lengths (allowed to vary between 200 and 800 nauticalmiles) and minimum cargo volume (assumed at 80 trailers per load.) The model found thatmeeting the minimum volume requirement is <strong>of</strong>ten key to sustainable service and that marketshare and pr<strong>of</strong>itability usually go together. Lombardo and colleagues concluded that theRFR <strong>of</strong> $1.25 per statute mile would be economically viable for SSS operations assumingthat a single RoRo would have a minimum load to fill up 80 tractor trailers, with operatingspeed falling in the range <strong>of</strong> 15-20 knots. They found that RFR curves were extremely flatnear the minima, i.e., the diseconomies <strong>of</strong> marginally faster operating speeds are notparticularly punishing in terms <strong>of</strong> imposing additional costs (e.g., fuel cost associated withhigher speeds), concluding that: “The minimum RFR rises more slowly than route length,indicating that the cost advantage <strong>of</strong> SSS increases on longer routes.” This improvement ineconomy is only limited by the feasible limits <strong>of</strong> how much freight SSS service could carryhow far. However, due to the geography <strong>of</strong> the U.S. East, Gulf, and West coasts, the studyfound, SSS services cannot be implemented over routes much longer than 800 nautical miles.Table 11 shows the calculated total RFR rates for end-to-end SSS cargo delivery, RFR pernautical mile, and the optimal operating speed assuming an 80-trailer RoRo vessel.59 Lombardo, Gary A., Robert F. Mulligan, and Change Q. Guan, U.S. Short Sea Shipping: Prospects andOpportunities, U.S. Merchant Marine Academy, prepared for Short Sea Shipping Cooperative (SCOOP),November 1, 2004.ONR SSS Final Report 54
Table 11 – Optimal SSS Speed and RFR rates for different Route LengthsRoute Length(Nautical Mile)End-to-End RFRfor SSSRFR perNautical MileOptimalOperating Speed200 256 1.3 18250 286 1.14 18300 307 1.02 18350 327 0.94 19400 348 0.87 19450 368 0.82 19500 388 0.78 19550 409 0.74 19600 429 0.72 19650 450 0.69 20700 470 0.67 20750 490 0.65 20800 510 0.64 20Lombardo, Gary A., Robert F. Mulligan, and Change Q. Guan, U.S. Short Sea Shipping: Prospects andOpportunities, U.S. Merchant Marine Academy, prepared for Short Sea Shipping Cooperative (COOP),November 1, 2004.(Note: 1 nautical mile=1.15 statue mile; 1 statute mile = 0.868 nautical mile.)The Lombardo research team concluded:• RoRo vessels <strong>of</strong>fer the best prospects for serving truck competitive SSS markets as theyhave faster port turnaround times and have traditionally attracted higher-value freightpaying higher prices for service;• Overcoming low freight volumes that would allow carriers to achieve scale economiesand deep-seated expectation <strong>of</strong> unreliable service may be difficult and may detract fromopportunities to gain market share;• Vessel construction costs can be lowered once economies <strong>of</strong> scale are achieved;• RoRo cost savings can be significant if they avoid terminal handling costs (which mayincrease the RFR by as much as 20%);• The key shortcoming <strong>of</strong> the RoRo concept is that a hefty 30% <strong>of</strong> the weight and volumecapacity has to be devoted to carrying the tractor-trailer cabs; even containerize tractortrailers (on chassis) can never be packed as densely as on a containership.• RFR per nautical mile compares roughly with the cost per statute miles charged bytruckers. SSS should not see to undercut interstate trucking or railroads beyond theminimum amount necessary to assure full capacity on each SSS trip. SSS should thentake advantage <strong>of</strong> their significantly lower costs to operate at a higher pr<strong>of</strong>it margin.• For SSS operations to be successful, strategic alliances with truck and rail carriers areessential.ONR SSS Final Report 55
5-3 Estimating Avoided External Costs <strong>of</strong> Highway TruckingNot all the costs <strong>of</strong> moving a cargo container from the point <strong>of</strong> cargo-origination to thedestination port are internalized costs paid by private-sector shippers or commercial carriers.In the process <strong>of</strong> producing a transportation service, there are “negative externalities” that aregenerated, but are not paid for by the direct beneficiaries <strong>of</strong> the transaction, the shippers, andcarriers. A negative externality can be defined as the costs <strong>of</strong> producing and distributing ashipment (or alternatively, consuming a product or receiving a freight service) that are notborne by the product’s producers or consumers. Negative externalities <strong>of</strong> freight movementinclude network congestion and maintenance costs not paid for by the user through user feesor higher private costs; air and noise pollution costs; unpaid-for accident costs; infrastructurewear and tear from heavy truck use (not covered by diesel taxes); and inefficient fuelconsumption.A study by the Short-Sea Shipping Cooperative (SCOOP) conducted in 2004 estimated theprivate (internalized) and external costs <strong>of</strong> moving a 40-foot container for two origindestinationpoints: Boston to New York, and New York to Miami (Table 12). 60 For theNew York to Boston route, the study simulated the costs and performance for a modified FastCraft Ferry with a speed <strong>of</strong> 22 knots and capacity <strong>of</strong> 66 trailers. 61 The study findingsindicated that SSS movement <strong>of</strong> cargo generated significant savings in external costs <strong>of</strong>moving a freight container. More specifically, diverting a container unit destined to movefrom New York to Boston from highway mode to coastal ferry amounted to a saving $131 inexternal cost for a one-way truck trip or $0.56 per truck mile. Diverting a truck from movinga load from New York to Miami from highway to SSS would save $398 in external costs, asaving <strong>of</strong> $0.32 per highway mile.Table 12 – A Comparison <strong>of</strong> Private and Public/External Costs <strong>of</strong> Moving a 40-footFreight Container in Two CorridorsPrivate and External Costs <strong>of</strong>Moving a 40-Foot ContainerBoston toNew York CityNew York CityTo MiamiPrivate Costs/Trip $500 $1,460External Costs/Trip $131.2 $398.2External Costs as % <strong>of</strong> Private Costs 26.2% 27.3%External Costs per mile $0.58 $0.32Source: University <strong>of</strong> New Orleans, <strong>National</strong> Ports and Waterways Institute, “The Public Benefits <strong>of</strong>the Short-Sea Intermodal System,” Prepared for the Short Sea Cooperative Program (SCOOP),November 2004.The additional $131 or $398 in external costs, accrued on top $500 and $1,460 truck rates,paid by private beneficiaries for delivery <strong>of</strong> a 40-foot container (from Boston to New York orfrom New York to Miami) by truck, represents the unpaid-for costs <strong>of</strong> air and noise60 University <strong>of</strong> New Orleans, <strong>National</strong> Ports and Waterways Institute (NPWI), “The Public Benefits <strong>of</strong> theShort-Sea Intermodal System,” Prepared for the Short Sea Cooperative Program (SCOOP), November 2004.61 The vessel design and cost assumptions were based on the <strong>National</strong> Ports and Waterways Institute (NPWI)model estimates.ONR SSS Final Report 56
pollution, accidents, highway congestion and infrastructure maintenance. This means thatthe true cost <strong>of</strong> the container shipments are $631 and $1,858, and not $500 and $1,460, andthat between 26-27 percent <strong>of</strong> ($0.58 and $0.32 per mile) <strong>of</strong> the full costs are not paid for bythe shipper (Figure 26). Table 12 shows the components <strong>of</strong> the $0.58 per-mile external costs<strong>of</strong> moving a container from Boston to New York.Figure 26 – Components <strong>of</strong> the External Costs <strong>of</strong> Moving a Container from Boston to New YorkNoise5%External Costs <strong>of</strong> Moving a Containerby Truck from Boston to New York City(based on $0.56/Mile)Accidents7%Fuel Costs1%Infrastructure16%Air pollution11%Congestion60%Source: University <strong>of</strong> New Orleans, <strong>National</strong> Ports and Waterways Institute, “ThePublic Benefits <strong>of</strong> the Short-Sea Intermodal System,” Prepared for the Short SeaCooperative Program (SCOOP), November 2004.Below, the components <strong>of</strong> the external costs <strong>of</strong> shipping a container from Boston to NewYork City by truck, as calculated by the University <strong>of</strong> New Orleans SCOOP study andaugmented by other research findings, are described.Avoided Costs <strong>of</strong> Urban CongestionExternal costs <strong>of</strong> congestions not borne by the direct users (i.e., costs not paid for throughthe private time costs <strong>of</strong> delays), measured as a function <strong>of</strong> the time <strong>of</strong> day, truck route, andpeak-hour traffic at representative segment <strong>of</strong> the Interstate Highway 95, are estimated at$0.34 per mile applied to the 225-mile segment, amounting to a congestion cost <strong>of</strong> $77.08per trip. External costs <strong>of</strong> highway congestion further translate to future highway capacityconstraints, as described in Section 5-4.Avoided Costs <strong>of</strong> Highway Accidents and SpillsBased on the total network costs for all vehicles, the FHWA Highway Cost Allocation Study(HCAS) estimates the external costs <strong>of</strong> accidents that are not borne by the users <strong>of</strong> thehighway system at about 9 cents per vehicle miles travelled on urban highways. Forcombination trucks, the HCAS estimated the external costs <strong>of</strong> accidents at 6.9 cents per mile.The SCOOP study assumed the external accident costs to be lower, at 3.1 cents per mile forrural segments <strong>of</strong> the corridor and 0.9 cents for the urban segments, amounting to $14.94 inexternal accidents costs for the 225-mile Boston to New York trip.ONR SSS Final Report 57
Reduced risk <strong>of</strong> spills and incidents involving hazardous materials (hazmat) during watertransportation is another advantage <strong>of</strong> expanding SSS service. Spill statistics have indicatedthat SSS operations involve fewer spills and risks <strong>of</strong> incidents involving hazardous materials,even though SSS operations and inland tows and tug-barges are major carries <strong>of</strong> bulk oil andpetroleum products. These spills and incidents involve private costs as well as external,uncompensated safety and property losses. Among the private benefits (avoided costs)accrued to shippers for moving hazmat by water are lower insurance rates because <strong>of</strong> thesecurity benefits <strong>of</strong> moving hazardous materials by barge away from high density populationareas. 62A 2007 Texas <strong>Transportation</strong> Study (TTI) study, using the USCG reported spill incidents,reported the rates <strong>of</strong> spill, spill volume, and gallons spilled per million ton miles for truck,rail, and inland towing (Table 13.)Table 13 – Modal Comparison <strong>of</strong> Oil and Hazardous Materials Spill rates4-Year Averages (2001-2004)Mode # Spills Spill Volume(gallons)Gallons Spilledper million tonmilesTruck 161 674,622 6.1Rail 29 286,776 3.9Inland Towing 6 117,645 3.6Source: Texas <strong>Transportation</strong> Institute, A Modal Comparison <strong>of</strong> Domestic Freight <strong>Transportation</strong>Effects on the General Public, December 2007.Avoided Costs <strong>of</strong> Emissions and Air PollutionThe SCOOP study estimated the air pollution costs for urban areas at $0.0557 per mile,amounting to $12.53 for the 225-mile trip. The study did not identify the pollutantsmeasured in that estimate.Other estimates <strong>of</strong> the volume emissions are available based on emission models thatcalculate freight vehicle emissions based on the amount <strong>of</strong> fuel used to carry a standardvolume <strong>of</strong> freight by each mode. DOT data show that one gallon <strong>of</strong> diesel fuel used by atypical tug-barge on domestic freight movement carries one ton <strong>of</strong> freight 514 miles,compared to 202 miles carried by rail and 59 miles carried by truck. Table 14 compares thefuel usage and pounds <strong>of</strong> emission generated in tug-barge operations with comparabletrucking and rail operations.62 Based on the report <strong>of</strong> the PANY/NJ about the anticipated benefits <strong>of</strong> the Albany Barge Express program.ONR SSS Final Report 58
Table 14 – Fuel Usage and Emission Levels for Truck, Rail, and Tug-Barge ModesModeTon miles <strong>of</strong>Freight Carriedper Gallon <strong>of</strong>Diesel FuelHydrocarbons(HC)Pounds <strong>of</strong> Emission per Ton MileCarbonMonoxide (CO)Truck 59 0.0063 0.0190 0.1017Rail 202 0.0046 0.0064 0.0183Tug-Barge 514 0.0009 0.0020 0.0053Source: USDOT data reported in Alabama Freight Mobility Study, April 19, 2007Nitrogen Oxides(NOx)Emission estimates by other studies have been measured as grams <strong>of</strong> pollutant emissiongenerated by each <strong>of</strong> the three modes, are shown in Table 15.Table 15 – TTI Estimates <strong>of</strong> Emissions per Ton Mile <strong>of</strong> Cargo MovedGrams <strong>of</strong> Emission per Ton-MileMode HC CO NOx PMTruck 0.020 0.136 0.732 0.018Rail 0.024 0.064 0.654 0.016Tug-Barge 0.017 0.046 0.469 0.011Source: Texas <strong>Transportation</strong> Institute, A Modal Comparison <strong>of</strong> Domestic Freight <strong>Transportation</strong>Effects on the General Public, December 2007.Greenhouse gas emission, as measured by carbon dioxide (CO2) emission can also besubstantially lower in some port areas. The International Chamber <strong>of</strong> Shipping andInternational Shipping Federation have documented the relative emission-saving potentialfrom shipping cargo on four alternative transport modes: air, trucking, rail, and barge (Table16).Table 16 - CO2 Emissions for Alternative ModesModeCO2 Grams per Ton-KilometersAir freight 747-400 1,200 km flight 540Heavy Truck with Trailer 50Marine Cargo Vessel 2000-8000dwt 21Marine Cargo Vessel over 8000 dwt 15Source: Texas <strong>Transportation</strong> Institute, A Modal Comparison <strong>of</strong> Domestic Freight<strong>Transportation</strong> Effects on the General Public, December 2007.Current research indicates that natural gas, compared to diesel fuel, reduces emissions <strong>of</strong>NOx by about 80%, carbon dioxide by roughly 20%, carbon monoxide by approximately75%, benzene by over 95%, and VOC by over 30% 63 . For a time during 2008, some viewed63 Calculations based on interview <strong>of</strong> Alexandre Eykerma, Wärtsilä; and James J. Winebrake et al, “Energy Useand Emissions from Marine Vessels: A Total Fuel Life Cycle Approach,” Journal <strong>of</strong> the Air and WasteManagement Association, Vol. 57, January 2007, pp. 105-109.ONR SSS Final Report 59
natural gas as a viable fuel choice for marine propulsion because it was cheaper than marinediesel fuel, the price <strong>of</strong> which at some point spiked at over $4 per gallon. However, the priceadvantage has disappeared, at least for the time being; it should be noted that the natural gasmarket is also subject to volatility and that the relative cost advantage may shift back andforth between these two fuels over time.While some past investigations <strong>of</strong> natural gas propulsion have identified design, safety, andoperational barriers, there are nonetheless many ferries now fueled by natural gas, stored incompressed form. One example <strong>of</strong> a ferry operating on compressed natural gas (CNG) is theM.V. Virginia, built by Tidewater Regional Transient Ferry, powered by a CNG system witha Caterpillar 300-hp. spark ignited engine. 64The U.S. EPA now addresses emissions from marine engines as “non-road” or “<strong>of</strong>f-road”diesel engines through regulation <strong>of</strong> both fuel content and emission limits. In May 2004,EPA finalized new requirements for non-road diesel fuel that took effect in 2007, to decreasethe allowable levels <strong>of</strong> sulfur in fuel used in marine vessels by 99 percent. These fuelimprovements are likely to increase the expected environmental and public health benefitsdue to particulate matter reductions from new and existing engines. 65Avoided Noise CostsBased on the rates estimated by the FHWA cost model from the Highway PerformanceMonitoring System (HPMS) database, the noise costs per truck trip in urban and ruralsectors are estimated at the mid range (from a range <strong>of</strong> 4.5 cents to 0.48 cents per mile)amounting to $5.64 for the New York-Boston transit.Avoided External Costs <strong>of</strong> Infrastructure Repair Not Paid for by UserFeesThe user fees paid by heavy trucks do not fully cover the additional <strong>of</strong> pavement repair.Based on the FHWA Highway Cost Allocation Studies (HCAS), the infrastructure costs permile depend on the vehicle type/size and the class <strong>of</strong> highway segment travelled (urbanversus rural.) HCAS estimates indicate that repair and maintenance costs for urbansegments are 3 to 4 times higher than rural segments, because <strong>of</strong> the more elaborate nature<strong>of</strong> the urban highway structures and greater disruption and traffic delays generated. Theestimated unpaid-for infrastructure-repair costs per one-way truck trip from Boston to NewYork are 20.52 cents. The user fees paid by 5-Axle Combination trucks traveling on urbaninterstates for diesel fuel taxes, vehicle excise taxes, tire taxes, and the Heavy Vehicle UserTax (HVUT) for pavement repair add up to 7.4 cents per mile. The total Federal costs forrepair and maintenance <strong>of</strong> the urban highway segments amount to 21.1 cents per mile. Thedifference between what the heavy truck users <strong>of</strong> the urban infrastructure segments pay andthe federal costs represents a public burden <strong>of</strong> 13.8 cents per mile. The differential isequivalent to a public subsidy <strong>of</strong> 13.8 cents per mile to the trucking sector for the Boston-New York shipment.64 Brett and Wolff, LLC website, http://www.brettandwolffllc.com/ngmvessels.html.65 Ibid.ONR SSS Final Report 60
5-4 Estimating Reduced Costs <strong>of</strong> Meeting Future Highway CapacityNeedsBetter utilization <strong>of</strong> the vast capacity <strong>of</strong> the nation’s coastal and inland waterways fordomestic shipping is tantamount to significantly reducing the nation’s future needs forhighway capacity expansion. Several studies reviewed in this section have estimated thecosts <strong>of</strong> expanding the highway network, estimated to cost between $103 billion to $155billion per year in the several decades.Resources needed to pay for highway capacity expansion are becoming increasingly scarce,particularly with rising highway capacity constraints on several key arteries in coastal areas,most notably the I-5 (Pacific), I-95 (Atlantic), and I-10 (Gulf) corridors. Urban planners inlarge cities such as New York and Los Angeles question whether building new infrastructurewill solve these capacity constraints, reasoning that both rail and highway networks servingthe nation’s coastlines are at or beyond capacity and their expansion could be achieved onlyat exorbitant costs. 66In 2008, the Society <strong>of</strong> Civil Engineers estimated that improving the nation’s surfacetransportation infrastructure would require $155.5 billion annually. The IGMS reportconcluded that the total price tag to shore up this failing system would reach over a trilliondollars and that “we cannot pave our way out <strong>of</strong> this challenge.” 67A 2007 report by the <strong>National</strong> Cooperative Highway <strong>Research</strong> Program (NCHRP) hasreported that to meet the performance needs <strong>of</strong> the existing interstate highway system, anadditional 173,000 lane miles <strong>of</strong> capacity will need to be added to the existing 210,000 lanemiles <strong>of</strong> the Interstate System. Meeting these capacity-needs requires a total expenditure <strong>of</strong>$103 billion per year over the next 30 years, with a 30-year total <strong>of</strong> $3.1 trillion. Two majorcomponents on the NCHRP highway improvement study are the Freight Logistics NetworkImprovement Program and the Metropolitan Mobility Program. Meeting the FreightLogistics Network’s improvement needs would require building additional 68,600 miles <strong>of</strong>capacity, at annual costs <strong>of</strong> $27 billion, or $835 million over the next 30 years. Meeting theMetropolitan Mobility Program would require adding 73,000 lane miles <strong>of</strong> capacity, at theannual cost <strong>of</strong> $71 billion, with outlays <strong>of</strong> $2.2 trillion over the 30-year period. 68 Adequateresources have not been available to pay for these freight and metropolitan mobilityprograms, both closely related to the nation’s needs for expanding the critical freightinfrastructure. 69 A targeted SSS program geared to utilizing the existing marinetransportation capacity for domestic shipping would be an efficient solution to this resourceshortfall.66 Institute for Global Maritime Studies in cooperation with the Fletcher School <strong>of</strong> Law and Diplomacy, TuftsUniversity, “America’s Deep Blue Highway: How Coastal Shipping Could Reduce Traffic Congestion, LowerPollution, and Bolster <strong>National</strong> Security,” September 2008.67 Institute for Global Maritime Studies in cooperation with the Fletcher School <strong>of</strong> Law and Diplomacy, TuftsUniversity, “America’s Deep Blue Highway: How Coastal Shipping Could Reduce Traffic Congestion, LowerPollution, and Bolster <strong>National</strong> Security,” September 2008.68 <strong>National</strong> Cooperative Highway <strong>Research</strong> Program(NCHRP), Future Options for the <strong>National</strong> System <strong>of</strong>Interstate and Defense Highways, Task 10 Final Report, Prepared by PB Consultant, Inc. and CambridgeSystematics, Inc., May 2007.69 FHWA, Estimated Cost <strong>of</strong> Freight Involved in Highway Bottlenecks – Final Report, Nov. 12, 2008.ONR SSS Final Report 61
A 2006 University <strong>of</strong> Southern California study has suggested that the political will to payfor the cost <strong>of</strong> expanding surface transportation capacity may no longer exist, and that newcapacity would “certainly fail to noticeably alleviate congestion problems,” because theywould generate “new trips” rather than relieve congestion or expand capacity sufficient tomeet future trade growth. The authors asked: “Faced with an absence <strong>of</strong> sufficient politicalwill to develop additional carrying capacity on the region’s surface transportation system,along with the potential tripling <strong>of</strong> container volume that will be handled at the region’s portsby 2030, how can the region cope with the inevitable shortfall in surface transportationinfrastructure while seeking to sustain regional economic competitiveness?” 70SSS has the potential to significantly mitigate capacity shortage on the nation’s freight railnetwork and reduce the size <strong>of</strong> the expenditures on maintenance and construction <strong>of</strong> highwayand railroad infrastructure. This claim has been validated by calculations <strong>of</strong> the equivalentcarrying capacity for alternative freight modes. For instance, the 2007 TTI study hasreported the following equivalencies:Cargo Capacity <strong>of</strong> a single 15-barge tow is equivalent <strong>of</strong> 2 unit-trains and 1,050 53’semi-trailer trucks. 71This estimate is based on the following assumptions about the standard units <strong>of</strong> capacity forthree alternative modes: (Table 17)ModeTable 17 – Equivalency Units for SSS, Rail, and TruckStandard CargoCapacityUnits neededto Carry1,750 Tons<strong>of</strong> Dry CargoUnits neededto carry27,500barrles<strong>of</strong> LiquidCargoHighway, 53’ Semi Truck Trailer 25 tons 70 144Rail, Bulk Car 110 tons 16 46Barge, Dry Bulk 1,750 tons 1Barge, Liquid Bulk 27,500 barrels 1Source: Texas <strong>Transportation</strong> Institute, A Modal Comparison <strong>of</strong> Domestic Freight <strong>Transportation</strong>Effects on the General Public, December 2007Other studies have made similar assumptions about the equivalency <strong>of</strong> SSS shipments andcomparable rail and truck modes. Table 18, developed by Hanson Pr<strong>of</strong>essional Services,establishes equivalencies with respect to the comparable freight network capacity for threemodes, allowing an equivalency comparison for the carrying capacity <strong>of</strong> a single barge or atypical 15-barge tow with the average rail and highway truck capacity to move a standardload <strong>of</strong> freight. Note that the TTI and Hanson equivalencies are not identical because they70 Le-Griffin and Moore, USC Department <strong>of</strong> Civil and Environmental Engineering, “Potential Impact <strong>of</strong> ShortSea Shipping in the Southern California Region”, <strong>Research</strong> Project Report, METRANS Project 65-A0047,February, 2006.71 Source: Texas <strong>Transportation</strong> Institute, A Modal Comparison <strong>of</strong> Domestic Freight <strong>Transportation</strong> Effects onthe General Public, December 2007.ONR SSS Final Report 62
are based on different assumptions about the typical size <strong>of</strong> a barge, truck, or railconveyance.Table 18 – Equivalency Units for Carrying Capacity <strong>of</strong> Barge Tows and AlternativeHighway and Rail ModesSSS AlternativeEquivalent Units1 Barge 15 Jumbo Rail Hoppers58 Large Semi Trailer Truck1-15-Barge Tow2.25 Unit-train rail cars870 Large Semi Trailer TruckSource: Hanson Pr<strong>of</strong>essional Services, Inc. “Kentucky Freight <strong>Transportation</strong> Conference, 2007”,Frankfort, Kentucky, May 15, 2007.Other capacity equivalencies with respect to alternative highway, rail, and water modes formoving freight are documented in Table 19.Table 19 – Capacity Equivalency for Alternative Cargo Conveyance ModesVessel typeCargo Capacity1 Barge 1,500 tons52,500 bushels453,600 gallons1 15-Barge Tow 22,500 tons878,500 bushels6,804,000 gallons1 Jumbo Rail Hopper 100 tons3,500 bushels30,240 gallonsA 100-Car Train10,500 tons35,000 bushels3,024,000 gallonsA Large Semi Truck Trailer 26 tons910 bushels7,865 gallonsSource: Hanson Pr<strong>of</strong>essional Services, Inc. “Kentucky Freight <strong>Transportation</strong> Conference, 2007”,Frankfort, Kentucky, May 15, 2007.5-5 Estimating the Potential to Reduce Fossil Fuel ConsumptionSSS vessels are more fuel-efficient since a single marine propulsion system replaces multipletruck engines needed to move the same volume <strong>of</strong> cargo. As Table 19 above showed, basedon the DOT estimates, an average tug-barge combination carries 1 ton <strong>of</strong> freight 514 miles ona single gallon <strong>of</strong> diesel fuel, compared to 202 miles carried on a rail car and 59 miles carriedby truck (Figure 27)ONR SSS Final Report 63
Figure 27 – Modal Comparison <strong>of</strong> Ton Miles <strong>of</strong> Freight Carried per Gallon <strong>of</strong> FuelTon MilesTon Miles <strong>of</strong> Freight Carried perGallon <strong>of</strong> Diesel Fuel6005004003002001000Source: USDOT EstimatesTruck Rail Tug-BargeShare <strong>of</strong> fuel in a truck’s total operating cost is much higher than rail or barge. An estimated46 percent <strong>of</strong> a truck’s operating cost is fuel, compared to 35 percent for rail and 18 percentfor a container-on-barge operation. 72 Note that any estimate <strong>of</strong> fuel usage is highly sensitiveto assumptions about the tonnage carried in a typical load and the particular model used toestimate fuel use. For instance, the 2007 TTI study cited above used the EPA data from theMOBILE6 model to estimate trucking emission data. For rail emissions, TTI used theSurface <strong>Transportation</strong> Board (STB) and the Security and Exchange Commission (SEC) data,and for marine fuel efficiency the study used data obtained from the Tennessee ValleyAuthority fuel consumption model. Based on these input data, TTI estimated that an averageinland tug-barge carries 576 ton-miles per gallon <strong>of</strong> fuel, compared to 413 ton-miles carriedper gallon <strong>of</strong> fuel used by a railcar, and 155 ton miles per gallon <strong>of</strong> fuel used by a truck.These estimates showed far higher rates for ton-miles <strong>of</strong> freight for rail and truck than theDOT data, but comparable figures for tug-barge vessels. 735-6 Estimating the Benefits from Improved Driver and CrewProductivityWith respect to labor productivity, several metrics indicate significant advantages <strong>of</strong> a singlebarge over a truck carrying freight. A small crew (e.g., an average size barge crew <strong>of</strong> 10)operating a 15-barge tow can move 22,500 tons <strong>of</strong> freight; the same load when moved bytruck trailers (assuming an average truckload <strong>of</strong> 26 tons) would require the labor <strong>of</strong> 865single truck-trailer drivers.SSS <strong>of</strong>fers the potential to alleviate some <strong>of</strong> the current labor shortages problems in thetrucking industry as well as the capacity shortages for railroads. Because SSS operations72 <strong>Transportation</strong> Economics & Management Systems, Inc., (TEMS), Impact <strong>of</strong> High Oil Prices on Freight<strong>Transportation</strong>: Modal Shift Potential in Five Corridors, Technical Report, Prepared for MARAD, USDOT,October 2008.73 C. James Kruse et al, A Modal Comparison <strong>of</strong> Domestic Freight <strong>Transportation</strong> Effects on the GeneralPublic, Texas <strong>Transportation</strong> Institute, December 2007; http://tti.tamu.edu/documents/TTI-2007-5.pdfONR SSS Final Report 64
<strong>of</strong>ten need to be conducted in tandem with line-haul or local drayage trucks, the service notonly improves labor productivity and relieves driver shortage pressures in the truckingindustry; it can also facilitate the drivers’ compliance with the trucking Hours <strong>of</strong> Service(HOS) regulations. The prevailing HOS rules, coupled with newly enforced immigration andCommercial Driver Licensing (CDL) rules and the <strong>Transportation</strong> Worker Identification andCredential (TWIC) regulatory requirements have compounded the driver shortage and the socalled“quality <strong>of</strong> life” issues that have worked against driver retention for long-haul truckdrivers, and present compelling arguments in favor <strong>of</strong> promoting SSS as a key component <strong>of</strong>a national freight network. 7474 Mark Yonge has referred to the “Perfect Storm” in freight transportation for trucking industry that in additionto driver shortage, new HOS and TWIC rules includes new EPA rules for Ultra Low Sulfur Diesel (USLD) andan aging truck fleet.ONR SSS Final Report 65
Section 6.0 – SSS Challenges, Opportunities, and PolicyOptionsThis section concludes the assessment <strong>of</strong> SSS options for operation in the U.S. freightmarkets by evaluating the actual or perceived impediments to expanded market penetrationand proposing several policy options.Section 6-1 reviews the issues relating potential impediments to expanded SSS markets andoperations:6-1-1 Adverse impacts <strong>of</strong> the regulatory restrictions effecting efficient choice <strong>of</strong> selfpropelledvessels;6-1-2 Potential cost impacts <strong>of</strong> the Harbor Maintenance Tax (HMT), the Jones Act, andthe USCG vessel manning requirements;6-1-3 Absence <strong>of</strong> an efficient pricing mechanism to account for external costs <strong>of</strong> freightmovement;6-1-4 Challenges arising from the absence <strong>of</strong> a feeder port system; and6-1-5 Challenges arising from the failure to integrate the domestic waterborneinfrastructure with the nation’s freight network.Section 6-2 reviews the opportunities and policy options available for promoting SSS in theU.S. by recommending:6-2-1 Support for design and construction <strong>of</strong> small self-propelled feeder vessels;6-2-2 Support for exemption <strong>of</strong> SSS moves from the HMT;6-2-3 Promotion <strong>of</strong> pricing strategies compensating SSS carriers for the environmental andcongestion mitigation benefits;6-2-4 Promotion <strong>of</strong> feeder ports and inland distribution centers for transshipment <strong>of</strong> cargocontainers (with focus on lessons-learned from the European Union experience);6-2-5 Deployment <strong>of</strong> advanced technologies which improve efficiency <strong>of</strong> the domesticmarine shipping and integrate the mode into the national freight system.6-1 Potential Impediments to Expanded SSS OperationIn general, SSS markets have not grown to efficient market size to achieve scale economiesbecause <strong>of</strong> the regulatory, pricing, and network-related barriers outlined below.6-1-1 The Jones Act and the USCG Manning Requirements haveImpeded the Deployment Self-Propelled VesselsFederal regulations guiding the design, operation and manning <strong>of</strong> vessels for domestic usehave generated unintended consequences for domestic navigation safety and efficiency.Federal regulations guiding construction and crewing standards may have stifled theONR SSS Final Report 66
development <strong>of</strong> markets for construction <strong>of</strong> higher performance self-propelled ships, led tosub-optimal use <strong>of</strong> advanced ship technology, and encouraged excessive reliance on tugbargevessels.Current federal regulations give a preferential treatment to tug-barge combinations to thedetriment <strong>of</strong> self-propelled vessels. Differential manning is <strong>of</strong>ten a key factor in the choicebetween self-propelled and tug-barge combinations. The USCG applies crew sizedetermination rules on the basis <strong>of</strong> the size <strong>of</strong> the vessel’s propulsion unit. As a consequence<strong>of</strong> these manning requirements, an ATB requires a crew <strong>of</strong> 10 persons, while a tanker <strong>of</strong> thesame capacity would require a crew size <strong>of</strong> 20. This is because crew standards are based onthe size <strong>of</strong> the vessel’s propulsion engine and not its carrying capacity and other performancerequirements and risks. The tug is treated as a small vessel with lower crew requirements(the size <strong>of</strong> the barge is not relevant to crew size determination) whereas a tanker with acapacity similar to ATB combination is treated as a large ship. The labor cost advantagescan thus favor ATBs over self-propelled ships with similar construction costs despite ATBs’disadvantages in maneuverability and reliability.Some observers have maintained that the differential treatment afforded the tug-bargecombination vessels has led to inefficient choice <strong>of</strong> vessels for SSS because self-propelledships have higher fuel efficiency and better maneuverability than tug-barge vessels andATBs. This view has been expressed in a recent IHS Global Insight report on the regulatoryadvantages enjoyed by ATBs in manning, concluding that the outcome has been poor designchoices by shipbuilder. They maintain that current manning requirements have raised theoperating costs <strong>of</strong> more efficient self-propelled vessels. Because <strong>of</strong> the high costs <strong>of</strong> themore efficient self-propelled vessels, the IHS report concludes: “Current crewing laws arenot optimal from the standpoint <strong>of</strong> commerce. They distort ship choice and cause the marketto choose less efficient ships were it not for the crewing regulation.” 75 In general, theseindustry observers have maintained that federal programs in support <strong>of</strong> shipbuilding for thedomestic Jones Ac fleet may adversely affect domestic marine transport, because theprotection afforded through the cabotage regime might generate a backlash from thedifferential treatment <strong>of</strong> the domestic and foreign-trade sectors and adversely impact effortsto promote SSS for domestic cargo movement. 76Higher construction costs for the U.S. flag fleets are another potential impediment to thegrowth in SSS markets. Because <strong>of</strong> these higher vessel purchase costs, businesses may findit harder to start and sustain a SSS operation. Many SSS stakeholders have maintained thatthe Jones Act adversely affects SSS operations because it increases the startup costs sinceships built in the U.S. tend to be more expensive than those constructed abroad. TheMerchant Marine Act <strong>of</strong> 1920 (46 U.S.C. App. § 883), commonly known as the Jones Act,requires that vessels used to transport cargo and passenger to U.S. ports be owned by U.S.citizens, be built in US ship yards, and that at lease 75 percent <strong>of</strong> the crew be U.S. citizens.Industry advocacy groups such as the Coastwise Coalition have recommended removing thissignificant disincentive to coastal waterborne traffic. 7775 IHS Global Insight, IHS Global Insight, Inc., An Evaluation <strong>of</strong> Maritime Policy in Meeting the Commercialand Security Needs <strong>of</strong> the United States, Prepared for the USDOT, MARAD, January 7, 2009.76 IHS Global Insight, January 7, 2009.77 Coastwise Coalition, Paul Bea, pbea@phbpa.com and http://www.maritimeadvisors.comONR SSS Final Report 67
Other industry experts, however, have maintained that given the long operating life <strong>of</strong> a ship,these higher costs would add little to the cost <strong>of</strong> each trip. A July 2005 GAO report askedone SSS operator whether the Jones Act requirements for the vessels to be U.S.-built were apotential obstacle to expanding service, given that U.S. construction costs may be moreexpensive than foreign-built vessels. The operator responded that these requirements did notpose a burden, but that the USCG crewing requirements that mandate unnecessarily largecrews for SSS operations increase the costs significantly. 786-1-2 Harbor Maintenance Tax (HMT) Raises the Costs <strong>of</strong> Shipping aContainer by WaterHarbor Maintenance Tax (HMT), a general ad valorem tax on the cargo value (0.125percent) levied on the value <strong>of</strong> all waterborne cargo loaded or unloaded at a port, is imposedby §26 U.S.C. 4461 and 19 C.F.R. §24.24. The tax is paid by the shipper or the productimporter. Exports have been exempted by the Supreme Court ruling from paying the tax.Cargo entering at ports in Alaska, Hawaii, and Puerto Rico is also exempt from the fee. Fordomestic shipments, the fee is levied at only one port – either the port <strong>of</strong> departure or the port<strong>of</strong> entry, but not both – and it does not normally apply to movements along the inlandwaterways as long as the ship moving the goods is subject to the Inland Waterways Fuel Tax(19 C.F.R. §24.24 (C0 (5) and 25 U.S.C. § 4042. 79An import container that is <strong>of</strong>floaded at a port and again loaded on a marine vessel for theinland leg <strong>of</strong> the journey is charged the HMT twice. The HMT adversely impacts growth inSSS operations because the fee, imposed on each leg <strong>of</strong> the movement <strong>of</strong> an importcontainer, taxes the same load twice: once at the arrival port and again at the inlanddestination port when unloaded for domestic distribution or feedering. The HMTdiscourages SSS since equivalent truck transportation <strong>of</strong> a load does not involve similar fees.The fee is intended to pay for harbor dredging. Containers account for much <strong>of</strong> the revenuegenerated given the higher value <strong>of</strong> cargo shipped in containers, even though the tax appliesto both containerized and bulk cargo. The proceeds <strong>of</strong> the HMT go into the HarborMaintenance Trust Fund (HMTF), which is used to reimburse the cost <strong>of</strong> maintenancedredging <strong>of</strong> federal channels and to cover operations <strong>of</strong> the St. Lawrence SeawayDevelopment Corporation. Industry experts have maintained that HMT may not be the bestmethod <strong>of</strong> financing waterway improvements because currently HMTF is taking in muchmore revenue than is being appropriated, with a growing balance <strong>of</strong> about $3 billion. 80Devising a more efficient system for charging user fees and congestion pricing would be agood alternative to the existing HMT fee system.78 GAO, “Freight <strong>Transportation</strong>: Short Sea Shipping Option Shows Importance <strong>of</strong> Systematic Approach toPublic Investment Decisions,” July 2005, GAO-05-76879 GAO, July 2005.80 Other potentially more efficient methods <strong>of</strong> pricing container shipments to pay for container processingcosts are the charges imposed by West Coast container ports for congestion pricing by charging fees percontainer during peak hours, e.g., the PierPass fee system at the ports <strong>of</strong> Los Angeles/Long Beach.ONR SSS Final Report 68
6-1-3 Challenges Arising from the Failure to Account for External CostsMoving FreightAbsence <strong>of</strong> an efficient pricing mechanism for paying for freight movement adverselyimpacts the growth <strong>of</strong> SSS markets, as outlined in Sections 5-2, 5-3, and 5-4. The externalcosts <strong>of</strong> moving a container by truck about 200 miles on the interstate highway system fromBoston to New York, for instance, would generate $131 per trip in unpaid-for external costsin addition to the $500 paid for by the shipper. These external costs represent the additionalcosts <strong>of</strong> highway congestion, air and noise pollution, accidents, and infrastructuremaintenance costs not paid for through fees, tolls, gasoline taxes, excise taxes and heavytruck user fees.6-1-4 Challenges Arising from Lack <strong>of</strong> a Feeder Port SystemCurrently there is no viable feeder port system in the U.S. operating within a well-integrated,interconnected network. In the marine shipping industry, “feedering” is defined as thepractice <strong>of</strong> using smaller self-propelled ships for local or coastal transport to carry bulk cargoor containers to and from ports not scheduled to be called by the ocean vessels servinginternational trade, and to connect smaller ports to major ocean ports. 81 In its 2006 Report toCongress, MARAD pointed out that there is a scarcity <strong>of</strong> small feeder vessels and SSSservices in the U.S., and attributed the growing channel capacity constraints and the inability<strong>of</strong> the existing infrastructure to meet the vessel draft needs to this deficiency. The reportnoted that the average size <strong>of</strong> containerships calling at U.S. ports is 17 percent larger than thesize <strong>of</strong> vessels calling at ports elsewhere in the world. The size <strong>of</strong> an average feeder ship isless than 3,000 TEU, compared to the 6,000-plus TEU vessels routinely calling on coastalports. The report explained that one reason for the larger average size <strong>of</strong> the vessels callingat U.S. ports is the absence <strong>of</strong> a robust feeder port system in the U.S. In Europe and Asia, theReport to Congress point out, SSS services rely in smaller feeder vessel to handle most <strong>of</strong> theintra-European and intra-Asian trade. 826-1-5 Challenges Arising from the Failure to Integrate SSS in theNation’s Freight InfrastructureThe nation’s vast inland waterway system is not integrated with the nation’s intermodalfreight system. In a 2005 feasibility study prepared by the University <strong>of</strong> Virginia the studyteam explored alternative means for augmenting transportation capacity and the InlandWaterways Intermodal <strong>Transportation</strong> System to alleviate capacity shortfalls and highwaycongestion facing the US intermodal system. The report noted that the Inland RiverContainer Services are underutilized resources because they are not fully integrated with theintermodal system, thus depriving the nation <strong>of</strong> the potential benefits <strong>of</strong> a low-cost andefficient transportation mode. 83Lack <strong>of</strong> integration <strong>of</strong> the inland waterway system is further exacerbated because adequateaccess infrastructure for the cargo terminals serving inland waterway traffic is not available.This gap has created significant competitive barriers to the development <strong>of</strong> a viable SSS for81 P&O Nedlloyd 2005, quoted in Yonge, 200782 Maritime Administration, Annual Report to Congress, Fiscal Year 2006.83 “Inland Waterways Intermodal <strong>Transportation</strong> System Design and Feasibility Analysis” prepared by theUniversity <strong>of</strong> Virginia for MARAD in May 2005ONR SSS Final Report 69
moving containers as well as bulk and break bulk cargo. The existing infrastructure isequipped primarily for moving bulk commodities, which currently accounts for most <strong>of</strong> thecargo volume moving by barge on the inland waterways. Access infrastructure and containerlift equipment are not in place for handling more containerized cargo onto the inlandwaterway system. Building wharves, container marshalling areas, high capacity cranes andother container handling equipment, and providing access connectors to the inlandtransportation network will be essential if SSS service is to be expanded.6-2 Opportunities and Recommended Policy OptionsThe review <strong>of</strong> the research finings on the feasibility <strong>of</strong> SSS for domestic shipping points toseveral key policy options. In concluding the study’s findings, this report recommends thefollowing five strategic initiatives:a. An initiative to support the design and construction <strong>of</strong> small self-propelled vessels toserve as feeder ships would close the existing gap in the U.S.-flag fleet <strong>of</strong> mediumspeed vessels with low operating costs;b. Exempting import containers from double payment <strong>of</strong> the HMT would remove one<strong>of</strong> the disincentives for domestic water shipments;c. Environmental benefits <strong>of</strong> SSS provide a compelling argument in favor <strong>of</strong> a policy <strong>of</strong>full-cost pricing in the form <strong>of</strong> a tax rebate to low-emission vessels and SSSalternatives to highway trucks to reflect the differential external costs <strong>of</strong> movingfreight;d. A policy <strong>of</strong> promoting the development <strong>of</strong> an efficient system <strong>of</strong> feeder ports andtransshipment hubs would bolster the growth in SSS and augment its infrastructurecapacity and environmental benefits; Lessons learned from the success <strong>of</strong> theEuropean Union in SSS could be highly valuable;e. Promoting the deployment <strong>of</strong> advanced navigation and communications technologieswould greatly facilitate cost effective SSS operations.6-2-1 Supporting the Design and Construction <strong>of</strong> More Efficient Self-Propelled VesselsSeveral industry experts have pointed out that SSS must reduce excessive reliance on thebarge-tow and articulated tug-barge (ATB) vessels and expand the fleet <strong>of</strong> medium-speedsmall ships in order to effectively compete in the freight markets. The speed <strong>of</strong> such shipswould not need to be 25 or 30 knots per hour, as some high-speed ship designs wouldsuggest. A speed range <strong>of</strong> 18- to 20-knots would be adequate for competing, as the U.S.Merchant Marine Study has indicated. 84 A self-propelled ship with the speed <strong>of</strong> 15 knotswould be adequate for meeting the speed requirements for moving a domestic cargocontainer. As one industry expert has put it, a medium speed ship moving at 15 knots per84 Lombardo, Gary A., Robert F. Mulligan, and Change Q. Guan, U.S. Short Sea Shipping: Prospects andOpportunities, U.S. Merchant Marine Academy, prepared for Short Sea Shipping Cooperative (SCOOP),November 1, 2004.ONR SSS Final Report 70
hour could deliver the same container 500 miles away in about 1.5 days (less than 34 hours)considering that an average truck that is subject to the HOS rules drives 500 miles per day.The small size <strong>of</strong> the vessel would also enable it to match the crew size advantages <strong>of</strong> ABTs.85 As noted in Section 5, the design could incorporate some <strong>of</strong> the features <strong>of</strong> ATBs tobenefits from lower crewing requirements.Medium-speed speed small ships will also grow more competitive with trucking as oil pricesrise. As oil prices rise, operating costs go up as well. Rising speed tend to raise fuelconsumption and operating costs at an exponential rate. It has been estimated that in the past15 years the average speed <strong>of</strong> the world marine vessel fleet has grown from 20 knots to 29knots. This 45 percent increase in speed has been associated with the doubling <strong>of</strong> the fuelconsumption per unit <strong>of</strong> cargo (a 100 percent increase.) 86 It is reasonable to assume that asoil prices rise, shippers may find it easier to trade <strong>of</strong>f higher-speed freight modes for loweroperating costs.Other SSS studies have concluded that the current inventory <strong>of</strong> tug-barge vessels mayrepresent a class <strong>of</strong> service vessels too slow to compete effectively for capturing a significantshare <strong>of</strong> existing road and rail traffic. The have suggested that support for construction <strong>of</strong>higher speed ships, perhaps in the 20-knot range, would be effective in promoting SSS for abroader range <strong>of</strong> cargo and would close the existing gap in the small medium-speed vesselswith low operating costs. 876-2-2 Removing the Disincentives for Domestic Marine Shipping byExempting Import Containers from Double Payment <strong>of</strong> the HMTEfforts to seek a waiver <strong>of</strong> the HMT imposed on import containers shipped by water fordomestic distribution continue. This exemption would remove the adverse impact <strong>of</strong> HMTon domestic water shipments as it taxes the same load twice, whereas the equivalent trucktransportation <strong>of</strong> a load does not involve similar fees.Current efforts in support <strong>of</strong> the exemption include H.R. 3319 to amend the IRS code toexempt domestic intermodal cargo containers from the HMT. The American Association <strong>of</strong>Port Authorities (AAPA) has drafted several position papers and supported legislativeinitiatives in support <strong>of</strong> the waiver, maintaining that only a small fraction <strong>of</strong> the HMTcollection on domestic shipments comes from the intermodal cargo. After the SupremeCourt found in 1998 that imposing HMT on the U.S. exports was unconstitutional, theremaining cargo base subject to the HMT consisted <strong>of</strong> imports, domestic cargo, cargoprocessed and fabricated at Free Trade Zones (FTZ), and cruise ships using the coastal andinland waterways. The AAPA document advocating the removal <strong>of</strong> the HMT shows that85 Comments <strong>of</strong> Mr. John Bobb, USCG, Chief, Oceans & <strong>Transportation</strong> Branch, <strong>Office</strong> <strong>of</strong> WaterwaysManagement, Journal <strong>of</strong> Commerce Conference on Marine Highways, Jacksonville, Florida, April 1-2, 2009.Mr. Bobb suggested that the best way to meet this need would be to have a competitive grants process fordesign <strong>of</strong> a small ship.86 <strong>Transportation</strong> Economics Management Systems, Inc. (TEMS), Impact <strong>of</strong> High Oil Prices on Freight<strong>Transportation</strong>: Mode Ship Potential in Five Corridors – Technical Report, Prepared for MARAD, USDOT.October 2008.87 Institute for Global Maritime Studies, America’s Deep Blue Highway: How Coastal Shipping Could ReduceTraffic Congestion, Lower Pollution, and Bolster <strong>National</strong> Security, September 2008.ONR SSS Final Report 71
domestic cargo accounts for only 4.3 percent <strong>of</strong> the annual HMT revenues <strong>of</strong> over $650million. The exemption would have negligible effects on the HMT reviews. 88Other advocates <strong>of</strong> exempting domestic cargo containers from the HMT have maintained thatthe waiver would most likely be revenue-neutral for the region, as any foregone tax revenuewould be <strong>of</strong>fset by funds saved in highway construction and repair as trailers are removedfrom the highway. 896-2-3 Promoting Pricing Policies that Compensate for Lower ExternalCosts <strong>of</strong> Marine Vessels and Bolster Environmentally Efficient SSSOperationsTo bolster the environmentally friendly features <strong>of</strong> SSS, pricing policies should be pursued totake advantage <strong>of</strong> fuel efficient marine propulsion systems with lower emissions. This can bedone in several ways to close the cost differential for moving cargo by water.One approach to closing the cost differential between the highway and SSS operations wouldbe through a rebate or subsidy program. Marine operators may be compensated with a rebateequivalent to the lower external costs <strong>of</strong> moving cargo by water. This approach has beenrecommended by a number <strong>of</strong> carriers and state and local agencies. For instance, at a recentMarine Highways Conference the CEO <strong>of</strong> the Columbia Coastal reported that, in most lanes,moving a container by water is more expensive. He suggested that appropriate incentivesand disincentives can be applied at various levels <strong>of</strong> federal and state governments to addressthe cost differentials. He pointed out that the challenge for state and MPO planning is thatmost ports are multi-state entities and incentives such as tax credits require a federal role. Hesuggested that port authorities should run the subsidy program and establish the differentialon the basis <strong>of</strong> the full costs <strong>of</strong> transporting a container by road versus water. The differenceshould translate to a federal tax credit that bridges the cost gap. 90The cost differential between road and water for moving a container would be reduced whenlarge volume-thresholds for water shipments are reached and diesel prices are above $3 or $4per gallon. The need for a subsidy would thus be reduced when such conditions prevail. TheVirginia Port Authority manager <strong>of</strong> the James River Norfolk-Richmond Feeder BargeService, for instance, found that moving a container on the Norfolk to Richmond lane ischeaper by truck when oil prices are low. The program at first proved viable when dieselprices were at $4 per gallon, but after oil prices began to drop the barge service was nolonger viable. However, reaching adequate volume commitments that would allow SSScarriers to achieve economies <strong>of</strong> scale, he suggested, would enable the East Coast marineoperators to run a potentially pr<strong>of</strong>itable and sustainable feeder service to smaller portsbetween New York, Savannah, and Jacksonville. 9188 The American Association <strong>of</strong> Port Authorities, The Harbor Maintenance Tax and Congestion Relief(v.9.1.05) http://aapa.cms-plus.com/files/PDFs/HMT_Coastwise_Paper_01Sept05.pdf89 Reeves & Associates, “Analysis <strong>of</strong> the Potential Market for Short-Sea Shipping Services over the Ports <strong>of</strong>Fall River and New Bedford,” March 29, 2006.90 Statement <strong>of</strong> Kevin Mack, Columbia Coastal, at a presentation at the Journal <strong>of</strong> Commerce Conference onMarine Highways, Jacksonville, Fl., April 1-2, 2009.91 Statement <strong>of</strong> Russell Held, Virginia Port Authority, at the Journal <strong>of</strong> Commerce Conference on MarineHighways, Jacksonville, Fl., April 1-2, 2009.ONR SSS Final Report 72
Conventional subsidy programs that close the gap in operating costs for SSS have provenineffective, as suggested by the lessons-learned from the Port Authority New York/NewJersey (PANY/NJ) initiative in support <strong>of</strong> the Albany Express Barge Service. The failure <strong>of</strong>the initiative showed the difficulties involved in using subsidies in support <strong>of</strong> cargooperations that reduce emissions and highway congestion. For several years in the early2000, the EPA Congestion Mitigation and Air Quality (CMAQ) grants were used tosubsidize SSS operators for moving cargo inland on the Hudson River. The subsidy was paidto enable the barge operators to charge a lower per-container fee to shippers (10 percentlower than the equivalent truck costs) to compensate for the longer transit time. The AlbanyExpress Barge was designed to operate as part <strong>of</strong> a strategy to promote diversion <strong>of</strong>containers from the highways to a Port Inland Distribution Network (PIDN) for processingthe container transload operations and then shipping them on the coastal and inlandwaterways. The initiative, however, was not sustainable after the CMAQ funds ran out.More successful implementation <strong>of</strong> CMAQ funds have been for promoting SSS in Portland,Oregon, for the Columbia Slough Intermodal Expansion Bridge project – that connected theriver to the deepwater port facility and eliminated many truck trips – and for the Port <strong>of</strong> NewYork Red Hook Container Barge project for the purchase and operation <strong>of</strong> a barge servicethat removed about 54,000 truck trips from the region’s highways each year.Actively promoting environmentally “green” features <strong>of</strong> low emission-marine fuel andengines is another approach to closing the pricing differential between marine and highwaymodes. Environmental advocates for the promotion <strong>of</strong> SSS have suggested that “coastalshipping must go green.” Among viable options for promotion <strong>of</strong> green transportationalternatives are the emerging markets for more efficient energy consumption – e.g.,promotion <strong>of</strong> alternative fuels, advanced engine design that burn natural gas or ultra lowsulfur diesel, or mechanisms for turning waste heat into additional energy or filtering exhaustfumes. 926-2-4 Supporting a Feeder Port System and Transshipment Hubs:Lessons Learned from Successful European OperationsThe existing U.S. marine infrastructure is amenable to development <strong>of</strong> an integrated system<strong>of</strong> marine transportation infrastructure in support <strong>of</strong> the global supply chains. Development<strong>of</strong> an efficient network <strong>of</strong> small self propelled feeder vessels and fast freight ferries, togetherwith the existing fleet <strong>of</strong> tug-barge vessels, could promote a highly efficient marinetransportation system. Such as feeder network, not widely developed in the U.S. today,would facilitate the alignment <strong>of</strong> the nation’s “mega ports” with an emerging system <strong>of</strong>satellite feeder ports and transshipment hubs on the East and West Coasts. Such a network <strong>of</strong>satellite ports, developed to meet the transshipment and container distribution needs <strong>of</strong> theglobal importers, would significantly alleviate the current highway congestion and marineport capacity pressures in the nation.Smaller vessels used for transshipment and feedering <strong>of</strong> cargo delivered at Tier 1 coastalmega ports would efficiently utilize the smaller Tier 2 ports to mitigate port capacity andhighway congestion problems. Ports such as Philadelphia, PA, Wilmington, NC, andJacksonville, Florida, for example, are suitable feeder ports because they would be able to92 Institute for Global Maritime Studies (IGMS), September 2008.ONR SSS Final Report 73
elive congestion at a Tier 1 port such as ports <strong>of</strong> New York/New Jersey while continuing t<strong>of</strong>ill available capacity at their own facilities. Expanding a feeder port system would not onlyreduce the adverse impacts <strong>of</strong> congestion at Tier 1 international ports, it would also addcapacity and promote economic development in small port areas, as the CEO <strong>of</strong> HorizonLines, a shipping company that has had difficulties in sustaining its container feederoperations on self-propelled vessels has suggested. 93Efficiency <strong>of</strong> practices involving the development <strong>of</strong> inland distribution centers for“transshipment” <strong>of</strong> international cargo imports, <strong>of</strong>ten used interchangeably with “feedering,”closely hinges on the availability <strong>of</strong> small feedering vessels and SSS services. The PortInland Distribution Network (PIDN) developed in the New York/New Jersey area, anddistribution center developed in the Southern California Empire Valley, for instance, areexamples <strong>of</strong> the practice <strong>of</strong> transshipping goods from one shipping line/vessel to another, orfrom one type <strong>of</strong> container to another. Container transshipment today <strong>of</strong>ten involvesshipping the container on truck to a distribution center for reloading, sorting, and valueaddedoperations. The practice has become a growing component <strong>of</strong> the strategy pursued bymany vessel operators that take advantage <strong>of</strong> available ground intermodal connections toreduce the number <strong>of</strong> port calls and transship cargo to and from such a PIDN by relying on athrough-bill-<strong>of</strong>-lading (BOL).The domestic feeder connectors would provide an efficient hub & spoke network for movinginternational containers on their domestic leg. In the recent years, growth in marine-relatedhub & spoke networks has been fueled by increased vessel size that have compelled carriersto reduce the number <strong>of</strong> ports directly called. For new coastal SSS services to be viable theyneed to be fully integrated with the existing and emerging port networks. Furthermore, sincethe nation’s intercity trucks and rail carriers also use the same hub & spoke models forcarrying international containers, SSS services need to be closely connected to them. Suchan integrated network <strong>of</strong> well connected hub & spokes to strategically located PIDN anddistribution centers utilizing the coastal routes and the inland waterways would fosterdevelopment <strong>of</strong> an efficient feedering network to reduce trucking emissions and urbanhighway congestion and improve fuel use and air quality.Promoting a system <strong>of</strong> regional feeder ports would require coordinated operations within theregion. This means that the ports would function as a system rather than as competing,disjointed entities. Such a system would allow regional infrastructure investments to beprioritized to select candidate SSS projects with maximum network benefits.Comparing and contrasting the U.S. SSS and COB operations with those prevailing in theEuropean Union (EU) would <strong>of</strong>fer some valuable lessons. These lessons are particularly <strong>of</strong>value because the privately held nature <strong>of</strong> the tug & barge industry in the U.S. has preventedthe development <strong>of</strong> reliable measures <strong>of</strong> the economic viability <strong>of</strong> SSS. EU’s Marco PoloFreight Transport Program is a publicly funded initiative undertaken “to shift or avoid” asubstantial part <strong>of</strong> the expected increase in international freight traffic from roads to SSS,rail, and inland waterway transport. The program, first launched in 2003, is currently93 Chuck Raymond, President and CEO <strong>of</strong> Horizon Lines, Inc. quoted in David J. Farrell, Jr. “America’s MarineHighway a/k/a Short Sea Shipping: A Win-Win Proposition”, 5 Benedict’s Maritime Bulletin, Third/FourthQuarter, pp. 221-226, 2007.ONR SSS Final Report 74
embarking on its second funding initiative. It provides a subsidy <strong>of</strong> €2 per 500 tonkilometersshifted <strong>of</strong>f the road, subject to conditions <strong>of</strong> viability and sustainability afterreceiving the five-year grants. Five types <strong>of</strong> action qualify applicants to receive the MarcoPolo grant funds:• Modal shift actions which provide aid to “start-up services” that are “robust but notnecessarily innovative” aiming “simply to shift freight <strong>of</strong>f the road;”• Catalyst actions which aim to “overcome structural barriers in the market” on thecondition that the projects are “highly innovative, aiming to achieve a real breakthrough;”• Common learning actions, which aim to “improve cooperation and sharing <strong>of</strong> knowhow”,with the goal <strong>of</strong> mutual training to help “cope with an increasing complextransport and logistics market;”• Motorways <strong>of</strong> the sea actions which shift freight from road to short-sea-shipping or acombination <strong>of</strong> SSS with other modes;• Traffic avoidance actions aiming to integrate transport into production logistics to avoid alarge percentage <strong>of</strong> road freight transport.The EU successful experience with SSS suggests several valuable lessons-learned about theindustry success factors in the EU:• EU ports have access to small feeder vessels for distribution <strong>of</strong> incoming cargoand are “mode neutral” with respect to the choice <strong>of</strong> modes for distributing cargo;• Unlike the U.S., the EU SSS operations are <strong>of</strong>ten “not exclusively freight” but arebased on RoRo-Passenger vessels handling a combination <strong>of</strong> freight cars andpassengers with access to captive port lift equipment for accommodating cargo;• EU has proactive policies in place in support <strong>of</strong> fuel efficiency and low emissionbenefits <strong>of</strong> water transport, including full-cost pricing strategies and subsidyprograms;• EU SSS ports have 24-hour terminal operations and access to efficientnavigational charts and cargo handling equipment;• EU’s high-density population centers served by large ocean ports tend to serveshort voyages on the waterways, providing a market edge for SSS providers (anadvantage that is augmented by Europe’s relatively weak infrastructure system forhighway and rail transportation and contributed to the growth <strong>of</strong> a sustainable SSSindustry.)ONR SSS Final Report 75
6-2-5 Deployment <strong>of</strong> Advanced Technologies could Facilitate Cost-Effective Marine Shipping and Integrate SSS in the <strong>National</strong> FreightNetworkSeveral advanced technologies are available today to SSS operators to allow them to navigatethe waterways more efficiently and deliver their cargo faster and more reliably. One suchsystem is a prototype automatic identification system (AIS) and vessel traffic informationsystem developed for the Columbia River pilots for improving navigation and visibility. TheTransView navigation display s<strong>of</strong>tware system was developed by the Volpe Center toprovide river pilots with the capability to display the most recent channel soundings or depthinformation. TransView enables the harbor pilots to visualize and navigate the mountainousterrain <strong>of</strong> the Columbia River that had made it difficult in the past for barges and rivervessels to navigate deep-draft channels. Because <strong>of</strong> the obstructions in the mountainousterrain, radar technologies were rendered ineffective in situations where two large ships meetaround the river bend.The SmartLock System is another example <strong>of</strong> an advanced technology system for facilitatinginland waterway navigation. SmartLock was developed and tested for the Port <strong>of</strong> Pittsburghcommission, in collaboration with Carnegie Mellon University, as a prototype system basedon the same principles used for air traffic control systems. This navigation, networking, andcommunication system establishes links between the tow and the lock and gives the pilot <strong>of</strong>the tow greater knowledge as to his position relative to the lock. The system speeds thelocking process and enables the lock operation to continue during periods <strong>of</strong> low-visibilityand adverse conditions.Another example <strong>of</strong> innovative technologies for improving inland river navigation is theRiver Level Reporting and Forecasting System, also known as MaxLoad. MaxLoad is awater-level forecasting tool that helps pilots and ship captains set departure times and vesselspeeds to take advantage <strong>of</strong> tides and water flows to allow the vessels to be loaded to themaximum depth. Potential application <strong>of</strong> LoadMax would be to reduce the need for channeldeepening in addition to enabling vessel operators to maximize their loads and avoid theunpredictability <strong>of</strong> the inland river vessel transit. 94The iModal system is another tool that could potentially enhance the operating efficiency <strong>of</strong>SSS by addressing the problems with the lock system on the inland waterways. TheUniversity <strong>of</strong> Virginia developed the iModal tool as a decision-support tool for supply chainmanagement and pricing. The tool is designed to create a centralized, web accessibles<strong>of</strong>tware system which seamlessly integrates all aspects <strong>of</strong> container-on-barge (COB)shipping with the existing intermodal system, and serves as a single point <strong>of</strong> collaborationbetween shippers, control towers, port authorities, terminal operators, and bridge tenders.iModal generates a Network Diagram for the five river ports in the system: St. Louis,Cincinnati, Memphis, New Orleans, and Pittsburgh serving as the major nodes or ports.Locations <strong>of</strong> rail and truck terminals are identified as hubs in the network. The spokes in thisnetwork represent the optimal combination <strong>of</strong> modes (water, rail, truck) with the optimalpaths determined through algorithms based on maximum and minimum costs per ton mile94 Columbia River Channel Deepening Project, http://www.sei.org/columbia/background_project.html, andhttp://www.channeldeepending.com/docs/channelBOQA.pdfONR SSS Final Report 76
and max weight. The system produces approximate cost <strong>of</strong> shipping 40 tons <strong>of</strong> cargobetween the five cities in the network for each mode <strong>of</strong> transport showing, for instance, thatto ship 40 tons <strong>of</strong> cargo between St Louis and Cincinnati it costs $2,808 by truck, $463 byrail, and $276 by barge. 95Introduction <strong>of</strong> low-emission vessels in some SSS routes has further augmented the mode’semission advantages. The ‘Green Dolphin’ a hybrid tug being built for Foss Maritime at aRainier, Oregon shipyard is an environmentally friendly tug that will help lower someemissions and pollutants. The vessel has lower fuel and life cycle maintenance costs andallows incorporation <strong>of</strong> future energy storage improvements in battery technology andhydrogen fuel cells. In October 2007 Foss Maritime announced its vessels were switching toultra low sulfur diesel fuel (ULSD), a move aimed at producing a significant reduction inemissions <strong>of</strong> particulate matter and carbon monoxide. Port <strong>of</strong>ficials in Seattle and Portlandlauded Foss for taking an important step to reducing the carbon footprint in Elliott Bay, PugetSound and the Columbia and Snake rivers.Foss Maritime introduced the Green Dolphin as part <strong>of</strong> its participation in the EnvironmentalProtection Agency’s (EPA) SmartWay Initiative. For developing this low-emission tug, inJune 2008, Foss Maritime won EPA’s Clean Air Technology Award, the first time amaritime operating company has ever received the federal government’s prestigious honor.Unlike other tugs, the Green Dolphin hybrid tug will rely on batteries and an active powermanagement system to minimize engine use. When the engines are used, they will run atpower levels that maximize efficiency, reversing the trend <strong>of</strong> harbor tugs that spendapproximately 60 percent <strong>of</strong> their time at less efficient low power levels. Main engineemissions reductions from using the hybrid tug are expected to be in the order <strong>of</strong> 44 percentfor particle emissions and nitrous oxide. Fuel consumption is expected to decrease by 20 to30 percent with a commensurate reduction in sulfur dioxide and carbon emissions.95 University <strong>of</strong> Virginia, “Inland Waterways Intermodal <strong>Transportation</strong> System Design and FeasibilityAnalysis,” May 2005.ONR SSS Final Report 77
AcronymsATBBOLBTSCCDoTTCDLCOBCMAQCMTSCNGDODDWTEPAFAFFEUFHWAFTZGAOGLSLSHMTFHMTHOSHPMSHSTHSVHVUTITBIGMSIWRLASHArticulated Tug-BargeBill <strong>of</strong> LadingBureau <strong>of</strong> <strong>Transportation</strong> StatisticsCenter for Commercial Deployment <strong>of</strong> <strong>Transportation</strong> TechnologyCommercial Driver LicensingContainer on bargeCongestion Mitigation and Air QualityCommittee on Marine <strong>Transportation</strong> SystemCompressed Natural GasDepartment <strong>of</strong> DefenseDeadweightEnvironmental Protection AgencyFreight Analysis FrameworkFort-foot Equivalent UnitFederal Highway AdministrationFree Trade ZonesGovernment Accountability <strong>Office</strong>Great Lakes and St. Lawrence SeawayHarbor Maintenance Trust FundHarbor Maintenance TaxHours <strong>of</strong> ServiceHighway Performance Monitoring SystemHigh-Speed TrimaranHigh-Speed VesselHeavy Vehicle User TaxIntegrated Tug-BargeInstitute for Global Maritime StudiesInstitute for Waterway <strong>Research</strong>Lighter Aboard ShipONR SSS Final Report 78
LoLoMARADMTSNCHRPNPWIONROPAOSGOSVPANY/NJPIDNRDCRFRRoRoSCOOPSECSSSSTBTEUTTITWICULSDUSCUSCGVLCCLift-On Lift-OffMaritime AdministrationMarine <strong>Transportation</strong> System<strong>National</strong> Cooperative Highway <strong>Research</strong> Program<strong>National</strong> Ports and Waterways Institute<strong>Office</strong> <strong>of</strong> <strong>Naval</strong> <strong>Research</strong>Oil Pollution ActOverseas Shipbuilding GroupOffshore Service VesselPort Authority New York/New JerseyPort Inland Distribution NetworkRegional Distribution CenterRequired Freight RateRoll-On Roll-OffShort-sea Shipping CooperativeSecurity & Exchange CommissionShort-sea ShippingSurface <strong>Transportation</strong> BoardTwenty-foot Equivalent UnitTexas <strong>Transportation</strong> Institute<strong>Transportation</strong> Worker Identification and CredentialUltra Low Sulfur DieselUniversity <strong>of</strong> Southern CaliforniaUS Coast GuardVery Large Crude CarriersONR SSS Final Report 79
ReferencesBureau <strong>of</strong> <strong>Transportation</strong> Statistics, “Shipment Characteristics by Mode <strong>of</strong> Transport for the UnitedStates,” US Department <strong>of</strong> <strong>Transportation</strong>.http://www.bts.gov/publications/commodity_flow_survey/2002/united_states/html/table_01_b.html.Corbett, James J., James Winebrake, and Alex E. Farrell, “Emissions Analysis <strong>of</strong> Freight TransportComparing Land-Side and Water-Side Short Sea Routes: Development and Demonstration <strong>of</strong> aDecision Modeling Tool,” Not dated.Government Accountability <strong>Office</strong> (GAO), “Freight <strong>Transportation</strong>: Short Sea Shipping OptionShows Importance <strong>of</strong> Systematic Approach to Public Investment Decisions,” July 2005, GAO-05-768.Great Lakes Maritime <strong>Research</strong> Institute, “Tax Systems and Barriers to Great Lakes MaritimeCommerce,” Final Report, Randall Skalberg and James Skurla, A University <strong>of</strong> Wisconsin-Superiorand University <strong>of</strong> Minnesota Duluth Consortium, October 2006.GLSLS Study: Final Report, Prepared for Transport Canada, USACE, USDOT, St. Lawrence SeawayManagement Corporation, St. Lawrence Seaway Development Corporation, Environment Canada,U.S. Fish & Wildlife, Fall 2007.Hill, Robert P. “The Articulated Tug/Barge – AT/B: The History and State <strong>of</strong> the Art,” President,Ocean Tug & Barge Engineering Corp. Undated DocumentI-95 Corridor Coalition, “Short-Sea and Coastal Shipping Options Study,” Final Report, November2005.IHS Global Insight, Inc., An Evaluation <strong>of</strong> Maritime Policy in Meeting the Commercial and SecurityNeeds <strong>of</strong> the United States, Prepared for the USDOT, MARAD, January 7, 2009.Institute <strong>of</strong> Global Maritime Studies (IGMS), America’s Deep Blue Highway: How Coastal ShippingCould Reduce Traffic Congestion, Lower Pollution, and Bolster <strong>National</strong> Security, study conductedin cooperation with the Fletcher School <strong>of</strong> Law and Diplomacy, Tufts University, September 2008.Marc Levinson, “The Box: How the Shipping Container Made the World Smaller and the WorldEconomy Bigger,” Princeton University Press, 2006.Lombardo, Gary A., “Short Sea Shipping: Practices, Opportunities and Challenges,” May 2004.Lombardo, Gary A., Robert F. Mulligan, and Change Q. Guan, U.S. Short Sea Shipping: Prospectsand Opportunities, U.S. Merchant Marine Academy, prepared for Short Sea Shipping Cooperative(COOP), November 1, 2004.Malone, John, and Matthew P. Tedesco, “Short Sea Shipping (S3) Roadmap,” September 30, 2007.MARAD, Report to Congress on the Performance <strong>of</strong> Ports and the Intermodal System, June 2005.MARAD, “Major North American Marine Highway Operations,” America’s Marine HighwayInitiative; http://www.marad.dot.gov/MHI/ops/index.aspONR SSS Final Report 80
New Jersey Department <strong>of</strong> <strong>Transportation</strong>, Portway Extensions: Concept Development Study,Volume 1, Final Report, September 2003.<strong>National</strong> <strong>Research</strong> Council (NRC), “Paying Our Way: Estimating Marginal Social Costs <strong>of</strong> Freight<strong>Transportation</strong>” <strong>Transportation</strong> <strong>Research</strong> Board (TRB), Special Report 246: NAS Press, 1996.New York University, Rudin Center and Rutgers University, Bi-State Domestic Freight FerriesStudy, prepared by Allison de Cerreno, Martin Robins, Pippa Woods, Anne Strauss-Wieder, RyanYeung, September 2006.Reeves & Associates, “Analysis <strong>of</strong> the Potential Market for Short Sea Shipping Services over thePorts <strong>of</strong> Fall River and New Bedford,” prepared for the Massachusetts Department <strong>of</strong> Business andTechnology and Seaport Advisory Council, March 29, 2006.SeaBridge, “Shipper Concerns on Near Coastal Trade,” Steven Flott, Chairman, SeaBridge OverseasHoldings Ltd., Marine <strong>Transportation</strong> System SSS Conference, November 5, 2003.SCOOP (Short Sea Shipping Cooperative Program), “Short-Sea Vessel Service and HarborMaintenance Tax,” <strong>National</strong> Ports and Waterways Institute (NPWI), University <strong>of</strong> New Orleans,October 2005.University <strong>of</strong> New Orleans, <strong>National</strong> Ports and Waterways Institute, “The Public Benefits <strong>of</strong> theShort-Sea Intermodal System,” Prepared for the Short Sea Cooperative Program (SCOOP),November 2004.University <strong>of</strong> Virginia, “Inland Waterways Intermodal <strong>Transportation</strong> System Design and FeasibilityAnalysis,” May 2005.U.S. DOT, “<strong>National</strong> Strategy to Reduce Congestion on America’s <strong>Transportation</strong> Network,” May2006.USCG and NOAA, “Real Time Tide and Current Data Systems in United States Ports:Implementation Status, Safety and Efficiency Needs Expansion Plan,” A Report to Congress, July2000.Volpe Center, “Theater Support Vessel (TSV) Evaluation” report prepared for the U.S. Army Tankautomotive& Armaments Command, November 2007.Waterfront Coalition, <strong>National</strong> Marine Container <strong>Transportation</strong> System: A Call to Action, May 2005http://www.portmod.org/news/press/White%20Paper.htmONR SSS Final Report 81