Office of Naval Research - National Transportation Library
Office of Naval Research - National Transportation Library
Office of Naval Research - National Transportation Library

You also want an ePaper? Increase the reach of your titles
YUMPU automatically turns print PDFs into web optimized ePapers that Google loves.
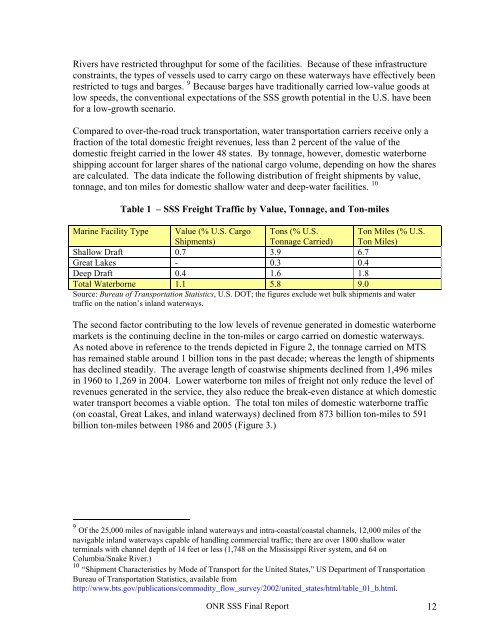
Rivers have restricted throughput for some <strong>of</strong> the facilities. Because <strong>of</strong> these infrastructureconstraints, the types <strong>of</strong> vessels used to carry cargo on these waterways have effectively beenrestricted to tugs and barges. 9 Because barges have traditionally carried low-value goods atlow speeds, the conventional expectations <strong>of</strong> the SSS growth potential in the U.S. have beenfor a low-growth scenario.Compared to over-the-road truck transportation, water transportation carriers receive only afraction <strong>of</strong> the total domestic freight revenues, less than 2 percent <strong>of</strong> the value <strong>of</strong> thedomestic freight carried in the lower 48 states. By tonnage, however, domestic waterborneshipping account for larger shares <strong>of</strong> the national cargo volume, depending on how the sharesare calculated. The data indicate the following distribution <strong>of</strong> freight shipments by value,tonnage, and ton miles for domestic shallow water and deep-water facilities. 10Table 1 – SSS Freight Traffic by Value, Tonnage, and Ton-milesMarine Facility Type Value (% U.S. CargoShipments)Tons (% U.S.Tonnage Carried)Ton Miles (% U.S.Ton Miles)Shallow Draft 0.7 3.9 6.7Great Lakes - 0.3 0.4Deep Draft 0.4 1.6 1.8Total Waterborne 1.1 5.8 9.0Source: Bureau <strong>of</strong> <strong>Transportation</strong> Statistics, U.S. DOT; the figures exclude wet bulk shipments and watertraffic on the nation’s inland waterways.The second factor contributing to the low levels <strong>of</strong> revenue generated in domestic waterbornemarkets is the continuing decline in the ton-miles or cargo carried on domestic waterways.As noted above in reference to the trends depicted in Figure 2, the tonnage carried on MTShas remained stable around 1 billion tons in the past decade; whereas the length <strong>of</strong> shipmentshas declined steadily. The average length <strong>of</strong> coastwise shipments declined from 1,496 milesin 1960 to 1,269 in 2004. Lower waterborne ton miles <strong>of</strong> freight not only reduce the level <strong>of</strong>revenues generated in the service, they also reduce the break-even distance at which domesticwater transport becomes a viable option. The total ton miles <strong>of</strong> domestic waterborne traffic(on coastal, Great Lakes, and inland waterways) declined from 873 billion ton-miles to 591billion ton-miles between 1986 and 2005 (Figure 3.)9 Of the 25,000 miles <strong>of</strong> navigable inland waterways and intra-coastal/coastal channels, 12,000 miles <strong>of</strong> thenavigable inland waterways capable <strong>of</strong> handling commercial traffic; there are over 1800 shallow waterterminals with channel depth <strong>of</strong> 14 feet or less (1,748 on the Mississippi River system, and 64 onColumbia/Snake River.)10 “Shipment Characteristics by Mode <strong>of</strong> Transport for the United States,” US Department <strong>of</strong> <strong>Transportation</strong>Bureau <strong>of</strong> <strong>Transportation</strong> Statistics, available fromhttp://www.bts.gov/publications/commodity_flow_survey/2002/united_states/html/table_01_b.html.ONR SSS Final Report 12