Office of Naval Research - National Transportation Library
Office of Naval Research - National Transportation Library
Office of Naval Research - National Transportation Library
You also want an ePaper? Increase the reach of your titles
YUMPU automatically turns print PDFs into web optimized ePapers that Google loves.
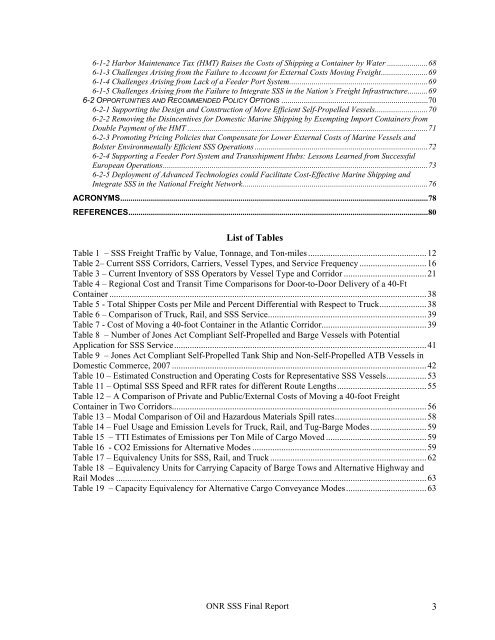
6-1-2 Harbor Maintenance Tax (HMT) Raises the Costs <strong>of</strong> Shipping a Container by Water ....................686-1-3 Challenges Arising from the Failure to Account for External Costs Moving Freight.......................696-1-4 Challenges Arising from Lack <strong>of</strong> a Feeder Port System....................................................................696-1-5 Challenges Arising from the Failure to Integrate SSS in the Nation’s Freight Infrastructure..........696-2 OPPORTUNITIES AND RECOMMENDED POLICY OPTIONS ........................................................................706-2-1 Supporting the Design and Construction <strong>of</strong> More Efficient Self-Propelled Vessels..........................706-2-2 Removing the Disincentives for Domestic Marine Shipping by Exempting Import Containers fromDouble Payment <strong>of</strong> the HMT ......................................................................................................................716-2-3 Promoting Pricing Policies that Compensate for Lower External Costs <strong>of</strong> Marine Vessels andBolster Environmentally Efficient SSS Operations .....................................................................................726-2-4 Supporting a Feeder Port System and Transshipment Hubs: Lessons Learned from SuccessfulEuropean Operations..................................................................................................................................736-2-5 Deployment <strong>of</strong> Advanced Technologies could Facilitate Cost-Effective Marine Shipping andIntegrate SSS in the <strong>National</strong> Freight Network...........................................................................................76ACRONYMS.......................................................................................................................................................78REFERENCES...................................................................................................................................................80List <strong>of</strong> TablesTable 1 – SSS Freight Traffic by Value, Tonnage, and Ton-miles .....................................................12Table 2– Current SSS Corridors, Carriers, Vessel Types, and Service Frequency ..............................16Table 3 – Current Inventory <strong>of</strong> SSS Operators by Vessel Type and Corridor .....................................21Table 4 – Regional Cost and Transit Time Comparisons for Door-to-Door Delivery <strong>of</strong> a 40-FtContainer ..............................................................................................................................................38Table 5 - Total Shipper Costs per Mile and Percent Differential with Respect to Truck.....................38Table 6 – Comparison <strong>of</strong> Truck, Rail, and SSS Service.......................................................................39Table 7 - Cost <strong>of</strong> Moving a 40-foot Container in the Atlantic Corridor...............................................39Table 8 – Number <strong>of</strong> Jones Act Compliant Self-Propelled and Barge Vessels with PotentialApplication for SSS Service.................................................................................................................41Table 9 – Jones Act Compliant Self-Propelled Tank Ship and Non-Self-Propelled ATB Vessels inDomestic Commerce, 2007 ..................................................................................................................42Table 10 – Estimated Construction and Operating Costs for Representative SSS Vessels..................53Table 11 – Optimal SSS Speed and RFR rates for different Route Lengths........................................55Table 12 – A Comparison <strong>of</strong> Private and Public/External Costs <strong>of</strong> Moving a 40-foot FreightContainer in Two Corridors..................................................................................................................56Table 13 – Modal Comparison <strong>of</strong> Oil and Hazardous Materials Spill rates.........................................58Table 14 – Fuel Usage and Emission Levels for Truck, Rail, and Tug-Barge Modes.........................59Table 15 – TTI Estimates <strong>of</strong> Emissions per Ton Mile <strong>of</strong> Cargo Moved .............................................59Table 16 - CO2 Emissions for Alternative Modes ..............................................................................59Table 17 – Equivalency Units for SSS, Rail, and Truck ......................................................................62Table 18 – Equivalency Units for Carrying Capacity <strong>of</strong> Barge Tows and Alternative Highway andRail Modes ...........................................................................................................................................63Table 19 – Capacity Equivalency for Alternative Cargo Conveyance Modes....................................63ONR SSS Final Report 3


