Rivers have restricted throughput for some <strong>of</strong> the facilities. Because <strong>of</strong> these infrastructureconstraints, the types <strong>of</strong> vessels used to carry cargo on these waterways have effectively beenrestricted to tugs and barges. 9 Because barges have traditionally carried low-value goods atlow speeds, the conventional expectations <strong>of</strong> the SSS growth potential in the U.S. have beenfor a low-growth scenario.Compared to over-the-road truck transportation, water transportation carriers receive only afraction <strong>of</strong> the total domestic freight revenues, less than 2 percent <strong>of</strong> the value <strong>of</strong> thedomestic freight carried in the lower 48 states. By tonnage, however, domestic waterborneshipping account for larger shares <strong>of</strong> the national cargo volume, depending on how the sharesare calculated. The data indicate the following distribution <strong>of</strong> freight shipments by value,tonnage, and ton miles for domestic shallow water and deep-water facilities. 10Table 1 – SSS Freight Traffic by Value, Tonnage, and Ton-milesMarine Facility Type Value (% U.S. CargoShipments)Tons (% U.S.Tonnage Carried)Ton Miles (% U.S.Ton Miles)Shallow Draft 0.7 3.9 6.7Great Lakes - 0.3 0.4Deep Draft 0.4 1.6 1.8Total Waterborne 1.1 5.8 9.0Source: Bureau <strong>of</strong> <strong>Transportation</strong> Statistics, U.S. DOT; the figures exclude wet bulk shipments and watertraffic on the nation’s inland waterways.The second factor contributing to the low levels <strong>of</strong> revenue generated in domestic waterbornemarkets is the continuing decline in the ton-miles or cargo carried on domestic waterways.As noted above in reference to the trends depicted in Figure 2, the tonnage carried on MTShas remained stable around 1 billion tons in the past decade; whereas the length <strong>of</strong> shipmentshas declined steadily. The average length <strong>of</strong> coastwise shipments declined from 1,496 milesin 1960 to 1,269 in 2004. Lower waterborne ton miles <strong>of</strong> freight not only reduce the level <strong>of</strong>revenues generated in the service, they also reduce the break-even distance at which domesticwater transport becomes a viable option. The total ton miles <strong>of</strong> domestic waterborne traffic(on coastal, Great Lakes, and inland waterways) declined from 873 billion ton-miles to 591billion ton-miles between 1986 and 2005 (Figure 3.)9 Of the 25,000 miles <strong>of</strong> navigable inland waterways and intra-coastal/coastal channels, 12,000 miles <strong>of</strong> thenavigable inland waterways capable <strong>of</strong> handling commercial traffic; there are over 1800 shallow waterterminals with channel depth <strong>of</strong> 14 feet or less (1,748 on the Mississippi River system, and 64 onColumbia/Snake River.)10 “Shipment Characteristics by Mode <strong>of</strong> Transport for the United States,” US Department <strong>of</strong> <strong>Transportation</strong>Bureau <strong>of</strong> <strong>Transportation</strong> Statistics, available fromhttp://www.bts.gov/publications/commodity_flow_survey/2002/united_states/html/table_01_b.html.ONR SSS Final Report 12
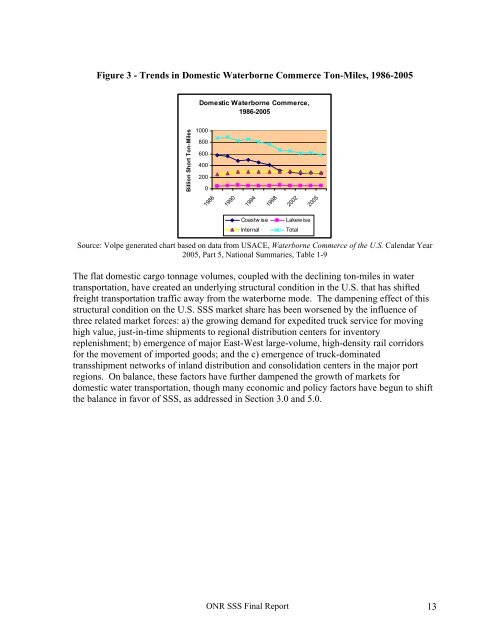
Figure 3 - Trends in Domestic Waterborne Commerce Ton-Miles, 1986-2005Domestic Waterborne Commerce,1986-2005Billion Short Ton-Miles10008006004002000198619901994199820022005Coastw iseInternalLakew iseTotalSource: Volpe generated chart based on data from USACE, Waterborne Commerce <strong>of</strong> the U.S. Calendar Year2005, Part 5, <strong>National</strong> Summaries, Table 1-9The flat domestic cargo tonnage volumes, coupled with the declining ton-miles in watertransportation, have created an underlying structural condition in the U.S. that has shiftedfreight transportation traffic away from the waterborne mode. The dampening effect <strong>of</strong> thisstructural condition on the U.S. SSS market share has been worsened by the influence <strong>of</strong>three related market forces: a) the growing demand for expedited truck service for movinghigh value, just-in-time shipments to regional distribution centers for inventoryreplenishment; b) emergence <strong>of</strong> major East-West large-volume, high-density rail corridorsfor the movement <strong>of</strong> imported goods; and the c) emergence <strong>of</strong> truck-dominatedtransshipment networks <strong>of</strong> inland distribution and consolidation centers in the major portregions. On balance, these factors have further dampened the growth <strong>of</strong> markets fordomestic water transportation, though many economic and policy factors have begun to shiftthe balance in favor <strong>of</strong> SSS, as addressed in Section 3.0 and 5.0.ONR SSS Final Report 13