A Rapid Assessment of Kili Island - Sea Grant College Program
A Rapid Assessment of Kili Island - Sea Grant College Program
A Rapid Assessment of Kili Island - Sea Grant College Program

Create successful ePaper yourself
Turn your PDF publications into a flip-book with our unique Google optimized e-Paper software.
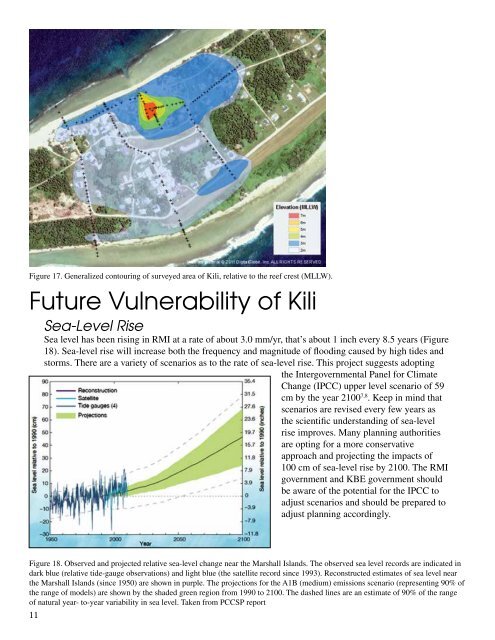
Figure 17. Generalized contouring <strong>of</strong> surveyed area <strong>of</strong> <strong>Kili</strong>, relative to the reef crest (MLLW).Future Vulnerability <strong>of</strong> <strong>Kili</strong><strong>Sea</strong>-Level Rise<strong>Sea</strong> level has been rising in RMI at a rate <strong>of</strong> about 3.0 mm/yr, that’s about 1 inch every 8.5 years (Figure18). <strong>Sea</strong>-level rise will increase both the frequency and magnitude <strong>of</strong> flooding caused by high tides andstorms. There are a variety <strong>of</strong> scenarios as to the rate <strong>of</strong> sea-level rise. This project suggests adoptingthe Intergovernmental Panel for ClimateChange (IPCC) upper level scenario <strong>of</strong> 59cm by the year 2100 7,8 . Keep in mind thatscenarios are revised every few years asthe scientific understanding <strong>of</strong> sea-levelrise improves. Many planning authoritiesare opting for a more conservativeapproach and projecting the impacts <strong>of</strong>100 cm <strong>of</strong> sea-level rise by 2100. The RMIgovernment and KBE government shouldbe aware <strong>of</strong> the potential for the IPCC toadjust scenarios and should be prepared toadjust planning accordingly.Figure 18. Observed and projected relative sea-level change near the Marshall <strong>Island</strong>s. The observed sea level records are indicated indark blue (relative tide-gauge observations) and light blue (the satellite record since 1993). Reconstructed estimates <strong>of</strong> sea level nearthe Marshall <strong>Island</strong>s (since 1950) are shown in purple. The projections for the A1B (medium) emissions scenario (representing 90% <strong>of</strong>the range <strong>of</strong> models) are shown by the shaded green region from 1990 to 2100. The dashed lines are an estimate <strong>of</strong> 90% <strong>of</strong> the range<strong>of</strong> natural year- to-year variability in sea level. Taken from PCCSP report11