Biodiversity, biocapacity and better choices
Biodiversity, biocapacity and better choices
Biodiversity, biocapacity and better choices

Create successful ePaper yourself
Turn your PDF publications into a flip-book with our unique Google optimized e-Paper software.
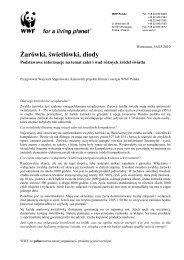
Ecological Footprint <strong>and</strong> sustainabledevelopmentIs a high level of consumption necessary for a high level ofdevelopment? Currently the most widely used indicator fordevelopment is the United Nations Development Programme’s(UNDP) Human Development Index (HDI) which – bycombining per capita income, life expectancy <strong>and</strong> educationalattainment – compares countries’ economic <strong>and</strong> socialdevelopment (UNDP, 2009. For the latest report see, UNDP,2011). The world’s average HDI has increased by 41 per centsince 1970, reflecting large improvements in life expectancy,school enrolment, literacy <strong>and</strong> income.Some low-income countries are able to increase theirHDI at a relatively fast rate, primarily because they have sucha small HDI in the first place <strong>and</strong> can rapidly capitalize onmany improvements that can be implemented. However, somelow-income nations are stagnated at their current HDI level(for example, Zimbabwe). The tendency is for the transitionaleconomies to have the largest improvements in their HDI.Figure 39 below shows the HDI of each country plotted againstits Ecological Footprint.Like all averages, the HDI conceals disparities in hum<strong>and</strong>evelopment in individual countries <strong>and</strong> does not take intoaccount other important variables, such as inequality.HDIWorld average <strong>biocapacity</strong> per person in 2008Low HumanDevelopmentMediumHumanDevelopmentHigh HumanDevelopmentVery HighHumanDevelopmentMeets minimum criteriafor sustainability00.0 0.20.4 0.6 0.8 1.0Human Development Index (HDI)12108642Ecological Footprint (global hectares per person)Figure 39: TheEcological Footprintfor each countryversus the HumanDevelopment Index,2008The dot representing eachcountry are colouredaccording to theirgeographic region <strong>and</strong>are scaled relative to itspopulation The shadingin the background ofthis figure <strong>and</strong> in figure40 indicates the HDIthresholds for low, medium,high <strong>and</strong> very high hum<strong>and</strong>evelopment <strong>and</strong> are basedon UNDP, 2010 (GlobalFootprint Network, 2011).KeyNorthern AmericaEUOther EuropeLatin AmericaMiddle East/Central AsiaAsia-PacificAfricaFigure 40: TheEcological Footprintfor each country(in 2008) versus theInequality-adjustedHuman DevelopmentIndex (in 2011)The Inequality-adjustedHDI (IHDI) accountsfor inequality in each ofthe three dimensions ofthe HDI – education, lifeexpectancy <strong>and</strong> income percapita – by “discounting”the average value of eachone according to its levelof inequality. Therefore,although the general shapeof this graph is the sameas in Figure 39, manycountries have moved tothe left. Countries with lesshuman development tendto have greater inequalityin more dimensions – <strong>and</strong>thus see larger losses intheir HDI value. Note: Thedevelopment thresholdsare the same in both thisfigure <strong>and</strong> Figure 39 tomake it easier to comparethe two of them. The IHDIvalues shown here are from2011 - for more informationsee UNDP, 2011 (GlobalFootprint Network, 2011).Development within one planet boundariesA new version of the HDI developed for the 2011 HumanDevelopment Report allows the HDI to take into account howachievements in health, education <strong>and</strong> income are distributed(UNDP, 2011). This new version of the index – called the InequalityadjustedHuman Development Index or IHDI – is a measure ofhuman development that accounts for societal inequality.Under perfect equality, the IHDI is equal to the HDI; but itprogressively falls below the HDI as inequality rises. In this sense,the IHDI is the actual level of human development, while the HDIcan be viewed as an index of the potential human developmentthat could be achieved if there is no inequality. The IHDI“discounts” each dimension’s average value according to its levelof inequality. Countries with less human development tend to havegreater inequality in more dimensions – <strong>and</strong> thus larger losses inhuman development.The average loss in the HDI due to inequality is about 23 percent – that is, adjusted for inequality, the global HDI of 0.682 in2011 would fall to 0.525.What does the relationship between the Ecological Footprint<strong>and</strong> this new index mean? Linking Ecological Footprint <strong>and</strong> IHDIreinforces the conclusion that the majority of countries withhigh IHDI have improved the well-being of their citizens at theexpense of a larger footprint. Lower IHDI nations, which strivetoward higher development levels, have smaller footprints, butthey have higher inequality, making their development goalsharder to meet. Concerted, collective efforts are needed to providethe environmental space for countries to pursue sustainabledevelopment objectives.IHDIWorld average <strong>biocapacity</strong> per person in 2008Low HumanDevelopmentMediumHumanDevelopmentHigh HumanDevelopment0.0 0.20.4 0.6 0.8Inequality-Adjusted Human Development Index (IHDI)Very HighHumanDevelopmentMeets minimum criteriafor sustainability1210864201.0Ecological Footprint (global hectares per person)WWF Living Planet Report 2012 page 60 Chapter 1: The state of the planet page 61