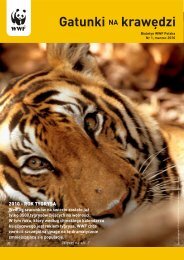
Million haThe Living Forests ModelThe Living Forests Model, developed by WWF with theInternational Institute for Applied Systems Analysis (IIASA) isbeing used to project forest loss <strong>and</strong> other l<strong>and</strong> use changes underdifferent scenarios (WWF, 2011a; b; c).Starting from the reference (a) Do Nothing Scenario, themodel projects changes if measures were introduced to rein-indeforestation <strong>and</strong> forest degradation <strong>and</strong> to increase biodiversityconservation. A number of scenarios have been developed forreductions in forest loss <strong>and</strong> degradation: (b) Target Scenario– Zero Net Deforestation <strong>and</strong> Forest Degradation (ZNDD – seedefinition in glossary) by 2020 <strong>and</strong> maintained at that levelindefinitely; (c) Target Delayed Scenario – ZNDD by 2030 <strong>and</strong>maintained at that level indefinitely; <strong>and</strong> (d) Half Measures Scenario– gross deforestation rate declines by at least 50 per cent from thereference rate by 2020 <strong>and</strong> is maintained at that level indefinitely.The Target Scenario was used to explore the costs <strong>and</strong> benefitsof fast action to cut deforestation <strong>and</strong> degradation compared to theDo Nothing Scenario (Figure 56). Compared to the Target Scenario,doing nothing, delaying or taking half measures all result in moreforest loss <strong>and</strong> associated GHG emissions, irreversible impacts onbiodiversity, <strong>and</strong> declines in ecosystem services (for further analysis,see WWF, 2011a; b; c <strong>and</strong> for further information on the model seeStrassburg et al., 2012).25020015010050020102020 20302040 2050YearDO NOTHINGHALF MEASURESTARGET DELAYEDTARGETFigure 56: Comparisonof gross deforestationunder the Do NothingScenario, TargetScenario, TargetDelayed Scenario <strong>and</strong>Half Measures ScenarioThe figure showscumulative deforestationbetween 2010 <strong>and</strong> 2050.Under the Do NothingScenario, the areadeforested is greater thanthe current total forest areaof the Democratic Republicof Congo, Peru <strong>and</strong> PapuaNew Guinea combined(WWF, 2011a).55.5MILLION HA232MILLION HA124.7MILLION HAForest Loss139MILLION HAFigure 57: Forest coverin 2000 <strong>and</strong> projectedforest cover in 2050The Living Forests Modelwas used to model changesin forest cover withintiger range states between2000 <strong>and</strong> 2050. Theavailable habitat for tigerswill shrink, according toprojections based on pasttrends. This projection doesnot take in account national<strong>and</strong> local policies to protectforest resources (for moredetails about the modelunderlying these maps, seeStrassburg et al., 2012).Forest Cover %1 - 1010 - 2020 - 4040 - 6060 - 8080 - 100Scenarios of biodiversity change: Modellingfuture habitat availability for tigersAsia’s most iconic species, the tiger, <strong>and</strong> its forests are not strangersto change. Over the last century, tigers have decreased in the wild from100,000 individuals to an estimated 3,200 to 3,500 (Global TigerInitiative, 2011), while Asia’s forests have decreased by more than70 per cent in half of the countries in this region (Laurance, 2007).What’s in store for Asia’s forests <strong>and</strong> tigers?Projections of forest change using the Living Forests ModelDo Nothing Scenario suggest that 332,207 km 2 (roughly 42 per cent)of habitat within WWF Tiger L<strong>and</strong>scapes will experience a declinein forest cover, with 50,708 km 2 of habitat declining to a 0-10 percent forest cover (Figure 57). Asia has the opportunity to addressdeforestation by taking actions to conserve the forests in which tigerslive. This includes smart, planned development; accounting for thebenefits provided by these forests in decision-making; <strong>and</strong> investmentin forests <strong>and</strong> tigers by nations following through on their existingcommitments to tiger conservation. At the rate forests <strong>and</strong> tigers arecurrently being lost, immediate action is crucial.Forest Coverin 2000Projected ForestCover for 2050WWF Living Planet Report 2012 page 102 Chapter 3: What does the future hold? page 103
Chapter 4:Better <strong>choices</strong>for a living planet~A satellite image of a phytoplankton bloom stretching across theBarents Sea off the coast of mainl<strong>and</strong> Europe’s most northern point,Cape Nordkinn. Free-floating phytoplankton highlight the whirls ofocean currents in spectacular shades of blue <strong>and</strong> green. Thesemicroscopic marine organisms that drift on or near the surface ofoceans <strong>and</strong> seas have been called “the grass of the sea” becausethey are the foundation of the oceanic food chain. Phytoplanktonare able to convert inorganic compounds such as water, nitrogen<strong>and</strong> carbon into complex organic materials. With their ability to“digest” these compounds, they are credited with removing as muchcarbon dioxide from the atmosphere as their plant “cousins” on l<strong>and</strong>– therefore having a profound influence on climate. They are alsosensitive to environmental changes, so it is important to monitor <strong>and</strong>model phytoplankton into calculations of future climate change.© ESA