Biodiversity, biocapacity and better choices
Biodiversity, biocapacity and better choices
Biodiversity, biocapacity and better choices

Create successful ePaper yourself
Turn your PDF publications into a flip-book with our unique Google optimized e-Paper software.
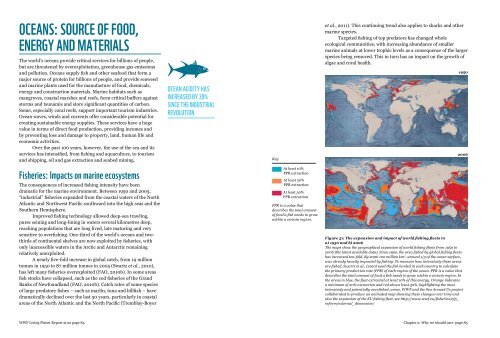
Oceans: SOURCE OF FOOD,ENERGY AND MATERIALSThe world’s oceans provide critical services for billions of people,but are threatened by overexploitation, greenhouse gas emissions<strong>and</strong> pollution. Oceans supply fish <strong>and</strong> other seafood that form amajor source of protein for billions of people, <strong>and</strong> provide seaweed<strong>and</strong> marine plants used for the manufacture of food, chemicals,energy <strong>and</strong> construction materials. Marine habitats such asmangroves, coastal marshes <strong>and</strong> reefs, form critical buffers againststorms <strong>and</strong> tsunamis <strong>and</strong> store significant quantities of carbon.Some, especially coral reefs, support important tourism industries.Ocean waves, winds <strong>and</strong> currents offer considerable potential forcreating sustainable energy supplies. These services have a hugevalue in terms of direct food production, providing incomes <strong>and</strong>by preventing loss <strong>and</strong> damage to property, l<strong>and</strong>, human life <strong>and</strong>economic activities.Over the past 100 years, however, the use of the sea <strong>and</strong> itsservices has intensified, from fishing <strong>and</strong> aquaculture, to tourism<strong>and</strong> shipping, oil <strong>and</strong> gas extraction <strong>and</strong> seabed mining.Ocean acidity hasincreased by 30%since the IndustrialRevolutionKeyet al., 2011). This continuing trend also applies to sharks <strong>and</strong> othermarine species.Targeted fishing of top predators has changed wholeecological communities, with increasing abundance of smallermarine animals at lower trophic levels as a consequence of the largerspecies being removed. This in turn has an impact on the growth ofalgae <strong>and</strong> coral health.19502006Fisheries: Impacts on marine ecosystemsThe consequences of increased fishing intensity have beendramatic for the marine environment. Between 1950 <strong>and</strong> 2005,“industrial” fisheries exp<strong>and</strong>ed from the coastal waters of the NorthAtlantic <strong>and</strong> Northwest Pacific southward into the high seas <strong>and</strong> theSouthern Hemisphere.Improved fishing technology allowed deep-sea trawling,purse seining <strong>and</strong> long-lining in waters several kilometres deep,reaching populations that are long lived, late maturing <strong>and</strong> verysensitive to overfishing. One-third of the world’s oceans <strong>and</strong> twothirdsof continental shelves are now exploited by fisheries, withonly inaccessible waters in the Arctic <strong>and</strong> Antarctic remainingrelatively unexploited.A nearly five-fold increase in global catch, from 19 milliontonnes in 1950 to 87 million tonnes in 2005 (Swartz et al., 2010),has left many fisheries overexploited (FAO, 2010b). In some areasfish stocks have collapsed, such as the cod fisheries of the Gr<strong>and</strong>Banks of Newfoundl<strong>and</strong> (FAO, 2010b). Catch rates of some speciesof large predatory fishes – such as marlin, tuna <strong>and</strong> billfish – havedramatically declined over the last 50 years, particularly in coastalareas of the North Atlantic <strong>and</strong> the North Pacific (Tremblay-BoyerAt least 10%PPR extractionAt least 20%PPR extractionAt least 30%PPR extractionPPR is a value thatdescribes the total amountof food a fish needs to growwithin a certain region.Figure 51: The expansion <strong>and</strong> impact of world fishing fleets ina) 1950 <strong>and</strong> b) 2006The maps show the geographical expansion of world fishing fleets from 1950 to2006 (the latest available data). Since 1950, the area fished by global fishing fleetshas increased ten-fold. By 2006 100 million km 2 , around 1/3 of the ocean surface,was already heavily impacted by fishing. To measure how intensively these areasare fished, Swartz et al., (2010) used the fish l<strong>and</strong>ed in each country to calculatethe primary production rate (PPR) of each region of the ocean. PPR is a value thatdescribes the total amount of food a fish needs to grow within a certain region. Inthe areas in blue, the fleet extracted at least 10% of this energy. Orange indicatesa minimum of 20% extraction <strong>and</strong> red shows least 30%, highlighting the mostintensively <strong>and</strong> potentially overfished, areas. WWF <strong>and</strong> the Sea Around Us projectcollaborated to produce an animated map showing these changes over time <strong>and</strong>also the expansion of the EU fishing fleet, see http://www.wwf.eu/fisheries/cfp_reform/external_dimension/WWF Living Planet Report 2012 page 84 Chapter 2: Why we should care page 85