Outerwear. - Business Location Switzerland
Outerwear. - Business Location Switzerland
Outerwear. - Business Location Switzerland

Create successful ePaper yourself
Turn your PDF publications into a flip-book with our unique Google optimized e-Paper software.
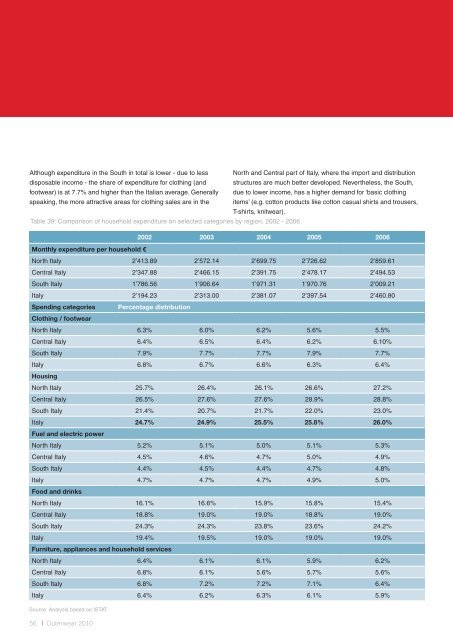
Although expenditure in the South in total is lower - due to less North and Central part of Italy, where the import and distribution<br />
disposable income - the share of expenditure for clothing (and structures are much better developed. Nevertheless, the South,<br />
footwear) is at 7.7% and higher than the Italian average. Generally due to lower income, has a higher demand for ‘basic clothing<br />
speaking, the more attractive areas for clothing sales are in the items’ (e.g. cotton products like cotton casual shirts and trousers,<br />
T-shirts, knitwear).<br />
Table 39: Comparison of household expenditure on selected categories by region, 2002 - 2006<br />
56<br />
l <strong>Outerwear</strong> 2010<br />
2002 2003 2004 2005 2006<br />
Monthly expenditure per household €<br />
North Italy 2’413.89 2’572.14 2’699.75 2’726.62 2’859.61<br />
Central Italy 2’347.88 2’466.15 2’391.75 2’478.17 2’494.53<br />
South Italy 1’786.56 1’906.64 1’971.31 1’970.76 2’009.21<br />
Italy 2’194.23 2’313.00 2’381.07 2’397.54 2’460.80<br />
Spending categories<br />
Clothing / footwear<br />
Percentage distribution<br />
North Italy 6.3% 6.0% 6.2% 5.6% 5.5%<br />
Central Italy 6.4% 6.5% 6.4% 6.2% 6.10%<br />
South Italy 7.9% 7.7% 7.7% 7.9% 7.7%<br />
Italy<br />
Housing<br />
6.8% 6.7% 6.6% 6.3% 6.4%<br />
North Italy 25.7% 26.4% 26.1% 26.6% 27.2%<br />
Central Italy 26.5% 27.6% 27.6% 28.9% 28.8%<br />
South Italy 21.4% 20.7% 21.7% 22.0% 23.0%<br />
Italy<br />
Fuel and electric power<br />
24.7% 24.9% 25.5% 25.8% 26.0%<br />
North Italy 5.2% 5.1% 5.0% 5.1% 5.3%<br />
Central Italy 4.5% 4.6% 4.7% 5.0% 4.9%<br />
South Italy 4.4% 4.5% 4.4% 4.7% 4.8%<br />
Italy<br />
Food and drinks<br />
4.7% 4.7% 4.7% 4.9% 5.0%<br />
North Italy 16.1% 16.6% 15.9% 15.8% 15.4%<br />
Central Italy 18.8% 19.0% 19.0% 18.8% 19.0%<br />
South Italy 24.3% 24.3% 23.8% 23.6% 24.2%<br />
Italy 19.4% 19.5% 19.0% 19.0% 19.0%<br />
Furniture, appliances and household services<br />
North Italy 6.4% 6.1% 6.1% 5.9% 6.2%<br />
Central Italy 6.8% 6.1% 5.6% 5.7% 5.6%<br />
South Italy 6.8% 7.2% 7.2% 7.1% 6.4%<br />
Italy 6.4% 6.2% 6.3% 6.1% 5.9%<br />
Source: Analysis based on ISTAT