References - George E King Petroleum Engineering Oil and Gas ...
References - George E King Petroleum Engineering Oil and Gas ...
References - George E King Petroleum Engineering Oil and Gas ...
- No tags were found...

Create successful ePaper yourself
Turn your PDF publications into a flip-book with our unique Google optimized e-Paper software.
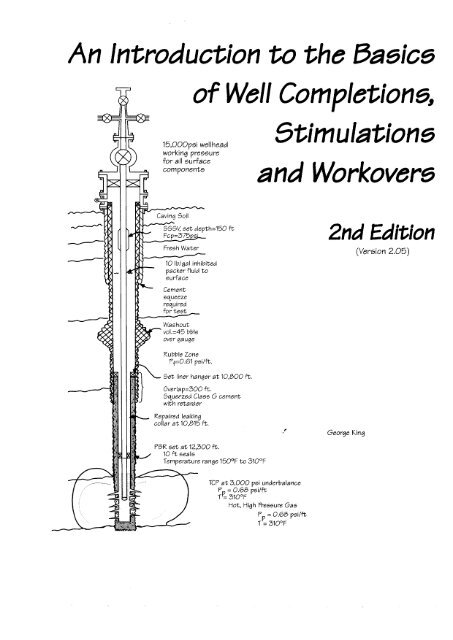
An Introduction to the Basic5I*315,OOOpsi wellheadworking pressurefor all surfaceof Well C0mpletion5~5timulations<strong>and</strong> Workovers2nd Edition(Version 2.05)Rubble ZoneSet liner hanger a t 10,800 ft.with retarderI<strong>George</strong> <strong>King</strong>PBR set at 12,300 ft.Hot, High Fi-essure <strong>Gas</strong>
JiAn Introduction to the Basics of WellCompletions, S tim ula tions an dWorkovers2nd edition(version 2.05)<strong>George</strong> E. <strong>King</strong>Copyright 1988-1998 by <strong>George</strong> E. <strong>King</strong>, TuIsa, Oklahoma
Copyright 1988-1996 by <strong>George</strong> E. <strong>King</strong>Document may not be copied in any mannerInquiries to:4<strong>George</strong> E. <strong>King</strong>5555 S. 97 W. Ave.S<strong>and</strong> Springs, OK 74063(918) 446-7081(918) 660-3226
Problems ........................................................................................................ 2-42<strong>References</strong> .................................................................................................. 2-42Other <strong>References</strong> ........................................................................................ 2-45Casing Horizontal Wells ................................................................................. 2-54Reach Interval ......................................................................................... 2-54Rotation <strong>and</strong> Torque ................................................................................ 2-55The Build Interval .................................................................................... 2-55Bending Stress ........................................................................................ 2-56Vertical Interval ........................................................................................ 2-57Application ............................................................................................... 2-58Cementing ...................................................................................................................... 3-1Cement Density ......................................................................................... 3-4Fluid Loss .................................................................................................. 3-4Factors Affecting Cement .......................................................................... 3-5Cementing Design ............................................................................................ 3-6Primary Cementing ........................................................................................... 3-6Application ................................................................................................. 3.7Cementing Calculations .......................................................................... 3.14Balanced Plug Setting ............................................................................. 3.15Squeeze Cementing ................................................................................ 3-16Cement Squeeze Tools ........................................................................... 3-17Liner Cementing ...................................................................................... 3-18Frictional Pressure Dropin Pipe ............................................................... 3-19<strong>References</strong> .................................................................................................. 3-20Cementing: Review Questions .................................................................... 3-23Packer Selection <strong>and</strong> Tubing Forces ...................................................................... 4.1Production Packers ................................................................................... 4. 1Special Equipment .................................................................................... 4. 1Dressing Packers ...................................................................................... 4-3Allowing Tubing Movement ....................................................................... 4-3Effects of Temperature .............................................................................. 4-4Deep Completions ..................................................................................... 4-5Seal Considerations .................................................................................. 4-8Seal Problems ........................................................................................... 4.9Tubing <strong>and</strong> Packer Forces ........................................................................ 4-9Length or Force Changes? ...................................................................... 4-13Setting the Packer ................................................................................... 4-14Combined Forces .................................................................................... 4-16Special Packers .............................................................................................. 4-17Tubing Stretch <strong>and</strong> Compression ............................................................ 4-17Problems ........................................................................................................ 4-17<strong>References</strong> .................................................................................................. 4-18Well Heads, Chokes <strong>and</strong> SSSVs ............................................................................... 5-1Well heads ........................................................................................................ 5-1Subsea Well heads ............................................................................................ 5-3Coiled Tubing Well Heads ................................................................................ 5-5Hydrate Control in Coiled Tubing Completions ................................................ 5-5Chokes ............................................................................................................. 5-7Subsurface Safety Valves ................................................................................ 5-8
<strong>References</strong> ................................................................................................... 5-12Corrosion <strong>and</strong> Erosion ............................................................................................... 6-1Corrosion ......................................................................................................... 6-1The Corrosion Circuit ................................................................................ 6-2Chemical Reaction ................................................................................... 6-2Acid <strong>Gas</strong>es ............................................................................................... 6-4Controlling Corrosion ................................................................................ 6-5Materials for Sour Service ...................................................................... 6-10CO2 Corrosion ........................................................................................ 6-11Other Factors ........................................................................................... 6-12Corrosion by Stimulation Acids ............................................................... 6-13Destruction of Elastomers ...................................................................... 6-14Microbial Corrosion ................................................................................. 6-14Nonmetallic Tubulars .............................................................................. 6-14Predictive Techniques <strong>and</strong> Inspection Devices ...................................... 6-14Erosion ........................................................................................................... 6-15Corrosion <strong>References</strong> .................................................................................. 6-17Inflow Performance, Tubing Selection, <strong>and</strong> Artificial Lift .................................. 7-1Inflow Performance ................................................................................... 7-1Tubing Design .......................................................................................... 7-2Heading .................................................................................................... 7-8Tubing Design .......................................................................................... 7-9Artificial Lift ............................................................................................... 7-9Rod Pump ............................................................................................... 7-10Rod Pump ............................................................................................... 7-12<strong>Gas</strong> Lift ................................................................................................... 7-16Electrical Submersible Pump .................................................................. 7-16Other Systems ........................................................................................ 7-16Lift Selection ........................................................................................... 7-16Reservoir Fluid Classification ................................................................. 7-17<strong>References</strong> ................................................................................................... 7-19Special Completions (Deviated, Thermal Multiples, <strong>and</strong> Multi-Laterals) ....... 8-1Deviated Completions ...................................................................................... 8-1Descriptions .............................................................................................. 8- 1Horizontal Well C<strong>and</strong>idate Selection ............................................................... 8-2Horizontal Completions Background ............................................................... 8-3Path of the Horizontal Section ......................................................................... 8-7Artificial Lift Options ......................................................................................... 8-8Solids Control Techniques ............................................................................... 8-9Fracturing ............................................................................................... 8-10Increasing Reservoir Contact ........................................................................ 8-12Logging ................................................................................................... 8-13Wellbore Stability .................................................................................... 8-15Perforating .............................................................................................. 8-17CorrosionErosion ................................................................................... 8-18Gravel Packs .......................................................................................... 8-19Coning Control ........................................................................................ 8-19Heading Problems ......................................................................................... 8-21Multi-lateral Completions ............................................................................... 8-21
Lateral Technology Levels ...................................................................... 8.22C<strong>and</strong>idate List ................................................................................................. 8.24The c<strong>and</strong>idate list for design is still forming but has the following considerations:8-24Thermal Completions ..................................................................................... 8.25Steam Projects ........................................................................................ 8-25Combustion Projects ............................................................................... 8-26Alternate Heating Methods ...................................................................... 8.26Stimulation ............................................................................................... 8.26Corrosion <strong>and</strong> Scale ................................................................................ 8-27Insulation ................................................................................................. 8-28Tubular Design ........................................................................................ 8-28Cementing Considerations ...................................................................... 8.30Completions ............................................................................................ 8.3 1Coalbed Methane Wells ................................................................................. 8-32Multiple Completions ...................................................................................... 8-35Tubingless Completions .......................................................................... 8.36Selection of a Completion ....................................................................... 8-38Monobores .............................................................................................. 8-38Coiled Tubing Completions ............................................................................ 8-40<strong>References</strong> .................................................................................................. 8-42Logging ........................................................................................................... 8-50Stress in an Deviated Well ............................................................................. 8-50Well Completion Problems ............................................................................. 8-52Productivity Estimates .................................................................................... 8.53Perforating ..................................................................................................................... 9.1Temperature Effect .................................................................................... 9-6Perforation Size ......................................................................................... 9-6Calculated Pressure Drop ....................................................................... 9-16Partial Completion ................................................................................... 9-16Underbalance Perforating ....................................................................... 9-17Extreme Overbalance Perforating ........................................................... 9-19Tubing Conveyed Perforating .................................................................. 9-19Wireline Perforating ................................................................................. 9-21Highly Deviated Wells ............................................................................. 9-22Depth Control .......................................................................................... 9.22Cement Damage ..................................................................................... 9.23Casing Damage ....................................................................................... 9-23Repetiora ting Considerations .................................................................. 9-24Stimulation Considerations ...................................................................... 9-25Stimulations in Deviated Wells - Effect of Perfs ...................................... 9-26A brasiveErosive Perforating ................................................................... 9-26Pipe Cutoff Methods ....................................................................................... 9-27Questions ................................................................................................ 9-27<strong>References</strong> - Perforating .............................................................................. 9-28Formation Damage - Causes <strong>and</strong> Preventions ................................................... 10-1Clays ............................................................................................................... 10-6Common Types of Clay ........................................................................... 10-8Water lmbibition of Clays ........................................................................ 10-9. iv .
Clay Swelling .......................................................................................... 10-9Clay Dispersion ...................................................................................... 10-9Other Clay Problems ............................................................................ 10-1 0Paraffins <strong>and</strong> Asphaltenes ........................................................................... 10-1 1Emulsions .................................................................................................... 10-1 3Dispersions .................................................................................................. 10-1 5Foams .......................................................................................................... 10-1 6Froth ............................................................................................................ 10-1 6Wettability Problems .................................................................................... 10-1 6Hydrates ...................................................................................................... 10-1 7Scales .......................................................................................................... 10-1 8Calcite ................................................................................................... 10-1 8Calcium Sulfate .................................................................................... 10-1 9Barium Sulfate ...................................................................................... 1 0-21Strontium Sulfate .................................................................................. 1 0-2 1Other Scales ......................................................................................... 10-22Particulate Damage ..................................................................................... 10-22Drilling Mud ........................................................................................... 10-22Cements ............................................................................................... 10-22Kill Fluids .............................................................................................. 10-22Dirty Water ............................................................................................ 10-22Bacteria Problems ................................................................................ 1 0-22Effects of Formation Damage on Production ............................................... 10-23Rate <strong>and</strong> Skin ....................................................................................... 10-23Example 70.7 ........................................................................................ 1 0-23Example 70.2 ........................................................................................ 1 0-27Example 70.3 ........................................................................................ 1 0-28Using Production History Curves to Assess Damage .................................. 10-28Example 70.4 ........................................................................................ 10-28Workover C<strong>and</strong>idate Selection .................................................................... 10-29Example 70.5 ........................................................................................ 1 0-29Formation Damage - Questions ................................................................... 10-30<strong>References</strong> ................................................................................................. 1 0-30Formation <strong>and</strong> Damage Diagnosis ........................................................................ 11-1Drill Stem Test (DST) ................................................................................... 11-1Nodal Analysis ............................................................................................... 11-4Inflow Performance ...................................................................................... 11-5Equations of Flow ................................................................................... 11-9Decline Curves ............................................................................................ 1 1-1 5System Pressures ........................................................................................ 1 1-1 6Fluid Analysis ............................................................................................. 1 1-1 8Transient Tests .......................................................................................... 1 1-21Reservoir Logging Methods ....................................................................... 1 1-28Gamma Ray Logging ............................................................................ 1 1-28Acoustic or Sonic Logging .................................................................... 1 1-28Neutron Logging ................................................................................... 1 1-29Density Logging .................................................................................... 1 1 -29Natural Gamma Ray Spectroscopy Log ............................................... 1 1-30-V-
Induced Gamma Ray Spectroscopy Log ............................................... 1 1-30Open-Hole Logging ............................................................................... 1 1-30Depth of lnvasion .................................................................................. 1 1-35Other Logs ............................................................................................. 1 1-36Cased Hole Logging .............................................................................. 1 1-37Electric Logging Tool Response ................................................................ 11-38Direct Borehole Investigation ................................................................ 1 1-40Formation Tester ................................................................................... 1 1-41Fluid Movement Surveys .............................................................................. 1 1-42Fluid Surveys - Formation ............................................................................ 11-43Fluid Surveys - Wellbore .............................................................................. 1 1-43Noise Logging ....................................................................................... 1 1 -46Borehole Surveys .................................................................................. 1 1-47Mapping ..................................................................................................... 11-47Completion <strong>and</strong> Lift Analysis ..................................................................... 11-50Production <strong>and</strong> Operations Information ..................................................... 11-50Rock Mechanics Information From Logs ................................................... 11-51Mechanical Properties ........................................................................... 1 1-53Basic Logging Tool Response ................................................................... 11 -55Gamma Ray Logging ................................................................................. '11-56Acoustic or Sonic Logging ......................................................................... 11-56Neutron Logging ........................................................................................ 11-56Density Logging ......................................................................................... 11-57Natural Gamma Ray Spectroscopy Log .................................................... 11-57Induced Gamma Ray Spectroscopy Log ................................................... 11-57<strong>References</strong> ................................................................................................ 11-58Chemical <strong>and</strong> Thermal Stimulation ........................................................................ 12-1Example 12.1 .......................................................................................... 12-2Example 12.2 .......................................................................................... 12-2Selecting a C<strong>and</strong>idate Well ............................................................................ 12-3Evaluation of Stimulations .............................................................................. 12-3Selective Stimulation ...................................................................................... 12-4Diverting vs . Fluid Loss Control .............................................................. .l 2-4C<strong>and</strong>idates .............................................................................................. 12-4Diverter Operation ................................................................................... 12-5Limited Entry (Pressure Differential Diverting) ....................................... .12-5Mechanical Diverting ............................................................................... 12-6Chemical Diverlers ................................................................................ 12-1 1lnterface Treatments ............................................................................. 12-14Diverler/Fluid Loss Control Stages ........................................................ 12-15HCVHF Treatment Diversion ................................................................. 12-17Recommendations ................................................................................ 12-17Cleanup ................................................................................................. 12-18Packoff Techniques ............................................................................... 12-18Technology of Bridging .......................................................................... 12-18Depth of Diversion ................................................................................. 12-18Chemical Stimulation Techniques ................................................................ 12-19Acidizing ................................................................................................ 12-19HF Acid Spending Rates .............................................................................. 12-20-vi-
Solvents ....................................................................................................... 12-21<strong>Gas</strong>es .......................................................................................................... 12-22Surfactants ................................................................................................... 12-22Reactants ..................................................................................................... 12-22Treatment Types .......................................................................................... 12-22Damage Removal ........................................................................................ 12-23Reaction Rate Factors ................................................................................. 12-24Temperature ......................................................................................... 12-24Pressure ............................................................................................... 1 2-24Area Volume Ratio ............................................................................... 12-24Acid Concentration ............................................................................... 1 2-24Acid Selection ....................................................................................... 12-24Formation Composition ........................................................................ 1 2-25Additives ...................................................................................................... 12-25Surfactants ........................................................................................... 12-25Weffability ............................................................................................. 12-26Mutual Solvents .................................................................................... 1 2-27Wash Design ............................................................................................... 12-28Wellbore Cleanup <strong>and</strong> Acid Wash ........................................................ 12-28Solvent Wash of Injection Wells ........................................................... 12-28Perforation Breakdown ......................................................................... 1 2-28Extreme Overbalance Perforating ............................................................... 12-29Matrix Acidizing Design ............................................................................... 12-29Obtaining the Required Information ...................................................... 1 2-29Designing the Treatment ...................................................................... 1 2-3 1Thermal Stimulation ..................................................................................... 12-35Chemical Heat Generation ................................................................... 1 2-37<strong>References</strong> ................................................................................................. 12-38Granular Salt ........................................................................................ 12-43100-Mesh S<strong>and</strong> .................................................................................... 12-43Calcium Carbonate ............................................................................... 1 2-43Naphthalene ......................................................................................... 12-43Benzoic Acid Flakes ............................................................................. 12-44Wax Beads ........................................................................................... 12-44Organic Resin Beads ............................................................................ 12-44Organic Resin Dispersions ................................................................... 1 2-44Micron Size Patticulates ....................................................................... 1 2-44Poiymers ............................................................................................... 12-45Others ................................................................................................... 12-45Fracturing .................................................................................................................... 13-1Recovery by Fracturing .................................................................................. 13-1Fracturing Economics .................................................................................... 13-2Fracturing Length <strong>and</strong> Conductivity Decisions .............................................. 13-3Fracture Design ........................................................................................... 13-1 5Fracture Length <strong>and</strong> Width - Modeling ................................................. 13-1 5Fracture Orientation <strong>and</strong> Formation Stresses ....................................... 1 3-1 6Fluid Loss ............................................................................................. 1 3-1 7Fracturing Design ................................................................................. 1 3-20
Closure Stress ....................................................................................... 13-25Fracture Treatments .............................................................................. 13-29Fracture Treatment Design ................................................................... 13-29When To Fracture ................................................................................. 13-33Treatment Pressure Behavior ............................................................... 13-33<strong>References</strong> ................................................................................................ 13-34Unstable Formations <strong>and</strong> S<strong>and</strong> Control ............................................................... 14-1S<strong>and</strong> Cementation .......................................................................................... 14-1Formation Characterization ..................................................................... 14-2S<strong>and</strong> Movement Prediction ..................................................................... 14-4S<strong>and</strong> Control Considerations ................................................................ 14-12S<strong>and</strong> Control ......................................................................................... 14-13Alternate Gravel Sizing Methods ........................................................... 14-20Current Gravel Pack Design Methods <strong>and</strong> Problem Identification ........ 1 4-2 1Mobility of Fines .................................................................................... 14-22S<strong>and</strong> Sorting Considerations ................................................................. 14-23Benefits of Larger Gravel ...................................................................... 14-24Carrier Fluids ......................................................................................... 14-26Equipment ............................................................................................. 14-28Packing Methods ................................................................................... 14-29Fluid Loss Control ................................................................................. 14-30Alternate Path Gravel Packing .............................................................. 14-30Pressure Drops Across Gravel Packs ................................................... 14-31Example ................................................................................................ 14-32Pack <strong>and</strong> Frac Technology .................................................................... 14-32Reservoir Lamination <strong>and</strong> Well Deviation ............................................. 14-33Other Unstable Formations ................................................................... 14-33<strong>References</strong> - Gravel Pack .......................................................................... 14-34Workovers <strong>and</strong> Fluids ............................................................................................... 15-1Well Control ............................................................................................. 15-1Example 15 . I .......................................................................................... 15-2Example 15.2 .......................................................................................... 15-3Example 15.3 .......................................................................................... 15-3Shut-In ..................................................................................................... 15-5(Re)Gaining Control ................................................................................ 15-6Example 15.4 .......................................................................................... 156Pressure Effects .................................................................................... 15-11Snubbing ............................................................................................... 15-14Example 15.5 ........................................................................................ 15-14Completion/Workover Fluids ................................................................. 15-16Example 15.6 ........................................................................................ 15-18Example 75.7 ........................................................................................ 15-19Example 15.8 ........................................................................................ 15-20Example 15.9 ........................................................................................ 15-20Example I5 . I0 ...................................................................................... 15-22Before the Job WC ................................................................................ 15-26Fluid Filtration ............................................................................................... 1527Field Testing <strong>and</strong> Measurement of “Clean” ........................................... 15-32Application ............................................................................................ .15-32Kill String Completions .......................................................................... 15-33Returning Wells to Operation ................................................................ 15-33Workover <strong>References</strong> ................................................................................ 15-34. viii .
<strong>References</strong> on Filtration ............................................................................. 15-35High Temperature, High Pressure Completions ................................................. 16-1Completions Operations ................................................................................. 16-2Brines ............................................................................................................. 16-5Stimulation ...................................................................................................... 16-5Formation Damage ......................................................................................... 16-6Well Design .................................................................................................... 16-7Completions Equipment ................................................................................. 16-7Subsurface Safety Valves .............................................................................. 16-8Annular Pressure Buildup ............................................................................. 16-10<strong>References</strong> ................................................................................................ 16-11Water Production Control ........................................................................................ 17-1Summary of Important Points .................................................................. 17-1Sources of Water ..................................................................................... 17-1Problem Definition Reservoir ................................................................ 17-2Problem Definition - Near Wellbore ......................................................... 17-3Coning ..................................................................................................... 17-3Water Block ............................................................................................. 17-5Problem Definition - Injection Well .......................................................... 17-6Reservoir Description <strong>and</strong> Modeling Necessities .................................... 17-7Treating Considerations .......................................................................... 17-7..Modification of Permeability ............................................................................ 17-7Deep Modification - Permeability Reduction ........................................... 17-7Deep Modification - Increasing Permeability ........................................... 17-7Shallow Modification Permeability Reduction ........................................ 17-8Shallow Modification - Increasing Permeability ....................................... 17-9<strong>References</strong> .................................................................................................. 17-9Wireline <strong>and</strong> Coiled Tubing Operations ................................................................ 18-1Wireline Operations ................................................................................. 18-1Downhole Wireline Equipment ................................................................ 18-2Pressure <strong>and</strong> Fluid Control ...................................................................... 18-6Special Services ...................................................................................... 18-9Tools for Downhole Measurements ......................................................... 18-9Coil Tubing Operations ................................................................................ 18-9Chain Injector ........................................................................................ 18-10Axial Load Capacity ............................................................................... 18-25Depth Limitations .......................................................................................... 18-27Buoyancy ...................................................................................................... 18-28Tapered Strings ............................................................................................ 18-30Buckling ........................................................................................................ 18-31Capacity <strong>and</strong> Displacement .......................................................................... 18-31Fluid Unloading in Casing ............................................................................. 18-40Friction Pressure .......................................................................................... 18-42Well Testing with Coiled Tubing ................................................................... 18-44<strong>References</strong> ................................................................................................ 18-44Additional <strong>References</strong> on Coiled Tubing ................................................... 18-46Workover Fishing ....................................................................................................... 19-1Location of Stuck Point ............................................................................ 19-6
<strong>References</strong> . Fishing .................................................................................... 19-8<strong>References</strong> . Milling ..................................................................................... 19-8Plug <strong>and</strong> Ab<strong>and</strong>onment Procedures ..................................................................... 20-1Legal Requirements ....................................................................................... 20-2Setting Cement Plugs ..................................................................................... 20-2Other Plugging Processes .............................................................................. 20-6Milling a Packer ....................................................................................... 20-7<strong>References</strong> - Plug <strong>and</strong> Ab<strong>and</strong>onment .......................................................... 20-7Effects of Completion, Stimulation <strong>and</strong> Workover Activities on Surface FacilityOperations .............................................................................................................. 21-1Stimulation Flowbacks .................................................................................... 21-7Testing the Backflow ...................................................................................... 21-7Causes of Upsets .................................................................................... 21-7Flowback Duration ........................................................................................ 21 -1 2Treating the Returning Acid .......................................................................... 21-13Treatment Choices ....................................................................................... 21-13<strong>Oil</strong> Foams ..................................................................................................... 21-14<strong>References</strong> ................................................................................................ 21 -1 4-X-
Introduction: Basic Well Completion ConceptsPorosityPorosity is the fraction of the total volume of the rock that is pore (non rock) space or void <strong>and</strong> notmade of solid pieces of the formation. It will be filled with a gas, water or hydrocarbon or two or moreat the same time. Porosity will range from a high of 40-50% in some marginally consolidated chalk formationsto a low of near zero in some of the evaporites (anhydrite). The average porosity of producingreservoirs ranges from about 515% in limestones or dolomites, 10-25% in s<strong>and</strong>stones <strong>and</strong> over 30%in many of the chalk formations. In most unconsolidated formation, porosity depends upon the grainsize distribution; not on the absolute size of the grain itself. Porosity can be in the order of 35-40% ifall grains are close to the same size, but in most cases where a wide range of grain sizes are available,the porosity will be between 15-25%. Severe cases of formations with mixtures of large <strong>and</strong> verysmall grains may have porosities less than 15%.Lower porosities, such as 10% or less, are usually the result of chemical modification of the porestructure, i.e., recementation, precipitation of additional minerals, or leaching <strong>and</strong> reprecipitation. Insome cases, the very consolidated s<strong>and</strong>stones with overgrowth of quartz may have porosities down tonear zero.Geologists further subdivide porosity into several descriptive classifications that help engineersdescribe the flow of fluids through the formation <strong>and</strong> into the wellbore. The major classifications arebriefly described in the following paragraphs.1. Matrix porosity or intergranular porosity - the porosity between the grains of the formation.2. Vug porosity - porosity in the solution chambers that may range from a tenth of a millimeter tovoids larger than a basketball.3. Fracture porosity - the void space created within the walls of an open natural fracture.4. Micro porosity - the voids between the clay platelets or particles. Although a large micro porositymay exist, production of fluids from them is often difficult since the fluids are usually held bystrong cohesive forces.The matrix porosity is referred to as the primary porosity <strong>and</strong> most other porosities are secondary.Usually, the pore space described by natural fractures <strong>and</strong> vugs are produced or swept very early(flush production) <strong>and</strong> their continuing use becomes as a conductive pathway to the wellbore. Longterm production rate estimates are usually based upon the reserves in the matrix except in very largefields where solution porosity (vugs) is very extensive.Porosity values derived from neutron or sonic logs are usually used alone with other log information<strong>and</strong> well observations to establish whether a section of rock is “pay.” Although the use of porosity inthis manner is common, it can also be very misleading. Obviously, porosity is not a “st<strong>and</strong> along” valuefor establishing the quality of ‘pay.” Shales, for example, have porosities of 30% or more but lack theconductive pathways (permeability) to make them economic except where fractured gas-rich shalesexist in massive sections.The location <strong>and</strong> type of porosity has a great affect on the performance of a well. Relying totally on alog derived porosity, especially in a carbonate, may provide unexpected low production or may resultin missing productive intervals. The occurrence of lime muds, a low porosity deposit common withinlimestones may isolate porosity <strong>and</strong> result in much lower effective porosities than reported with a log.Fossils, porosity within grains, <strong>and</strong> isolated vugs encased by grain overgrowths may also result in highporosity readings without adding to the porosity of the reservoir. These porosity problems are usuallyonly spotted with the aide of core examinations.i-1
Lower porosity rocks (less than 10%) may be pay in a few instances if microfractures exist at reservoirconditions. The open microfractures serve as drainage paths for fluid flow from very low porosity butextensive parts of the rock.SaturationThe fraction of pore space containing water is called the water saturation <strong>and</strong> usually denoted by anSw. The remaining fraction of the pore space that contains oil or gas is called hydrocarbon saturationSh. The simple balance sh = 1 - Sw accounts for all of the pore space within a rock. In almostevery porous formation, there is at least a small amount of water saturation. Usually when the sedimentswere laid down, the matrix materials were dispersed in water. As the hydrocarbon entered theporous formation, water was displaced from many of the pores, although the displacement process isnot efficient enough to move all the water. This displacement process, whether it was oil displacingwater over geologic time, or water displacing oil during water drive or water flooding, results in a lowersaturation of the fluid being displaced. If a very large amount of the driving fluid is displaced, the quantityof the initial fluid reaches a point, usually a few percent of the pore space, where it cannot bereduced further. This level of fluid is the irreducible saturation of that fluid. Therefore, an irreduciblewater saturation, S,i, is the saturation of water in the core that cannot be removed by migration ofhydrocarbon. This water or oil, Soil may be trapped in the small pores, held by high capillary attraction,or bound to clays as a surface layer or in the clay lattice.PermeabilityPermeability, denoted by a lower case k, is a measure of the conductance of the formation to flow of afluid. The higher the permeability, the easier it is (takes less driving pressure) for a fluid to flowthrough the rock matrix. The “law” was originally derived by a French engineer named d’Arcy toaccount for the flow of water through s<strong>and</strong> filters. The original permeability concept used darcies as aunit of measurement, but most productive formations will be between 0.001 md (1 md = 0.001 darcy)<strong>and</strong> 1000 millidarcies (1 darcy). Permeability depends on the absolute grain size of the rock, how wellthe sediments are sorted, presence of fractures, <strong>and</strong> how much chemical modification has occurred inthe matrix. Flowing <strong>and</strong> bound fluid properties also affect the permeability. Large-grained sedimentswith a minimum of fine particles (large, open pores) usually have high permeabilities whereas veryfine-grained sediments with small pores have lower permeabilities. Porosity does not always relatedirectly to permeability. Materials such as shales <strong>and</strong> some chalks may have very high porosities butlow permeability because of lack of effective connection of the pores.Permeability to oil, water <strong>and</strong> gas may be different because of viscosity differences <strong>and</strong> other influencessuch as wetting <strong>and</strong> the issue of the thickness of the liquid coating on the pore wall. <strong>Oil</strong> wet formationsare usually thought to be less permeable to the flow of water than water wet formationsbecause the molecular thickness of the oil coating is thicker than that of water. This leaves less porespace for fluids flow. When more than one phase exists in the pore, relative permeability relationshipsgovern the flow.Relative PermeabilityThe effects of relative permeability explain many of the problems involved in formation damage <strong>and</strong>reduction of flow from a formation, either on initial production or after treating with a material whichseverely oil wets the formation. As will be pointed out in the chapter on formation damage, problemswith relative permeability include a significant drop in permeability to the saturating fluid as traceamounts of a second, immiscible phase are introduced in the flowing liquid. Reductions of up to 80%of initial permeability are common when saturation of an immiscible phase is increased from zero toapproximately 20 or 25%. It is this significant reduction in permeability that explains much of the damagebehind overtreatment with an oil-filming chemical, such as an oil-based drilling mud, or the use ofhighly absorptive surfactants or solvents. The surface of the rock also plays an important part sincethe charge of a surfactant controls the attraction to a particular formation face. It must be rememberedthat severe wettability problems such as the absorption of cationic materials onto s<strong>and</strong>stones <strong>and</strong> theabsorption of anionic materials onto limestones can play a significant role in permeability reduction.i-2
The reduction from this coating or wetting may be severe <strong>and</strong> can be long-lasting, depending on thetenacity of the coating.Matrix cleanup of this type of wetting is imperative to fully restore the flow capacity of the formation.Cleanup of this type of damage must take into account both the stripping of the relative permeabilityinfluencing layer <strong>and</strong> the type of rock surface to which it is adsorbed.Natural FracturesNatural fractures are breaks in the fabric of the rock caused by a wide variety of earth forces. Thesenatural fractures may have widths of a few thous<strong>and</strong>ths of an inch to a tenth of an inch or more. Naturalfractures generally have a common direction that corresponds to forces generated by a significantgeologic event in the area such as folding, faulting, or tectonic forces. Where solution etching orcementation forces are active, the fractures may be widened into extensive vugs with permeabilities ofhundreds of darcies or filled completely with precipitated minerals. Stylolites or gouge filled fracturesare examples of these behaviors. Natural fractures influence flush production or high initial productionrate that diminishes quickly after bringing on a new well or the start of flow in a well that has beenshut-in. Although they serve as conductive pathways for oil or gas production, they also will transmitwater at a much faster rate than the formation matrix, leading to early breakthrough of water or othertype floods <strong>and</strong> sweep problems in reservoir engineering.Reservoir PressureThe pressure that the reservoir fluids exert on the well at the pay zone is the reservoir pressure. In singlepay completions with little or no rat hole (extra hole below the pay), the reservoir pressure is thebottom hole pressure, BHP. The initial reservoir pressure is the pressure at the time of discovery.Flowing bottom hole pressure is pressure exerted as the result of a drawdown (differential pressureproduced by flowing the well). Shut-in pressure is the stable pressure reached after the well has beenshut in long enough to come to equilibrium. Shut-in pressures are often quoted as a function of time.The initial pressure is usually a function of depth of burial but may be modified by other forces at thetime of burial or at a later time. Driving pressure may be supplied by a number of mechanismsdepending upon the characteristics of the oil <strong>and</strong> the surrounding geologic <strong>and</strong> physical forces. Thegeneral types of reservoir drive forces (to the limit of general interest in well completions) are:1. Solution gas drive - a volumetric displacement where all the driving energy or pressure is suppliedby gas expansion as the pressure is reduced <strong>and</strong> the gas comes out of solution. In reservoirs“above the bubble point”, all the gas is dissolved in the oil <strong>and</strong> there is no free gas. In thesereservoirs, there may be a volume change of the oil as the pressure drops <strong>and</strong> gas breaks out ofsolution. Reservoir pressure decreases with fluid withdrawals.2. <strong>Gas</strong> Cap - a volumetric displacement where the oil is “below the bubble point”, i.e., there is freegas or gas saturation in the pores <strong>and</strong> there may be a gas cap. Reservoir pressure decreaseswith fluid withdrawals.3. Water drive -water influx into the reservoir from edge, bottom or water injection wells can providevery consistent drive pressure to a reservoir. Like the oil, the water moves through the mostpermeable pathways of the formation towards the pressure drop produced by removal of fluids.The water pushes part of the oil in front, entering some of the pores <strong>and</strong> displacing the oil. <strong>Oil</strong>production continues long after the breakthrough of water at the producing well since the formationmay contain a number of streaks that have permeability differences an order of magnitudeor more. Reservoir pressure may remain the same or drop with fluid withdrawals, dependingupon how fast the incoming water replaces the withdrawn fluids.4. Reservoir compression through compaction in poorly consolidated, high porosity reservoirs isalso a “method” of supplying driving energy but it usually generates serious problems in the reservoir.In these reservoirs, which may often be initially over pressured, the reservoir fluids are ai-3
overburden load supporting element. Withdrawal of the fluids requires the matrix of the formationto support more of the load from the overlying sediments (overburden). In some poorly consolidatedor weak formations, the matrix compresses under the load, leading to lower porosity <strong>and</strong> acontinued pressure on the remaining fluids. Although this is a definite form of pressure maintenance,when the porosity is decreased, the permeability also is reduced. Compaction of the payin massive sections may also lead to subsidence of several feet at the surface -- a critical problemfor some offshore rigs <strong>and</strong> sea level l<strong>and</strong> fields.5. Pressure maintenance or sweep projects using water or gas are our methods of increasingrecovery. These processes come with many of the same advantages <strong>and</strong> limitations as their naturalcounterparts.PressuresTo a workover engineer, pressure can be a powerful tool or a nightmare. The difference is in how pressurecontrol is h<strong>and</strong>led. The following "short list" of pressures <strong>and</strong> pressure related terms presents anidea of what <strong>and</strong> how pressures are important to the workover.1. Reservoir Pore Pressure - The pressure of the reservoir fluids, often expressed as a gradient inpsilft. The initial reservoir pressure is the pressure at the time of discovery. Fluid withdrawalsfrom a reservoir are made by lowering the pressure in the wellbore. The flow of fluids toward thelow pressure creates zones of lower pressure or pressure gradients extending into the reservoir.The reservoir pressure can only be measured at the wellbore in a new well or in a well that hasexperienced complete buildup.2. Flowing Bottom Hole Pressure -This pressure is measured at the productive zone during flow. Avalue of flowing bottom hole pressure is usually reported with a flow rate or a choke setting. Achange in the flow rate will change the flowing bottom hole pressure.3. Drawdown - Drawdown is the pressure differential set by the difference of the reservoir pressure<strong>and</strong> the flowing bottom hole pressure.4. Flowing Tubing Pressure - A surface measurement of the pressure in the tubing, prior to thechoke, at a particular flow rate. It is equal to the flowing bottom hole pressure minus the hydrostaticpressure exerted by the fluids in the tubing. Because of entrained gas production <strong>and</strong> gasbreakout as the well is produced, it is rarely possible on liquid/gas producers to accurately calculatethe flowing bottom hole pressure from the flowing wellhead pressure. Only when the compositionof the fluid in the tubing is known can the down hole pressure be calculated.5. Shut-in Surface Pressure - Any pressure measured at the surface immediately after a well isshut-in will change as bottom hole pressure builds up toward reservoir pressure <strong>and</strong> the fluids inthe tubing come to an equilibrium. Surface measured shut-in pressures are useful in some builduptests to assess the productivity of a well.6. Productivity Index - The productivity index is a measurement of well flow potential. It is a termgenerated from a delivery plot of flow rate <strong>and</strong> pressure from a particular well. It is commonlyexpressed as a potential flow rate per pressure drop such as barrels per day per psi. By multiplyingthe PI by the intended drawdown, a flow rate of the well can be predicted. The PI is establishedby test on the well. It changes with time.7. Fracture Breakdown Pressure - A measurement of what pressure is required to hydraulicallyfracture the rock. The breakdown pressure is usually attained from drilling data, breakdowntests, or fracture stimulations. It is usually expressed as a gradient of pressure per unit of formationdepth such as psi/ft.i-4
8. Fracture Extension Pressure -The pressure necessary to extend the fracture after initiation. Likefracture breakdown pressure, it is relevant to a particular well or field.9. Friction Pressure - When fluids are flowed at high rates through a conduit, there is a resistanceto flow caused, at least partly, by friction of the fluids at the boundaries of the conduit <strong>and</strong> by turbulence(mixing) of the fluids. Whether the conduit is pipe or a fracture, friction represents aback pressure. Friction is expressed as pressure at a rate for a unit length of a particular conduit.10. Bubble Point Pressure - In a reservoir that contains an undersaturated oil, there will be no gascap. As the pressure is drawn down, the solution gas will break out of solution. Because of relativepermeability <strong>and</strong> saturation concerns, the occurrence of reaching the bubble point usuallycoincides with a drop in production.Pressure DifferentialPressure differential is probably the most important pressure during drilling, completion, workover <strong>and</strong>production. The differential pressure between the wellbore <strong>and</strong> the formation dictates which directionfluids will move <strong>and</strong> at what rate they will move. Additional controls such as reservoir permeability <strong>and</strong>native <strong>and</strong> injected fluid viscosity also have an affect, as does the presence of solids in the wellborefluid when the pressure differential is toward the formation.In general, drilling pressure differential should be as low as possible to minimize formation damage<strong>and</strong> the amount of fluid invasion from wellbore fluids. However, during any drilling, completion or workoveroperation, the pressure differential must be toward the wellbore (higher pressure in the wellborethan in the reservoir) when well flow is not wanted. Maintaining pressure differential is the same asmaintaining well control. Certain conditions, such as intentional or accidental swabbing caused byswab cups or large-diameter tools, can create low pressures at the bottomhole, even with a column ofhigh pressure fluid above the swab or tool. It is the rate of movement <strong>and</strong> the diameter differencebetween the object in the hole <strong>and</strong> the inside of the hole itself that determine the swab or underbalanceloads. Each step of a drilling, completion or workover operation, particularly when tools or equipmentare removed from the hole, should be examined to determine if swab loads can unbalance thepressure differential <strong>and</strong> swab fluids into the wellbore.During production, pressure differential toward the wellbore is essential for fluid flow. Columns ofst<strong>and</strong>ing liquids, excessive backpressures or large amounts of solids in the fluids in the wellbore willact as a check valve, severely limiting production flow into the well.The study of pressure differential <strong>and</strong> pressure drop is commonly done using a nodal analysis program.These programs compute pressure drops <strong>and</strong> backpressures on a system, <strong>and</strong> help identifythose points that may be bottlenecks to good production practices. There are many instances of wells,some even with large-diameter tubing where the tubing has been found to be a “choke” on the productionfrom the well. Changing out the tubing to a larger size in many cases has doubled production froma high capacity well.Well TemperatureThe reservoir at static conditions has a shut-in or reservoir temperature that is characteristic of thedepth times the geothermal gradient for that area. A 13,000 ft deep reservoir in one part of the worldmay have a bottom hole temperature of 1 6OoF, while a similar depth reservoir in a hotter geothermalarea may be 360°F.As the well flows, the bottom hole temperature will drop depending on the type <strong>and</strong> amount of gas <strong>and</strong>the pressure drop. The cooling is produced by the expansion of gas. Temperature reductions lowenough to freeze water may form ice or “hydrates” in some gas wells while wells with a smaller ratio ofgas to liquids will flow hot to surface.i-5
Fluid PropertiesThe composition of the fluid in the formation, at various points in the tubing <strong>and</strong> at the surface havemajor affects on the performance of the well <strong>and</strong> the selection of production equipment. The followingterms are required knowledge to describe the fluid <strong>and</strong> their changing nature.1.2.3.<strong>Gas</strong>-oil-ratio, GOR, the amount of free gas associated with the oil production. The gas may ordinarilybe in solution or free gas as in a reservoir with a gas cap. When the gas volume isexpressed as a function of the total liquids, the value is the gas-liquid-ratio, GLR. Wells withGLRs above 8000 are considered gas wells, while those with a GOR less than 2000 are labeledoil wells. The wells in between 2000 <strong>and</strong> 8000 are combination wells. The actual GOR value isusually measured at the surface, its value downhole changes with pressure.Water-oil-ratio, WOR, is the amount of water being produced in ratio to the oil production.Bubble point refers to the pressure that a free gas phase will form in an undersaturated oil. Thesignificance is the addition of another phase that, most likely, will lower the relative permeability.4.Dew point is the pressure <strong>and</strong> temperature at which the light hydrocarbon gases, Cs-C,,condense into a liquid. The addition of another phase will lower relative permeability.begin to5.Cloud point is the temperature in an oil system where paraffin crystals appear (cj8 + fractionbegins to solidify).6.Pour point is the temperature below which the oil will no longer pour.High Temperature <strong>and</strong> High Pressure WellsWells with pressures over 0.6 psi/ft <strong>and</strong> temperatures over 300°F are often referred to as HTHP wellsor high temperature, high pressure wells. These wells account for less than 1% of the total wellsdrilled, but may cost 5% or more of the total expenditures for drilling <strong>and</strong> completions. The risk, reward<strong>and</strong> cost can all be very great in these types of wells. Very special workover <strong>and</strong> completion operationsare necessary to adequately complete <strong>and</strong> produce these wells.i-6
Introductions GeologyThe geologic underst<strong>and</strong>ing of the pay <strong>and</strong> the surrounding formations plays an important part in thedesign of well completions <strong>and</strong> stimulations. The brief introduction given here will only give a glimpseof the subject matter in the field. This treatment of geology is very simplistic; reference articles <strong>and</strong>books are available for every segment.The type of formation, composition, strength, logging basics, leakoff sites <strong>and</strong> other parameters maybe available from a detailed geologic investigation. This information is useful for pay zone identification,fluid <strong>and</strong> additive selection, longevity of fluid contact, <strong>and</strong> selecting casing points.There are several major classifications of rocks of interest to the petroleum industry: s<strong>and</strong>stones, carbonates(limestone <strong>and</strong> dolomite) evaporites, <strong>and</strong> shales are only the major groups. Several others,such as mudstones, siltstones <strong>and</strong> washes, are subdivisions of the major classifications.S<strong>and</strong>stones are predominately silicon dioxide <strong>and</strong> may have various amounts of clay, pyrite, calcite,dolomite or other materials in concentrations from less than 1 % to over 50%. S<strong>and</strong>stone formationsare generally noted for being a collection of grains. The grain size may range from very small, siltsized particles (5 microns) to pea size or larger. The grains fit together to form a matrix that has (hopefully)some void space between the particles in which oil or other fluids may accumulate. The grainsare usually held together by a cement that may be clay, silica, calcite, dolomite, or pyrite. Somecementation of the grains is critical for formation strength; however, excess cementation reducesporosity <strong>and</strong> permeability.S<strong>and</strong>s are deposited in a variety of depositional environments that determine the initial sedimentkockproperties. The depositional environment is simply what type of surroundings <strong>and</strong> forces shaped thedeposits. In the following descriptions of depositional environment, the energy level is labeled aseither high or low depending upon the level of force that accompanied the deposition of the sediments.High energy deposits are those with sufficient wind or current to move large pieces of debris while lowenergy is sufficient to move only the smaller particles. The importance of energy is described later.Common depositional environments are:1.Deltas - These mouth of river deposits provide some of the larger s<strong>and</strong>stone deposits. Becauseof the enormous amount of natural organic material swept down the river systems, the deltas arealso rich in hydrocarbons. Quality of the reservoir rock deposits may vary widely because of thewide variations in the energy level of the systems.2.Lagoonal deposits - May be regionally extensive along the shores of ancient seas. Lagoonaldeposits are low energy deposits that are hydrocarbon rich. Permeability may vary with theenergy <strong>and</strong> amount of silt.3.4.Stream beds - A moderate to low energy deposit with some streaks of high energy along the fastflowing parts of the streams. Stream beds are known to w<strong>and</strong>er extensively <strong>and</strong> chasing thesedeposits with wells requires very good geologic interpretation, plus a lot of luck. The deposit volumesare also limited <strong>and</strong> frequently deplete quickly.Deep marine chalks - These are often the most massive deposits available, built up at the bottomof ancient seas by the death of millions of generations of plankton-sized, calcium fixingorganisms. They can be very consistent, thick deposits. Natural fracturing is common.5.Reefs - These formations were built in the same manner as the reefs of today, by animals thattake calcium from the sea water <strong>and</strong> secrete hard structures. Because of the cavities remainingfrom the once living organisms, reefs that have not undergone extensive chemical modificationare among the most permeable of the carbonate deposits.ii- 1
6. Dunes - The effects of desert winds on the s<strong>and</strong>s have a shaping effect that can be seen in thearrangement of the grains. These deposits may be massive but are usually lower energy. Permeabilitymay vary considerably from top to bottom.7. Alluvial fan - Zones of heavy water run-off such as from mountains are extremely high energyrunoffs. Common constituents of these formations may range from pebbles to boulders <strong>and</strong>cementation may be very weak. Formations such as the granite washes are in this classification.8. Flood plains - Occur along lower energy rivers <strong>and</strong> form during flood stages when the riversoverflow the banks <strong>and</strong> spill into adjacent low areas. Flood plain deposits are mostly silt <strong>and</strong>mud.The level of energy with each type of deposit can be visualized by their modern depositional counterparts.The importance of energy is in the sorting of the grains <strong>and</strong> the average size of the grains. Asseen in the description of permeability in the preceding section, a rock with larger grains <strong>and</strong> theabsence of very small grains leads to high permeability. When small grains are present, the permeabilityis much lower. When there is a mixture of the very large <strong>and</strong> very small grains, such as in somealluvial fans, the permeability can be very low. The extent of grain differences in a formation is termedthe “sorting”, with well sorted formations having similar sized grains <strong>and</strong> poorly sorted formationsshowing a very wide size range.The events that happen after the deposit is laid down are also factors in well completions <strong>and</strong> mayhave a devastating effect on reservoir engineering. Some of these forces are active for a short periodin geologic time such as faulting <strong>and</strong> salt domes, <strong>and</strong> others like salt flows <strong>and</strong> subsidence, are activeduring the productive life of the well. The faulting, folding <strong>and</strong> salt movement make some reservoirsdifficult to follow. Continuous forces are often responsible for formation creep in open holes, spalling,<strong>and</strong> casing sticking <strong>and</strong> collapse problems. Although these geologic movement factors cannot be easilycontrolled, the well completion operations can be modified to account for many of them, if the problemsare correctly identified early in the project life.Chemical modifications also influence the reservoirs, though much less drastically than the upliftforces of a salt dome, for example. Most carbonates (not including the reefs) are laid down by accumulationof calcium carbonate particles. Limestone may recrystallize or convert to dolomite by theaddition of magnesium. Because the limestone is soluble in ground water <strong>and</strong> very stable (resistant tocollapse), the limestones are often accompanied by locally extensive vugs or caverns which form fromground water flow. Recrystallization or modification by the water as is flows through the rock may alsolead to a decrease in porosity in some cases.When dolomite forms, a chemical process involving the substitution of magnesium for part of a calciumin the carbonate structure generally shrinks the formation very slightly, resulting in lowermicroporosity but slightly higher porosity through the vugs or the natural fracture systems. Other typesof dolomitization are possible. The carbonates are marked by a tendency towards natural fractures,especially dolomite. The chalk formations may be almost pure calcium carbonate, are reasonably soft(low compressive strength) <strong>and</strong> may have very high porosities on the order of 35-45%, but relativelylow permeabilities of less than, typically, 5 md.The third formation of interest is shale. These formations are laid down from very small particles (poorsorting) that are mixed with organic materials. The organic material is often in layers, pools, or ebbs.The shales may accumulate in deep marine environments or in lagoonal areas of very low energyresulting in almost no large particles being moved. The shales are marked by high initial porosity <strong>and</strong>extremely low permeability. Shales often serve as a seal for permeable formations. The shales arealso extremely important, since they are the source for the oil that has been generated in many majorplays. <strong>Oil</strong> leaves the shale over geologic time <strong>and</strong> migrates into the traps formed in s<strong>and</strong>stones, limestones<strong>and</strong> other permeable rocks.ii-2
The evaporites are deposits that are formed by the evaporation of water. Deposits such as anhydriteare usually accumulations of dried inl<strong>and</strong> seas <strong>and</strong> serve as extensive local geologic markers <strong>and</strong>sealing formations. They are extremely dense with almost no porosity or permeability.When a deposit of oil <strong>and</strong> gas is found, it usually has its origins elsewhere <strong>and</strong> been trapped in a permeablerock by some sort of a permeability limiting trap. The trapping mechanism is too extensive tobe covered in a short explanation on geology, but the major traps are outlined in the following paragraphs.1. Trapping by a sealing formation is common <strong>and</strong> accounts for some major fields. These occurrences,called unconformity traps, are where erosion has produced a rough topography withpeaks <strong>and</strong> valleys. Like the rolling terrain of the surface, most formations are rarely flat; theyhave high <strong>and</strong> low points <strong>and</strong> may have a general rise in a direction. If an extensive sealing formationis laid down in top of the s<strong>and</strong>stone (or other pay), <strong>and</strong> the s<strong>and</strong> is exposed to migratingoil from a lower source over geologic time, the oil will accumulate in the higher points of the pay<strong>and</strong> trend “uphill” toward the point where the hill drops off or another sealing event stops themigration. Tracking these deposits is best accomplished with as complete a structural map ascan be constructed. These maps of the formations highs <strong>and</strong> lows compiled from seismic <strong>and</strong>drilling data indicate the better places to drill a well -- small wonder that the maps are among themost closely guarded secrets of an oil company.2. Faulting is an event that shifts a large block of the formation to a higher or lower position. Themisalignment of the zones often provides contact with sealing formations <strong>and</strong> traps the hydrocarbon.There are several types of faulting depending on the action <strong>and</strong> movement of the rock. Inareas of extensive tectonic plate movements, faulting may be extensive.3. Folding is an uplift or a drop of part of the formation where the breaks associated with faults donot occur. The formation maintains contact with itself, although it may form waves or even beturned completely over by the event. Complete turnover is seen in the geologic overthrust belts<strong>and</strong> accounts for the same formation being drilled through three times in one well, with the middlecontact upside down. Vertical wells directly on the fold will penetrate the formation horizontalto the original plane of bedding. Although these wells offer increased local reservoir quantitywhen they are productive, the problems with directional permeability <strong>and</strong> sweep in a flood areoften substantial.4. Salt domes cause uplift of the formation <strong>and</strong> result in numerous small or large fields around theirperiphery. Faulting is often very wide spread. Brines in these areas are frequently saturated oroversaturated <strong>and</strong> evaporated salt formations, stringers <strong>and</strong> salt-fill in vugs are common.Because of the uplift of some formations from deeper burial, the productive formations may beover pressured.5. Stratigraphic traps (permeability pinchouts) are a change in the permeability of a continuous formationthat stops the movement of oil. These deposits are very difficult to observe with conventionalseismic methods. This effect, combined with a sealing surface to prevent upwardmovement of fluid forms numerous small reservoirs <strong>and</strong> a few massive ones. Permeability pinchoutmay also explain poor well performance near the seal. Laminated beds with permeables<strong>and</strong>s s<strong>and</strong>wiched between thin shales are a version of the pinchout or stratigraphic trap. Thesedeposits may be locally prolific but limited in reservoir <strong>and</strong> discontinuous. Linking the s<strong>and</strong>s isthe key to production.The age of a formation is dated with the aid of fossils which are laid down with the matrix. The age ofa formation is important to know if the formation has a possibility of containing significant amounts ofhydrocarbon. In most cases, very old formations such as the pre-Cambrian <strong>and</strong> Cambrian containvery little possibility for hydrocarbons unless an uplift of the structure has made the formation higherthan an oil-generating shale, <strong>and</strong> oil has migrated into a trap inside the formation.ii-3
Formation Sequences <strong>and</strong> LayeringFormations are almost never homogeneous from top to bottom. There is a considerable amount ofvariation, even in a single formation, between permeability <strong>and</strong> porosity when viewed from the top ofthe zone to the bottom. When formations are interbedded with shale streaks, they are referred to as alayered formation. The shale streaks, often laid down by cyclic low energy environments, may act asseals <strong>and</strong> barriers <strong>and</strong> form hundreds or thous<strong>and</strong>s of small isolated reservoirs within a pay section.Many times, the layering is too thin to be spotted by resistivity or gamma ray logs. When a formation isknown to be layered, the completion requirements change. Perforating requirements may rise fromfour shots per foot to 16 shots per foot, <strong>and</strong> in many cases, small fracturing treatments may prove verybeneficial even in higher permeability formations.ii-4
duction of reservoirs. Commingling of zones should be done when permitted by pressures <strong>and</strong> reactantsthat may form by mixing waters or oils of various zones.Physical well design parameters should have been dictated by the expected producing behavior of thewell. Sizes of tubing <strong>and</strong> casing are set before the drilling bit selection process. During the tubulardesign, the use of pup joints (short joints of casing to improve depth control of perforating <strong>and</strong> otheroperations), nipple locations, <strong>and</strong> the use of special equipment in a string, such as subsurface safetyvalves that require larger casing, are needed early in the design phase of the well. In most cases, it isadvisable to minimize the number of restrictions in a producing string to make sure needed tools canpass through the string <strong>and</strong> to prevent deposits that are often caused downstream of a flow restriction.Cementing operations should be carefully planned <strong>and</strong> applied to eliminate channeling of fluid. Toooften it is assumed that the primary cement job will be a failure before the job is even pumped. Thistype of thinking leads to a haphazard placement of cement <strong>and</strong> a self-fulfilling prophecy requiringexpensive squeeze cementing. It has been shown in a number of tests that proper quality control <strong>and</strong>attention to detail can result in effective primary cementing jobs.Perforating planning is an area that could definitely use attention during both planning <strong>and</strong> application.A variety of processes <strong>and</strong> tools are available from underbalanced to extreme overbalanced perforating<strong>and</strong> from wireline perforating to tubing conveyed perforating. Perforating expense can run from afew thous<strong>and</strong> dollars to over one hundred thous<strong>and</strong> dollars, depending on the needs of the well <strong>and</strong>the care with which it is designed. Expensive techniques are by no means always needed.The type of artificial lift that will be used on the well should have been decided long before the wellwas drilled. A number of artificial lift methods are available: gas lift, beam lift, plunger, jet lift, progressivecavity pumps, electric submersible, <strong>and</strong> natural flow. Of these lift methods, beam lift, gas lift, <strong>and</strong>electric submersible pumps probably make up at least 98% of the artificial lift cases. Many wells thatare on natural flow early in their life have to be artificially lifted as pressures decline or as fluid volumesincrease to the point where gas drive <strong>and</strong> natural gas lift are no longer sufficient. The ability tochange lift methods as fluid volumes increase or decrease is required for well operation optimization.If the casing <strong>and</strong> packer are designed with a conversion in mind, the switch of lift systems is easy.Some formations have special needs, such as s<strong>and</strong> control. When the strength of the formation is notadequate to prevent s<strong>and</strong> grains from being dislodged by the drag forces encountered in production,then special completion techniques are needed to prevent the s<strong>and</strong> from entering the wellbore. Anumber of techniques have been tried, with resin consolidation of the s<strong>and</strong> <strong>and</strong> gravel packing beingthe primary control mechanisms. The real concern in most s<strong>and</strong> control jobs is not what type of control,but whether s<strong>and</strong> control is needed <strong>and</strong> when it is needed. The factors that cause s<strong>and</strong> movementchange during the lift of the well. Some wells that will not experience s<strong>and</strong> production until afterwater breakthrough are gravel packed from initial completion. This is a large initial expense that can,in some cases, be delayed.Produced fluids including oil, gas, water <strong>and</strong> returning injected fluids are all reactable fluids. In addition,the well is a reactor when these fluids are moved through the well path. Conditions within this“reactor” include temperature, pressure, pressure drop <strong>and</strong> other factors such as metallurgy <strong>and</strong>clearances within the structure of the well. When the well flow path from formation to tank battery iscorrectly designed for the flow of a particular fluid, the detrimental reactions are very few. But whenthe well design is not suited to the particular fluids that must be produced, a “problem well” is oftencreated. Produced fluids are a reactant-rich %oup” composed of natural surfactants in both the oil <strong>and</strong>the water, free <strong>and</strong> dissolved salts, hydrocarbons with carbon chain links from C, to Cso, dissolved<strong>and</strong> free mineral <strong>and</strong> hydrocarbon gases, bacteria, micelles, <strong>and</strong> over 20 possible combinations ofemulsions, foams, froths, <strong>and</strong> dispersions controlled <strong>and</strong> stabilized by such things as pH, viscosity,internal phase concentration, <strong>and</strong> surface energy. When an upset occurs, the panic that ensues usuallyrequires a quick fix. When the tank battery goes down because of a tank of “bad” oil (oil with ahigher than allowable water content), chemical treating is usually required as an emergency procedureto reduce the water content <strong>and</strong> return the well to production. The total chemical approach maybe short-sighted in some instances, particularly when production upset symptoms are treated in aiii-2
cyclic manner. The best approach often requires an underst<strong>and</strong>ing of the individual reactants <strong>and</strong> theirrelationship to both each other <strong>and</strong> their flow path environment. Often problem wells will yieldimprovements only when physical changes are made in the well design. Numerous instances areavailable that show chronic production upset problems being eliminated when physical changes weremade to the well architecture.An underst<strong>and</strong>ing of production chemistry is a critical factor in designing the downhole <strong>and</strong> surfaceequipment that makes up the well’s system. The approaches that must be used are much the same asinitial design; however, the knowledge that liquid <strong>and</strong> gas volumes, relative amounts <strong>and</strong> pressure willchange over the life of a project. Thus, some flexibility must be built in to achieve a low maintenancewell system.In general, several steps are followed when evaluating <strong>and</strong>/or designing a well system.1. Most emulsions, including emulsions, sludges, froths, foams <strong>and</strong> dispersions, are most troublesomebecause of energy input <strong>and</strong> a stabilizing mechanism. By eliminating one or both of thesetwo factors, a significant decrease can be attained in problems with phase separation. The liftsystem <strong>and</strong> pressure drops within the flowing system are the chief inputs of energy into an emulsion.2. Upsets following acidizing or any type of chemical treating may be severe <strong>and</strong> are generallybased either on a solid material added with the chemical injection or by a variance in pH whichaffects the behavior of natural surfactants. Tracking <strong>and</strong> controlling pH can often be a significantfactor in eliminating problems with upsets.3. Production of solids from a well creates problems with emulsion stabilization, solids abrasion<strong>and</strong> all types of fluid separation. Where possible, flow of solids should be identified <strong>and</strong> thesource minimized.The lift system must be designed for the expected rate after a stimulation <strong>and</strong> must take into account therecovery of the stimulation load fluid plus the method with which it commonly flows back. The most severeproblems in these areas generally include hydraulic fracturing <strong>and</strong> acidizing. Once an acid job has begunto flow back, the pH may drop, significantly affecting the amount of corrosion during the load fluid recoverystage. Jobs involving proppant fracturing often give problems because of proppant flowback in the producedfluids during the initial stage of fluid flow.In old wells <strong>and</strong> in marginal wells there is probably no stronger need than that of consideration of producedwater control. Water comes in as a response to low pressure caused by hydrocarbon production.There may be many scenarios of water production. In some cases water drives the hydrocarbonstoward the wellbore. If you shutoff the water, you will reduce the hydrocarbon production volume. Inother cases leaks through bad cement, corroded casing, or through fractures can flood the well withextraneous water. In these cases a water control treatment is often useful. Where bottom water driveis severe, horizontal wells have often been used to successfully produce hydrocarbon without severewater production problems. Each of these possibilities can be addressed in the initial well plan.iControl of corrosion is needed throughout the life of the wells. In many applications the well will havea very low corrosivity when first drilled, but the corrosion rate will go up significantly during the life of awell. In many wells, the original casing lasts 20 or more years before leaks are detected. Repair maybring temporary relief, but leaks may often return within a few months. Special inhibitor programs areneeded as well conditions change.Formation damage has been mentioned in earlier paragraphs, <strong>and</strong> it is well to remember that formationdamage may recur during the life of the well. The most prevalent times for formation damageoccurrence are during workovers <strong>and</strong> when pressure declines or water from a floodfront causes precipitationof either organic or inorganic components in the formation or in the tubing string. Modelingcan often show a trend of formation damage <strong>and</strong> its effects, but the actual occurrence of formationiii-3
damage can probably not be adequately predicted by any model without very exacting knowledge ofwell behavior.The occurrence of formation damage or drilling of a formation that is lower permeability than expectedmay require stimulations. Stimulations, including fracturing, acidizing, heat, <strong>and</strong> solvents, can beapplied on almost any well provided that the support equipment <strong>and</strong> the tubulars will allow the techniquesto be implemented. If formation damage or stimulation need can be adequately forecastedearly in the life of the well then cost reduction is often possible.For projects where enhanced recovery is envisioned, well placement <strong>and</strong> spacing become critical. Inthese applications the use of horizontal wells, deviated wells, <strong>and</strong> vertical wells are necessary to adequatelyprocess <strong>and</strong> sweep the reservoir. It is unfortunate that we know enough about reservoir toadequately place wells only when the reservoir is nearing depletion. With new techniques however,such as well-to-well seismic <strong>and</strong> 3D seismic, improved mapping of the reservoir if possible. This typeof investigation may also yield additional pay zones <strong>and</strong> how those pay zones can be accessed.Every well that is ever drilled will require plug <strong>and</strong> ab<strong>and</strong>onment. The techniques for plugging ab<strong>and</strong>onment<strong>and</strong> the rules are many <strong>and</strong> varied. The underlying objective however is very plain. Wellsshould be plugged in a manner in which the fluids that are in the reservoirs will stay isolated. Thisneed for isolation should be an overriding concern in any completion planning <strong>and</strong> must be accountedfor when processes such as fracturing or well placement are considered.iii-4
Chapter I:Drilling the Pay, Selecting the Interval <strong>and</strong>the Initial DesignThe completion begins when the drill bit first penetrates the pay. Drilling the pay zone is one of themost important parts of the drilling procedure, thus drilling mud that is adequate for drilling the rest ofthe well may not be acceptable in the pay. Whereas formation damage created by the mud is acceptablein a nonproductive interval, it cannot be tolerated in the pay zone. What is needed is a mud thatcan control leakoff without creating permanent damage. The mud may require special treatment <strong>and</strong>occasionally, a changeout of the mud to a nondamaging fluid. There are several goals in drillingbesides well control that are of interest to the completions engineer.1.Drill a usable hole - A hole through the pay that will not accept the design size of casing limits thepossibilities of the well <strong>and</strong> may impair the productivity.2.Minimize formation permeability damage - High drilling mud overbalance pressure, uncontrolledparticle size, mud filtrate that swells clays <strong>and</strong> poor leakoff control may mask the response of aproductive formation to a drill stem test (DST) <strong>and</strong> may lead to bypassing a producing zone.3.Control washouts - Hole stability problems may cause hole enlargements that make perforation<strong>and</strong> formation breakdown much more difficult.From a drillers viewpoint, there are five main functions of a drilling mud:’ pressure control, bit lubrication,shale stability, fluid loss control <strong>and</strong> cuttings retrieval. The most important aspects of a drillingmud from a formation damage st<strong>and</strong>point are to prevent loss of the drilling mud filtrate <strong>and</strong> to makesure that the filtrate that is lost will not react with the formation to reduce permeability. Fluid reactivityis usually controlled by using potassium chloride or other salts to stabilize the clay in the formation.2Potassium chloride may not always control clay reactions or may require as much as 4% or more saltwhere smectite clay is present in the larger pore passages. Fluid loss control is accomplished by rapidlysealing off the permeable sections of the formation^.^^^ The mud accomplishes this fluid loss controlby creating an almost impermeable mud cake of particles on the surface of the formation whereleakoff occurs. The mud cake is produced by simple dehydration; as the liquid penetrates into the formation(the mud filtrite), the solid particles are str<strong>and</strong>ed on the surface of the formation. In a properlyformulated mud, there are a wide range of particle sizes that, on dehydration, fit together into a tightlycompacted, very low permeability seal. By carefully controlling the size range of particles <strong>and</strong> minimizingthe clay size particles that could invade the pores of the formation, invasion damage from particlescan be stopped. 4-7 In some drilling <strong>and</strong> workover fluids, fine particles <strong>and</strong> at least parts of the solids inthe fluids will be designed to be acid soluble.8The time required to form the mud cake will depend upon the mud characteristics, the permeability<strong>and</strong> the pressure differential, (Must be toward the formation for well control!) A higher permeability formationwill generate a mud cake very rapidly than a low permeability formation since the rate of initialfluid loss (spurt) is higher. After the mud cake is formed, further liquid losses depend on the permeabilityof the cake. Formation of a cake does not insure that leakoff stops.In cases where the formation matrix permeability is between approximately 0.5 md <strong>and</strong> 100 md <strong>and</strong>the pressure differential toward the formation is small (APc1 00 psi), the filtrate of even a damagingmud will not likely extend into the formation beyond a depth of a few inches provided that the filtercake is successful in controlling leakoff. To build a successful mud cake, there must be leakoff. If thepermeability is very low (e.g., kc0.05 md), the filter cake may be only poorly formed <strong>and</strong> fluid losscould be much higher than expected. This is especially true when the pay is an upper formation in adeep well where a high density mud is used <strong>and</strong> the formation is exposed to the mud for a long periodof time. Fortunately, most very low permeability formations require fracture stimulation, so the zone ofdamage is easily bypassed. The occurrence of the damage is important, however, since a productiveinterval might be missed on a test of an unstimulated well. The higher permeability formations posespecial problems if the mud cake cannot be formed quickly. Since every trip out of the hole scrapes off1-1
much of the protective mud cake, the cake must reform easily to prevent the loss of large volumes ofmud filtrate into the formation. Tell-tail identifiers of a permeable formation are deflections on the SPlog, bit drag <strong>and</strong> where the caliper log shows a narrow spot of slightly less than the bit diameter. Thissticking point should not be confused with borehole deformation; a plastic flow of the rock in responseto bore hole deformation, active faulting, folding, salt domes, etc.l5The depth of damage created by the filtrate of the mud is directly related to the amount of driving pressurethat the mud exerts on the formation. Even with a high quality mud, damage can be very deep ifthere is high mud overpressure. When high pressure zones elsewhere in the hole require the use ofhigh pressure on the mud system, lower pressure zones are forced to take fluid by the pressure differential.This situation becomes critical when a zone that may be pay is broken down <strong>and</strong> fractured withthe mud. Several hundred barrels of mud can be lost when the well is fractured. Some wells damagedin this way never produce as expected. The only safe way to prevent this type of fluid loss from occurringis to case through the zones requiring high mud weights before the pay zones are drilled. Improvingthe filter cake <strong>and</strong> making the mud filtrate more compatible with the formation is one of the bestmethods of controlling formation damage. The use of inhibited filtrate prepared with potassium chloride(such as 2% KCI) will often minimize the formation damage in pays with even water sensitives<strong>and</strong>stones.In formations that are sensitive to fluid, the total time that the sensitive zone is exposed to mud maybe critical. Once a section of the well that is known to be sensitive is penetrated, operations shouldcontinue as quickly as possible until casing can be cemented over the zone. This treatment is usuallyreserved for sections of caving shale or other unstable formation; however, it may also be used verysuccessfully in drilling pay zones that are water sensitive. If loss of permeability is plotted againstaccumulative fluid loss from the mud, permeability damage increases very steadily as total fluid lossincreases, almost regardless of the type of fluid. This emphasizes the importance of maintaining ahigh quality mud <strong>and</strong> lowering the exposure of the formation to fluid loss.Most of the solids <strong>and</strong> cuttings from the mud are halted at the formation face <strong>and</strong> very little penetrationoccurs unless a poorly designed mud with a large amount of clay or silt sizes particles are used in aformation with large pore throats. The damage from these solids is most apparent in the form of formationface plugging. Movement of the solids into the formation is dependent on the size of the pores,particle size <strong>and</strong> quantity of the finest solids in the mud. Although some tests have shown several centimeterpenetration of fine mud particles into high permeability ~<strong>and</strong>stone,~ a properly conditionedmud will probably not invade the formation.If the formation has rubble zones (very poorly sorted grains with sizes that may range from fines tosmall boulders), very permeable porous sections, fractures or vugs, then severe whole mud penetrationmay occur <strong>and</strong> produce lasting formation damage. It is very advantageous to design the mud orcompletion fluid to bridge off on the face of the formation to prevent the possibility of particle invasion.When the mud or kill fluid cannot be circulated, the formation has a lost circulation zone that has veryhigh permeability or cannot support the weight of the mud column without fracturing. For these problemcases, special pills of LCM, lost circulation material, are often run to plug off the high permzonesg Where the formation will not support the mud column, a cement sheath is often tried to reinforcethe zone. After setting a cement plug, the hole is redrilled. The cement invades fractures <strong>and</strong>vugs, adding strength <strong>and</strong> controlling leakoff. One problem with lost circulation material (LCMs) casesis that drillers use a variety of LCMs, such as paper, sawdust, leather, grain, etc., that are very effectivein preventing leakoff but cannot be removed if the zone is a pay zone. Any LCM used in a potentialpay must be easily removable.The decision on whether a mud system should be changed before the pay is drilled depends upon thesensitivity of the pay to the mud filtrate. If the formation contains swellable clays such as smectite, afiltrite sensitivity test on core from an offset well will tell whether the formation is damaged by introductionof the mud filtrate. Where core is not available, a mud with a low damage potential (potassiumchloride) should be considered. Smectite clay in the pore throats is usually reactive to fresh fluids, upto 5% or more KCI is sometimes needed to prevent clay problems in formations that have 3 to 8%smectite. In gas zones, the use of most oil-based muds should be avoided unless the mud has beenproven to be of a nondamaging nature in the zone of interest. In oil or gas zones that are to be frac-1-2
tured, less emphasis is placed on the mud damage at the wellbore since a fracture will extend beyondthe damage.When natural fractures or vugs are present in the pay, whole mud can be lost. In these situations, it isoften necessary to set a casing string above the pay <strong>and</strong> drill the formation without returns or use afluid loss control additive capable of sealing fractures at the wellbore. Other methods, such as drillingthe well while flowing <strong>and</strong> diverting the produced fluids, have also been considered but are dangerousin high pressure formations.Because of damage by both incompatible filtrate <strong>and</strong> the migration of very small particles in the mud,the completion zone in many wells has been drilled with completion fluid. This practice eliminatesmuch of the damage from mud <strong>and</strong> mud filtrate. The basic problem with the process is in completelycleaning the hole <strong>and</strong> pipe of residuals from the mud so that the left-over mud <strong>and</strong> cuttings do not contaminatethe completion fluid. Fluid loss from solids free systems may be very high, especially in highpermeability formations.In very sensitive pay zones, the wells are often drilled with mud to the top of the pay <strong>and</strong> the pay itselfis drilled with air, mist or foam to reduce the amount of water in contact with pay. Another method ofreducing formation damage is to drill the pay with reverse circulation. This approach has been used insensitive formations to limit the contamination of the mud by drill cuttings. Regardless of the formationsensitivity, well control must always be the Number 1 priority.The importance of drilling a usable hole through the pay <strong>and</strong> its importance on running <strong>and</strong> cementingpipe cannot be overstated. Failure to get a casing string or a liner to bottom can be very costly interms of cost of an additional string or liner <strong>and</strong> the reduction of working space where pumps <strong>and</strong>other equipment need to be set. Simply drilling a hole with a certain diameter drill bit through a formationdoes not lead to a hole that will accept a string of pipe of an outside diameter just smaller than thedrill In most instances where casing cannot be run in a freshly-drilled hole, the problem is thata usable hole has not been drilled, i.e., the drift diameter of the hole is not equal to the bit diameter.This problem is shown schematically in Figures 1.1 <strong>and</strong> 1.2. Figure 1.1 illustrates problems with hardledges or changes in formation, while Figure 1.2 shows an extreme case of bit wobble. The spiral holeillustrated in Figure 1.2 was caused by an under-stabilized bit creating a hole too small to run theplanned casing. Normally, casing strings are run with 1-112 to 2 in. minimum clearance between thehole diameter <strong>and</strong> the outside diameter of the pipe. In a straight hole, this is adequate clearance, butin a hole with an incorrect BHA (bottomhole assembly of drilling bit, collars, <strong>and</strong> stabilizers), problemswill develop during running of the pipe. Drilling “slick” (drill collars in the BHA without stabilizers) usuallyleads to a hole with a usable diameter significantly less than the diameter of the drill bit. Estima-tion of this usable hole or drift diameter is:’2Figure 1.1:(after Woods, from Adams)Abrupt change in hole angle caused by drilling with anunstabilized bit through hard ledges.Drift diameter =Bit OD + Collar OD21-3
Rm mvded by lap d bit(after Wilson, from Adams)Figure 1.2:A spiral hole caused by an unstabilized bit.The formula points out that the usable diameter of the hole may be smaller than the bit. If the hole hasbeen drilled with the intention of running a liner, the problem may be even more pronounced. Linersare usually characterized by close tolerances between the pipe <strong>and</strong> the hole, thus it is essential thatgood hole diameter stability be maintained.The type of drilling mud may also make a difference in getting pipe to the bottom. Differential stickingis caused by a pressure differential into a permeable zone that holds the pipe (or logging tool) againstthe wall <strong>and</strong> buries the lower side of the pipe in the mud cake.14 Sticking is increased by thick mudcakes because of increased contact area, Figure 1.3. An efficient mud forms a thin, slick mud cakewith very low permeability. A thin mudcake keeps the pipe from becoming deeply embedded, resultingin less torque <strong>and</strong> drag.14 The goal is a high colloidal clay-to-silt (or cuttings) ratio that produces aslick, thin cake.Figure 1.3:Differential sticking caused by thick, spongymudcake. The pipe is held against the mudcakeby pressure differential.1-4
Diagnostics of stuck casing are often made after examining the drilling record <strong>and</strong> trying differenttypes of pipe movement <strong>and</strong> circulation. A simple, stuck pipe diagnostic routine is shown schematicallyin Figure 1.4.14(Adarns)Figure 1.4:Top Left: Differential sticking-pipe held on wall by inward driving pressure. Pipecannot move, but circulation is possible.Lower Left Bridging from formation debris, cuttings or formation movement.Pipe movement usually not possible. No circulation.Right: A key seat through a dog leg. Pipe can be rotated <strong>and</strong> either pushed downor pulled up until a collar is reached. Circulation is possible.Calculating the true vertical depth, TVD, from the measured vertical depth, MD, can be accomplishedfor consistent deviated wells from simple trigonometry or from tables. When wells use long turn radii,other corrections may be needed.During drilling of wildcats or field development wells in sparsely drilled areas, mud density is h<strong>and</strong>ledas a function of well control, with pore pressures estimated from other data. In this type of environment,high mud overbalance conditions may occur, especially in deep formations. Although fracturingis the most obvious effect of high mud weights, excess formation permeability damage may alsooccur. In a study of factors influencing stimulation rates, Paccaloni, et al.,16 reports that in formationsgreater than 100 md, 90% of DST's were dry or doubtful when an overbalance of over 11 00 psi wasused during drilling. Excessive mud overbalances should be avoided in pay zones.1-5
Coiled Tubing DrillingIn addition to jointed pipe drilling, coiled tubing (see Chapter 18 for Coiled Tubing Equipment <strong>and</strong>Techniques) can also be used for drilling <strong>and</strong> milling in some applications. Coiled tubing offers severaladvantages <strong>and</strong> a few current disadvantages that should be explored for their potential in completions<strong>and</strong> workovers. One of the best uses of coiled tubing drilling may be in combination with underbalanceddrilling “where the well is allowed to flow during the drilling operation.”The simplest coiled tubing drilling bottomhole assembly (BHA) includes a bit, mud motor, stabilizers orcollars, the connector <strong>and</strong> the coil. The abilities of coiled tubing for drilling include a continuously fedfluid transfer mechanism (the coil) with no tool joints. This one feature allows the smooth external wallthat can be sealed very easily at the surface. Fluids returning from downhole up the annular area arevented under pressure to surface separation equipment <strong>and</strong> small kicks <strong>and</strong> gases can be h<strong>and</strong>ledeasily.In many of the first examples of coiled tubing milling <strong>and</strong> drilling, the mud motors which provide turningability at bit often stalled or stopped turning because of excess loads placed on the bits from eitherthe string or the bottomhole assembly. This reoccurring motor stalling problem resulted in very slowpenetration. Motor stalls typically occur when downward forces (weight <strong>and</strong> force) at the bit aregreater than the ability of the motor to turn the bit. There are a number of reasons for motor stalls.1. Too aggressive a bit or mill design will require excessive power to turn. Less aggressive (smallerteeth) milled <strong>and</strong> bits are easier to turn, although they may drill some materials slightly slower.2. Coiled tubing milling <strong>and</strong> drilling typically uses smaller motors with less torque. The smallermotor design utilizes very small clearances <strong>and</strong> small loaders <strong>and</strong> stators in the mud motors.3. In deviated wells, trying to apply force on coiled tubing from the surface may result in first sinusoidal<strong>and</strong> then helical buckling. When buckling occurs, regardless of its location in the wellbore,the stored energy will try to work its way either up or down <strong>and</strong> add an extra force against the bitthe surface unit.4. The injector feed control at the surface is often a major source of the problem. The injector is asource of all upward <strong>and</strong> downward force exclusive of drill collars <strong>and</strong> other weight. Ideally, thefeed of the coiled tubing through the injector should be no faster than the penetration through thebit or mill. If too much tubing runs through the injector at any time, the total force on the bitincreases <strong>and</strong> a motor stall may occur. For best results, very slow speed or micro movement ofthe injector head should be possible in any unit used for coiled tubing drilling.Underbalanced DrillingTraditionally the main goal of any drilling operation was to keep control of the well. This resulted in apositive pressure from the wellbore outward into the formation stopping the inward flow of all reservoirfluids. Underbalanced drilling with a pressure contained system allows the formation fluids to flow intothe wellbore <strong>and</strong> prevents invasion of the drilling fluids into the formation. Although this method ismore difficult to h<strong>and</strong>le with its increasing amount of fluid recovery, it does provide the very bestmethod of damage-free drilling. The elements of an underbalanced drilling system include a contained,safe, surface system that can separate solids, liquids <strong>and</strong> gases. This type of a separator systemgenerally uses solid separation equipment <strong>and</strong> a horizontal separator to separate liquids <strong>and</strong>gases. Other important aspects of underbalanced drilling include adequate hydraulics of the fluid circulationsystem to allow bit lubrication, cooling <strong>and</strong> hole cleaning, plus sufficient pressure in the wellboreto prevent full-scale hole unloading. Typically, underbalanced drilling attempts to maintain from112-2 Ib per gal under the pore pressure. Depending on the permeability of the formation <strong>and</strong> the typeof fluids flowing, the pressure might have to be adjusted to keep the solid separation facilities withintheir reasonable operating limits.1-6
SlimholesSlimhole drilling has become a popular concept in recent years. Although smaller diameter holes aretheoretically cheaper to drill because less formation is actually removed, they are not always acheaper hole to drill. Cost of drilling involves not only the time to cut through a part of the formation,but also involves the use of existing (paid for) versus new <strong>and</strong> smaller equipment, <strong>and</strong> several otherfactors including pressure control <strong>and</strong> the cost of the completion. Many times it has been found thatdrilling a smaller hole actually costs more than drilling a traditional hole where costs of normal sizedequipments was very cheap in comparison to special ordered newer <strong>and</strong> smaller equipment.Pressure control during drilling or workovers in small wellbores is often very difficult. An example,shown in Chapter 15 on workover fluids <strong>and</strong> control, shows that the volume of a 1 bbl kick in a smalldiameter (3-3/4 in. hole) versus a large diameter hole (9-112 in.) may result in several hundred psi differencejust from the volume of the hole filled by the 1 bbl kick. When drilling or working over holeswith small diameters, accurate trip tanks <strong>and</strong> a functional alarm system must be used to minimize dangerfrom kicks.Initial Completion DesignSelecting the Pay ZoneSelecting the pay <strong>and</strong> deciding where to place the wellbore are two of the most important pieces of engineeringthat most occur in the completion process. Many rocks from shales to fractured granites containhydrocarbons, but, not every rock type or reservoir can qualify as a pay zone. Selection of the pay breaksdown into several basic considerations:1.2.3.Prospect development economics,porosity <strong>and</strong> permeability requirements,hydrocarbon type <strong>and</strong> saturation requirements,4. recoverable hydrocarbon volumes (by primary, secondary <strong>and</strong> tertiary methods),5. pressure support,6. reservoir stability,7. recognition of compartmentalization,a.availability of technology to cost effectively produce the reserves,9. ability to plug <strong>and</strong> ab<strong>and</strong>on the reservoir,10.environmental <strong>and</strong> other risks.The economics of a project depend simply on whether enough money can be made from sale of the productivehydrocarbons in a limited amount of time to offset the total costs of the project. The associated costof the project may include a variety of finding, development, production <strong>and</strong> ab<strong>and</strong>onment costs. Amongthese costs are: prospect leasing, field development, field operation, royalties, interests on the money used,profit, risks, plug <strong>and</strong> ab<strong>and</strong>onment costs <strong>and</strong> contingency funds for all matters problems such as blowouts<strong>and</strong> cleanup operations. Substantial deposits of crude oil <strong>and</strong> gas are known in many parts of the world, butcannot be currently produced because the production rates cannot offset the cost of development <strong>and</strong> operation.Every year many of these (outer limit) deposits are being brought on-line as producing reservoirs astechnology is being developed or the cost of development drops through other factors. Even the cost ofDeepwater developments, for example, which can be in the hundreds of millions or even billions of dollarscan be economic if risk can be reduced <strong>and</strong> if the production rate from the wells is high. Every project from1-7
the shallowest stripper well at 2 bpd to the 100 mmscf/d or 30,000 bpd oil wells must be judged by somerisks versus cost recovery <strong>and</strong> profit factor.Porosity <strong>and</strong> permeability are the reservoir storage <strong>and</strong> pathway of flowing fluids. Porosity is the void spacebetween the grains in which fluids can be stored. Permeability is a measurement of the ability of fluids toflow through the formation. Rocksuch as shales <strong>and</strong> chalk, for example, may have extremely high porositiesapproaching 30-40 percent, but the porosity is not linked together, thus the permeability is very low. On theother h<strong>and</strong>, naturally fractured formations may have extremely high permeabilities approaching tens of darciesin some cases, but have very low porosity, often only 4-6 percent. The amount of porosity <strong>and</strong> permeabilitynecessary for a project depends on the production rate needs, although, operations such as hydraulicfracturing can increase the production rate of a well by a factor of 2 to 10 or more. Fracturing alone may notmake the project economic. The economics of a project are such that every factor must be weighed in turnin the economic justification <strong>and</strong> critical factors, such as hydrocarbon storage <strong>and</strong> the permeable pathway,must be available before even a huge reservoir with billions of barrels of oil can be made productive. In reservoirselection, often times a porosity or permeability cutoff is used for pay versus nonpay identification.Recognition of this level from porosity logs <strong>and</strong> flow tests are often critical in establishing minimum payrequirements.Hydrocarbon type <strong>and</strong> saturation determine the amount of hydrocarbons that may occupy the pore spaceof a reservoir. Many factors such as moveable versus irreducible saturations <strong>and</strong> changing factors such asrelative permeability can make the saturation <strong>and</strong> permeability values “moving targets.” There are no setminimum values for hydrocarbon saturation, however, the best parts of the reservoir will usually have thehigher values of hydrocarbon saturation. Saturation of water may also be a key in pay identification.Extremely high saturations of water may indicate hydrocarbon depletion or movement of an aquifer into thePay.The recoverable hydrocarbon volumes are usually calculated form the measured values of porosity <strong>and</strong> saturation.<strong>Oil</strong> in place quantities do not indicate that all of that oil can be recovered. The porosity of a formationvaries from very large pores to very small pores <strong>and</strong> the oil in very small pores often will not flow from thesmall capillaries even under very high depletion pressures. How much oil will flow from a rock is dependenton the size of the pore spaces, the oil saturation <strong>and</strong> type <strong>and</strong> the amount of energy available to push theoil towards the wellbore. Recoverable hydrocarbon estimates may vary many percentage points from whatreality shows later on. The differences many times are in how well the pressure supports the drive mechanismin producing the fluids.The pressures in the reservoir dictate how much fluid will ultimately be recovered. Many different types ofpressure supports are available. The typical pressure support mechanisms include bottom <strong>and</strong> edgewaterdrives, gas cap drives, volumetric depletion <strong>and</strong> other pressure sources such as reservoir compaction <strong>and</strong>other factors. Each of these pressure support mechanisms has advantages <strong>and</strong> disadvantages to decidingrecovery in a reservoir. Among the most effective types of reservoir pressure support are the bottom <strong>and</strong>edgewater drives. These systems may maintain pressure at initial values clear to the end of the project. Theproblems with them is they may produce large amounts of water along with the oil. Volumetric depletion isusually found in a sealed reservoir <strong>and</strong> then the reservoir may deplete without producing any water. Therecovery, however, from this types of reservoir is extremely low, since reservoir energy bleeds off veryquickly. Pressure support can be added, in some cases, by the use of water floods, gas repressurization orother types of pressure maintenance such as tertiary floods. When factors such as bottomwater or edgewaterdrive are recognized early, the location of the wellbores can be selected to take advantage of flowpaths of the drive fluids <strong>and</strong> recoveries can be enhanced.Reservoir stability is an issue which may effect the initial completion or repairs or recompletions throughoutthe life of the reservoir. Many geologically young formations lack sufficient strength for formation coherencyduring all phases of production. Recognition of this stability issue is usually easy because of rapid drillingrates, s<strong>and</strong> strength issues in the wellbore or other factors. The decision on adding a stabilizing completionis usually made after consideration from initial flow tests <strong>and</strong> other factors. The most common methods of1-8
completion in low stability reservoirs are frac packs <strong>and</strong> gravel packs. Other types of completions mayinclude resign consolidation or production rate restriction to avoid s<strong>and</strong>ing.Recognition of compartmentalization is probably one of the most important factors in the initial design of wellcompletions for a project. Compartmentalization is the division of a reservoir into partial or fully pressureisolated compartments by faults, permeability or porosity pinchouts, folding, shale streaks, barriers or otherfactors. When compartmentalization is recognized, the location <strong>and</strong> type of wellbores can be selected toefficiently drain the compartments <strong>and</strong> to take advantage of fluid flow patterns within the reservoir. Many ofthe failures of even large fields can be traced to a failure to recognize compartmentalization during the earlydevelopment steps in the reservoir.The availability of technology to produce the reserves is an area which keeps the oil industry active inresearch <strong>and</strong> development. Technology such as water flooding, hydraulic fracturing, artificial lift, cold flowof heavy oils, coal degassification <strong>and</strong> many other projects have increased the worlds recoverable hydrocarbons<strong>and</strong> continue to be a critical part of meeting the worlds energy needs. When the reservoir flow patterns<strong>and</strong> other factors are understood, technology can often be developed within a moderate time frameto meet needs in specialized reservoirs.The ability to produce hydrocarbons should never outstrip the ability to control the flow or the ability to plugan ab<strong>and</strong>oned reservoir. Plug <strong>and</strong> ab<strong>and</strong>onment intentions must take into account that the reservoir shouldbe left in as good a condition as possible for potential tertiary operations that may recover even more fluids.Plug <strong>and</strong> ab<strong>and</strong>onment costs can be a significant amount of the project cost. Offshore plug <strong>and</strong> ab<strong>and</strong>onmentof fields may reach over 100 million dollars. There are many associated risks, both political <strong>and</strong> environmentalin developing <strong>and</strong> producing a hydrocarbon depositry. These risks must be taken into accountduring the economic justification for the reservoir <strong>and</strong> should offer as good a solution as is possible to thelegitimate concerns posed in any situation.Once the values are known, selection of the pay can begin. The selection process uses a number of piecesof information gathered by electronics <strong>and</strong> other factors.The objectives in this chapter will be to establish ground rules about what general completion mechanismshave the best fit to the reservoir potential.Completion design is a function of reservoir characteristics. The problem is that reservoir data, particularlythe design sensitive data such as permeability, porosity, saturations, pressure, barriers <strong>and</strong> longevity,are only fully available after most of the wells in the field have been drilled, completed <strong>and</strong>tested. In many cases, after initial drilling <strong>and</strong> completion, reservoir barriers are finally recognized <strong>and</strong>extreme redrilling or stimulations are needed to process the reservoir. The key to a good initial completionis to collect <strong>and</strong> assess the data at the earliest possible time, to allow the best early choice ofcompletion.Successful completions recognize the flow characteristics of the reservoir. There are a number ofcompletion possibilities; each with a limited “fit” to the reservoir properties. The following is a generallisting of the completion types with a few of the reservoir variables. The numbers for most variablesare typical but only general estimates.Vertical wellopen holenatural completionHigh permeability (Kh 2 10 md for oil, 1 1 md for gas)stable formation (no movement or spalling)no bottom or edge water driveslow KJK, c 0.5 KH) (or deviated wells not considered possible)no fracture plannedlpossible, no limits on surface reservoir accesslaminations not “frequent.”1-9
Vertical wellcased holenatural completionsVertical wellopen holefrac plannedVertical wellcased holefrac or frac pack plannedVertical wellopenholegravel packVertical wellcased holegravel packDeviated path approachvertical well in payMulti-lateral wellvertical or horizontalHigh permeability (Kh 2 10 md for oil, 2 1 md for gas)possibility of spalling (no s<strong>and</strong> movement)bottom or edge water control neededlow K, (K, c 0.5 KH) (or deviated wells not considered/possible)no fracture planned/possibleno limits on surface/reservoir access laminations not "frequent."No limits on permeabilitystable formation (no movement or spalling)no bottom or edge water drive control needslow K, (K, c 0.1 KH) (or deviated wells not considered/possible)no limits on surface/reservoir accessmultiple frac not plannedlaminations not frequent in zones not fracturedbottomledge water not penetrated by frac.No limits on permeability180' perforating <strong>and</strong> screenless pack frac for s<strong>and</strong> control1 20°, 90" or 60' phased perfs for other fracslow K, (K, c 0.1 KH) (or deviated wells not considered/possible)no limits on surface/reservoir accessmultiple fracs planned (all heavily laminated zones fractured)bottomledge water not penetrated by frac.High permeability (Kh2 10 md for oil, 2 1 md for gas)laminations not "frequent" (h c 2 ft)no bottom or edge water drive, control neededlow Kv (K, c 0.5 KH) (or deviated wells not considered/possible)no limits on surface/reservoir accessvery high production rates possiblegravel packs only where s<strong>and</strong> control needed.High permeability (Kh 2 10 md for oil, Kh 2 1 md for gas)laminations not "frequent" (h c 2 ft)limited bottom or edge water control neededlow K, (K, c 0.5 KH) or deviated wells not considered/possible)no limits on surface/reservoir access)gravel packs only where s<strong>and</strong> control needed.Surface/reservoir access limiteddeviated wellbore in pay not practical/possiblelaminated zoneszones with barriers.Surface/reservoir access limitedthick layered pay zonesmultiple well types neededcompartmentalized reservoirswellbore placed mostly for water controlwellbore placement for sweep/drainagevery limited need for reentry (unless mechanical system used)no pressure isolation needed.1-10
Horizontal wellopenholeHorizontal welllinerHorizontal wellcasedK, >> 0.5 KH or plan to fracno inter bed barriersno sealing lamination unless plan to fracstable formation (no movement or spalling or plan to gravel pack)good bottom water control possiblesurface/reservoir access restricted.K, >> 0.5 KH (unless plan to frac)no interbed barriersno sealing laminations, (unless plan to frac)some spalling controlno s<strong>and</strong> control problemsno multiple fracs planned (unless isolation packers set)limited bottom water drive controlproduction logs/isolation not needed.Kv >> 0.5 KH (unless plan to frac)no interbed barriersno sealing laminations (unless plan to frac)no vugs or natural fractures (severe cement damage, unless plan tofrac).Special considerations:1. Steeply tilting pay: examine hydrocarbon <strong>and</strong> water fluid flow path to wellbore including effectsof K, <strong>and</strong> KH. Also investigate fracture growth <strong>and</strong> path. May choose uphill horizontal wellbore togo after “attic” or up-dip reserves that are above vertical well contact.2. High permeability “streaks”: The size <strong>and</strong> permeability contrast to the reservoir location withrespect to oil/water contact can significantly affect production or water break through. Orientationof the well path or decision to frac may be affected.3. Salt or techtonic forces: Salt Ylow” may produce extreme loads on casing. The normal approachrequires concentric dual casing strings with annular spaces cemented. Techtonic forces, <strong>and</strong>some horizontal collapse forces may create point loads on the casing which are better h<strong>and</strong>ledby extremely heavy wall casing strings.,4. Sweep/Floods: Well placement to process a reservoir uses the permeability pathways for bestadvantage. Wellbore location, orientation <strong>and</strong> deviation may be influenced.5. Fluid Requirements: Heavy oil, scaling, organic precipitation, chronic emulsions, bubble <strong>and</strong> dewpoints <strong>and</strong> other special requirements may make completion compromises or redesigns necessary.6. Multiple Zones: multiple zones completions <strong>and</strong> independent completions may be required bypressure, fluid or royalty owners.7. The initial design is the starting place for the completion, however, it should never be construedto be unchangable. Flexibility is required for any completion to take advantage of informationthat can be obtained from drilling or other sources.1-1 1
<strong>References</strong> - Drilling1.Greeham, T., McKee, A.: “Drilling Mud: Monitoring <strong>and</strong> Managing It,” <strong>Oil</strong>field Review, Vol. 1,No. 2, p. 41.2.Jones, F. O., Jr.: “Influence of Chemical Composition of Water on Clay Blocking of Permeability,”J. Pet. Tech. (April 1964) p. 441-446.3.4.Peden, J.: “Reducing Formation Damage by Better Filtration Control,” Offshore Services <strong>and</strong>Technology, (Jan. 1982).Arthur, K. G., Peden, J. M.: “The Evaluation of Drilling Fluid Filter Cake Properties <strong>and</strong> TheirInfluence on Fluid Loss,” SPE 17617, Intl. Mtg. on Pet. Eng., Tianjin, China, Nov. 1-4, 1989.5.6.Krueger, R. F., Vogel, L. C.: “Damage to S<strong>and</strong>stone Cores by Particles from Drilling Fluids,” Drill.<strong>and</strong> Prod. Prac., API, (1954), p. 158.Glenn, E. E., Slusser, M. L.: “Factors Affecting Well Productivity-11. Drilling Fluid Particle Invasioninto Porous Media,” J. Pet. Tech (May 1957) p. 132-1 39.7.8.9.10.11.12.13.14.15.16.Krueger, R. F., Fischer, P. W., Vogel, L. C.: “Effect of Pressure Drawdown on the Clean-up ofClay or Silt Blocked S<strong>and</strong>stone,” J. Pet. Tech (March 1967) 397-403.Tuttle, R. N., Barkman, J. H.: “New Nondamaging <strong>and</strong> Acid-Degradable Drilling <strong>and</strong> CompletionFluids,” J. Pet. Tech 1974.Vidick, B., Yearwood, J. A., Perthuis, H.: “How to Solve Lost Circulation Problems,” SPE 1781 1,Intl. Mtg. on Pet. Eng., Tianjin, China, Nov. 1-4, 1989.Wilson, G. E.: “How to Drill a Usable Hole,” World <strong>Oil</strong> (August 1976), p. 40.Wilson, G. E.: “How to Drill a Usable Hole,” World <strong>Oil</strong> (September 1976), p. 47.Woods, H. B., Lubinski, A.: “Use of Stabilizers in Controlling Hole Deviation,” Drilling <strong>and</strong> ProductionPractices, 1954.Bowman, G. R., Sherer, B.: “How to Run <strong>and</strong> Cement Liners, Part 2,” World <strong>Oil</strong>, (May 1988),p. 58-66.Adams, N.: “How to Control Differential Pipe Sticking,” <strong>Petroleum</strong> Engineer, (September 1977).Dunbar, M. E., Warren, T. M., Kadaster, A. G.: “Theory <strong>and</strong> Solutions to Bit Sticking Caused byBorehole Deformation,” SPE 141 79, 60th Annual Mtg., Las Vegas, Sept. 22-25, 1985.Paccaloni, G., Tambini, M., Galoppini, M.: “Key Factors for Enhanced Results of Matrix Stimulation,”SPE 171 54, Formation Damage Symposium, Bakersfield, Feb. 8-9, 1988.Other <strong>References</strong>1. See Chapter 15 for all references on Adams.1-12
Chapter 2: Casing DesignOpen Hole CompletionsThe first decision on casing the pay zone is not of size or weight but whether or not to run casing at all.Open hole completions represent the simplest type of completions <strong>and</strong> have some very useful traits.They also present some problems. An open hole or barefoot completion is usually made by drilling tothe top of the pay, then running <strong>and</strong> cementing casing. After these operations, the pay is drilled with anondamaging fluid. Since the other formations are behind pipe, the drilling fluid overbalance is onlythat needed to control the reservoir pressure. This creates less damage.Open hole completions have the largest possible formation contact with the wellbore, allowing injectionor production with every part of the contacted interval.The effect of the open hole on stimulated operations depends on the type of job. Fracturing operationsare often easier in the open hole than through perforations by less possibility of perforationscreenouts, but the perforations may make the zone easier to break down since a crack (the perforation)has already been placed. Matrix acidizing can more evenly contact the entire zone in an openhole but is more difficult to direct by straddle packer than in a cased hole. Hydraulic jetting is mosteffective in the open hole.Productivity of open hole gravel packs, especially the underreamed open holes are usually muchhigher than cased hole gravel packs.Why then, are casing strings even used? Part of the answer is in formation (wellbore) stability concerns<strong>and</strong> part is unfamiliarity with completing <strong>and</strong> producing the open hole completions. A decisionmust be reached on the merits of the completions on the pay in question. If the pay is prone to brittlefailures during production that leads to fill, most operators choose to case <strong>and</strong> cement. In areas ofwater coning or zone conformance problems, casing may make isolation of middle or top zones possible.With the advent of improved inflatable packers <strong>and</strong> matrix sealants, however, isolation is also possiblein open holes, although wellbore diameter may be severely restricted.Cased Hole CompletionsA casing string is run to prevent the collapse of the wellbore <strong>and</strong> to act in concert with the cementsheath to isolate <strong>and</strong> separate the productive formations. The size of the casing is optimized on theexpected productivity of the well <strong>and</strong> must be designed to withst<strong>and</strong> the internal <strong>and</strong> external pressuresassociated with completion, any corrosive influences, <strong>and</strong> the forces associated with runningthe casing.An optimum design for a casing string is one designed from "the inside out", a design that is based onsupplying a stable casing string of a size to optimize total fluid production over the life of the well(including possibility of secondary or tertiary floods). The effective design of a casing string for anywell consists of four principal steps.1. Determine the length <strong>and</strong> size of all casing strings that are needed to produce the well to itsmaximum potential.2. Calculate the pressure <strong>and</strong> loads from predicted production <strong>and</strong> operations such as stimulation,thermal application <strong>and</strong> secondary recovery.3. Determine any corrosive atmosphere that the casing string will be subjected to <strong>and</strong> either selectalloys which can resist corrosion or design an alternate corrosion control system.2- 1
4. Determine the weight <strong>and</strong> grade of casing that will satisfactorily resist all of the mechanical,hydraulic, <strong>and</strong> chemical forces applied.The sizing of a casing string must be complete before finalizing the bit program during the planning ofthe well. A casing string can be visualized as a very long telescoping tube with the surface casing orconductor pipe as the first segment <strong>and</strong> the deepest production string or liner as the smallest, mostextended section. Each successive (deeper) segment of the casing string must pass through the lastsection with enough clearance to avoid sticking. Figure 2.1 illustrates the way the casing string fitstogether. The drill bits used for each section are usually 1.5 to 3 in. or more larger than the casing 0.d.to be run. When one section is cased <strong>and</strong> cemented, a bit just small enough to pass through the casingdrift ID is run to drill to the next casing seat (casing shoe set depth). During drilling, departing fromthe bit program is often required, especially in a wildcat when the fluid pressures in the formationscannot be controlled with a single mud weight without either breaking down some formations byhydraulic fracturing with the mud, or allowing input of fluid from other formations because of lowhydrostatic drilling mud pressure (a kick). Ideally, just before this noncontrollable point is reached, the“casing point” is designated <strong>and</strong> a casing string is run. Economics of drilling <strong>and</strong> cementing dictatethat these casing points be as far apart as formation pressures <strong>and</strong> hole stability will allow. Use of asfew casing strings as possible also permits larger casing to be used across the production zone withoutusing extremely large diameter surface strings.ii-........-7,;$:$$,y;.........E.iZ:.:i;i i.............. ;,.:. .........i0. “YDRO-PRESSURE3 WEUS b. GEO- PRESSURED WELLSF.......... .:. :.,.,:;:x:;+.,...>~..:2!:...:,Figure 2.1:(Buzarde et al., SPE, 1972)Typical casing strings for normal <strong>and</strong> high pressure wells.In the high pressure wells, the multiple strings in the overlapsection will likely be cemented in the annulus, clearback to the liner top or to surface on a casing string.Use of small casing severely restricts the opportunities for deepening the well or using larger pumps.Use of small casing to save on drilling costs is usually a poor choice in any area in which high productionrates (including water floods) are expected.Description of Casing StringsThere are several different casing strings that are run during the completion of a well. These stringsvary in design, material of construction <strong>and</strong> purpose. The following paragraphs are brief descriptionsof the common required strings <strong>and</strong> specialty equipment.2-2
The conductor pipe is the first casing which is run in the well. This casing is usually large diameter <strong>and</strong>may be set with the ”spudding” arm on the rig (The spudding arm drives in the casing.). The primarypurpose of the conductor casing is as a flow line to allow mud to return to the pits <strong>and</strong> to stabilize theupper part of a hole that may be composed of loose soil. The depth of the conductor pipe is usually inthe range of 50-250 ft with the depth set by surface rocks <strong>and</strong> soil behavior. It also provides a point forthe installation of a blow-out preventer (BOP) or other type of diverter system. This allows any shallowfluid flows to be diverted away from the rig, <strong>and</strong> is a necessary safety factor in almost all areas. Inareas with very soft <strong>and</strong> unconsolidated sediments, a temporary outer string, called a stove pipe, maybe driven into place to hold the sediment near the surface.The well is drilled out from the conductor pipe to a depth below the shallow fresh water s<strong>and</strong>s. Thesurface casing string is run through the conductor pipe <strong>and</strong> has three basic functions: (1) it protectsshallow, fresh-water s<strong>and</strong>s from contamination by drilling fluids, (2) prevents mud from being cut withbrines or other water that may flow into the wellbore during drilling, <strong>and</strong> (3) it provides sufficient protectionof the zone to avoid fracturing of the upper hole so that the drilling may proceed to the nextcasing point. This surface casing is cemented in place over the full length of the string <strong>and</strong> is the secondline of safety for sealing the well <strong>and</strong> h<strong>and</strong>ling any high pressure flow.The intermediate string is the next string of casing, <strong>and</strong> it is usually in place <strong>and</strong> cemented before thehigher mud weights are used. It allows control of the well if subsurface pressure higher than the mudweight occurs <strong>and</strong> inflow of fluids is encountered. This inflow of well fluids during drilling or completionof the well is called a kick <strong>and</strong> may be extremely hazardous if the flowing fluids are flammable or containhydrogen sulfide (sour gas). The intermediate casing may or may not be cemented in place <strong>and</strong>, ifnot cemented, may be removed from the well if an open-hole completion is desired.If a casing string is not hung from the surface, but rather hung from some point down hole, it is calleda “liner”. In most wells, the top of the liner is cemented in place to provide sealing. The top of the lineris set inside an upper casing string. The section where the liner runs inside another string is the overlapsection.Production liners are permanent liners that are run through the productive interval. On some occasions]they may be run back to surface in a liner tieback operation. The tieback consists of a downholemechanical sealing assembly in a hanger into which a linear string or the tie back string is “stabbed” tocomplete the seal. A cement job seals the liner into place in the casing <strong>and</strong> prevents leakage from theformation into the casing. The lower part of the casing string, into which the liner is cemented, is calledthe overlap section. Overlap length is usually only enough to insure a good seal, typically 300 to500 ft. Overlap length may be longer where water or gas channeling would create a severe problem.Liners are run for a variety of reasons. If the operator wants to test a lower zone of dubious commercialquality, a liner can be set at less expense than a full casing string. Also, in lower pressure areaswhere multiple strings of pipe up to the surface are not necessary to control corrosion or pressure, theliner can be an expense-saving item. In wells that are to be pumped by ESP’s (Electric SubmersiblePumps), the liner through the production section leaves full hole diameter in the casing string abovethe pay for setting large pumps <strong>and</strong> equipment.The production casing, or the final casing run into the well, is a string across the producing zone thatis hung from the surface <strong>and</strong> may be completely cemented to the surface. This string must be able towithst<strong>and</strong> the full wellhead shutin pressure if the tubing or the packer fails. Also, it must contain the fullbottomhole pressure <strong>and</strong> any mud or workover fluid kill weight when the tubing or packer is removedor replaced during workovers. The decision on whether to cement the full string is based on pressurecontrol, economics, corrosion problems, pollution possibilities <strong>and</strong> government regulations.Casing ClearanceThe necessary clearance between the outside of the casing <strong>and</strong> the drilled hole will depend on thehole <strong>and</strong> mud condition. In cases where mud conditioning is good or the mud is lightweight <strong>and</strong> theformations are competent, a clearance of 1.5 in. total diameter difference is acceptable. For this clearanceto be usable, the casing string should be short. Primary cementing operations may not be suc-2-3
cessful in this clearance <strong>and</strong> cementing backpressures will be high. A better clearance for generalpurpose well completions is 2 to 3 in. For higher mud weights, poorer mud conditioning, poor qualityhole <strong>and</strong> higher formation pressures, clearance should be increased. For more information on holequality <strong>and</strong> sticking, review the chapter on Drilling the Pay. Excessive clearances should also beavoided. If the annular area is too large, the cement cannot effectively displace the drilling mud.A reference for hole size <strong>and</strong> casing size for single or multiple string operations are shown inFigure 2.2.2 The solid lines indicate the common biffcasing combinations with adequate clearance formost operations. The dashed lines indicate less common (tighter) hole sizes or bitkasing combinations.Long runs of casing through close clearance holes usually leads to problems. Tight clearancesshould be avoided where possible.(<strong>Oil</strong> <strong>and</strong> <strong>Gas</strong> Journal)Figure 2.2:This chart can be used to select the casing bit sizes required to drillmost drilling programs. To use the chart, select the casing or linersire to be used <strong>and</strong> enter the chart at that sire. Follow the solidlines to select the applications. The holelcasing combinationslinked by the dashed lines are close clearance <strong>and</strong> require specialtechniques. They should be avoided. The deepest casing is chosenfirst <strong>and</strong> the bit <strong>and</strong> casing program is built in reverse (toward thesurface from the maximum depth).2-4
ConnectionsThe threaded connection of casing or tubing is important because of strength <strong>and</strong> sealing considerations.The connections are isolated pressure vessels that contain threads, seals <strong>and</strong> stop shoulder^.^The fluid seal produced by a connection may be created in the threads by a pipe dope fluid or by ametal or elastomer seal within the connection. Strength of the connection may range from less thanpipe body strength to tensile effciencies of over 115% of pipe body ~trength.~ Threads are tapered<strong>and</strong> designed to fit a matching thread in a particular collar. In the API round thread series, the connectionmay be either short thread <strong>and</strong> coupling (ST&C) or long thread <strong>and</strong> coupling (LT&C) as illustratedin Figure 2.3. If the thread is an eight round, it means eight threads per inch. The length descriptionrefers to the relative length of the coupling <strong>and</strong> the amount of pipe that is threaded (the pin). Creationof a pressure tight seal with an API round thread requires filling the voids between the threads with asealing compound (thread dope) during makeup of the joint.Figure 2.3:Left: Cut away coupling view of a long thread <strong>and</strong>coupling joint (LT&C), round thread.Right: Close-up of the joint connection showingrelative thickness of metal <strong>and</strong> position ofthreads. Seal is formed with pipe dope in thethreads.Although the st<strong>and</strong>ard 8-round threaded connection is reasonably strong, it does not approach thestrength of the body of the pipe. As tensile loads increase toward the limit of the pipe, the connectionwill normally fail by shearing off the threads from the pipe or by thread jumpout caused by pipe deformationunder severe loads.To make a stronger joint in tubing, a thicker (larger outside diameter) section is left at the end of thepipe so that threads can be cut without making the wall thickness of the pipe thinner than in the body.This form of connection is called external upset or EUE, Figure 2.4. Its inside diameter is the same asthe pipe. A nonupset, or NU pipe <strong>and</strong> several other joint types are shown in Figure 2.5 The outsidediameter of the EUE joint is larger than the NU connection, <strong>and</strong> the coupling or collar is normally manufacturedon the pipe. Another method of increasing the strength of the threaded connection is byupsetting the connection to the inside of the pipe. This internal upset restricts the inside diameter ofthe pipe at every joint <strong>and</strong> is only used in drill pipe where a constant outside diameter is necessary.Other sealing surfaces are available in special connections <strong>and</strong> have found popularity where rapidlymade, leak free sealing is important. The two-step thread connection uses two sets of threads with ametal sealing surface between. In other connections, a groove at the base of the box may contain anelastomer seal. A variety of connection types <strong>and</strong> sealing surfaces are available, Figure 2.5. The disadvantageto the numerous thread <strong>and</strong> sealing combinations is that the connections cannot be mixed2-5
pin end box end outside of piper---*A+"~.constant inside diameterFigure 2.4:Cut away drawing of an external upset connection (EUE).(World <strong>Oil</strong> Tubing Tables)Figure 2.5:Examples of patented or specialty pipe connectors. Tubing <strong>and</strong> Casing examplesare shown.in a string without crossovers (adaptors). A more detailed discussion of connections are available fromother sources.14Casing Weights <strong>and</strong> GradesCommon casing diameters range from less than 4-1/2 in. to over 20 in., <strong>and</strong> common tubing sizes arefrom 3/4 in. to over 4-1/2 in. In some high rate wells, tubing may be 5-1/2 in. to over 7 in. <strong>and</strong> 2-7/8 in.casing is run in tubingless completions.After the size is determined, the grade of the steel must be selected. The grades, along with weight,are based on pressure <strong>and</strong> corrosion requirements. The grades of steel used in oil industry tubularsare shown in the following table for API <strong>and</strong> non-API sizes. The letters are assigned only to avoid confusion.Grades N-80 <strong>and</strong> stronger are considered high strength steels. Use of the higher strengthsteels increases cost <strong>and</strong> decreases resistance to some forms of corrosion. Use of the very hard2-6
alloys, such as V-150, makes packer setting difficult since the slips have difficulty setting in the veryhard steel of the casing.API GradesMinimum Strength (psi)Yield I UltimateThe yield <strong>and</strong> burst strength values for each casing size <strong>and</strong> weight are available from detailed tablesare used for selection of casing once the necessary strength calculations are made.Often, because of economics or efforts to lighten the casing string, lower grade or lighter weight casingmay be considered. Because the weight <strong>and</strong> pressure loads on a casing string change from top tobottom, a well designed string may incorporate several weights <strong>and</strong> grades of casing.Casing Design Safety FactorsThe design criteria for casing strings depends on the intended use <strong>and</strong> anticipated stresses. Becausevariance exists in both pipe manufacture <strong>and</strong> formation properties, safety factors must be incorporatedinto a design. The common ranges for safety factors in normal completion are shown b e l ~ w . ~ ~ ~ ~Factors such as salt flows,7 very high pressures, sour service,8 reservoir compaction loads,g <strong>and</strong> thermalcycling'0 may change the safety factors.tension 1.6 to 1.8burst 1.25 to 1.30collapse 1 .O to 1.25Earth shift forces, such as salt movement or other faulting <strong>and</strong> folding events caused by tectonicmovement or are very difficult to address with a traditional safety factor. These forces have been successfullyoffset in some cases by designs using very heavy wall pipe or concentric pipe (casingcemented inside casing) over the affected zone. These types of casing designs are rare <strong>and</strong> most aregenerated by a series of trail <strong>and</strong> error approaches.Load DescriptionThe casing string must be designed for any load encountered from mud or reservoir fluids in placementor during any phase of stimulation or production. The common forces are tension during running,internal pressures during drilling, completion or production, <strong>and</strong> external pressures caused by drawdown,mechanical loads, <strong>and</strong> zone pressures. These loads are tension, burst, <strong>and</strong> collapse. The loadsare often applied simultaneously in different parts of the string, <strong>and</strong> the forces may interact.The tension design of the casing string is made as if it were hanging free in air. A safety factor of 1.6to 1.8 is applied to make allowances for a number of other tension factor^.^*^^'' These factors arebriefly discussed in the following paragraphs. Collapse, burst, <strong>and</strong> tension forces are explained separately,but all must be satisfactorily accounted for in the final design. The design methods in this book2-7
esult in a conservative design. Each design method is based on the worst possible case that couldoccur during running.’Collapse loading is force applied from outside the casing by either fluid pressure in a zone or earthshift forces. Forces from fluid pressure are collapse loadings while earth shift forces produce mechanicalcrush loadings. The largest collapse load from fluid pressure will usually be exhibited at the bottomof the string where hydrostatic pressure is greatest. The exception is an isolated, very highpressure zone. These zones are usually noted on the drilling record as places where kicks are taken.The occurrence of earth shift zones from faults or salt movement are much harder to locate, especiallyon wildcats but may often show up on the drilling record as sticking points (not associated with mudcake buildup) or zones that have to be reamed or redrilled to get back to gauge hole size. The occurrenceof salt zones are a very important tip to potential casing problem^.^ In one study area, 87% ofthe wells around a salt dome suffered some casing diameter reduction due to external, earth shiftforce.In the collapse design for fluid pressure, the worst case loading occurs with the unlikely combinationof an empty casing string in a hole full of mud. A proper design, for effects of collapse only, wouldbe a casing string that is strongest at the bottom <strong>and</strong> weakest at the top. Collapse is also affected bythe effects of tension, which reduces the collapse rating or the “set depth limit” of the casing. As anobject is pulled, it is more likely to lose diameter as it stretches in length. This thinning is a force in thesame direction as collapse forces. Fortunately, the point at which the effect of tension induced “narrowing”of the string is at maximum is at the surface where effects of collapse pressure from hydrostaticpressure are the lowest.Burst pressure is a force applied from inside the casing by produced fluid pressures, hydrostatic mudload or addition of surface pressure during stimulation or workover operations. Since there is usuallymud hydrostatic pressure along the outside of the casing before <strong>and</strong> during cementing, the net pressureor the difference between the pressure inside the casing <strong>and</strong> outside the casing will be used inthe design of the casing. Unlike collapse, however, the shallower casing section is also important inthe burst calculations from a safety st<strong>and</strong>point. Burst pressures exerted by produced fluids are maximumat the surface (no offsetting hydrostatic load), while those exerted by mud is maximum at thebottom of the well. During fracturing, high burst loads may be exerted all along the string. Becausecollapse loads offset the burst load at the bottom of the string, the burst calculation is usually importantabove the “buoyancy neutral point.” This will be developed later.Tension is a force produced by the weight of the casing, the pressure differential, <strong>and</strong> the mud weightsinside <strong>and</strong> outside the casing. It is largest at the top of the string <strong>and</strong> decreases with depth toward thebottom of the string. The tension load is partially offset by the buoyancy of the string in mud <strong>and</strong> isaffected by pressure. When the pressure inside the tube rises, the pipe diameter is exp<strong>and</strong>ed <strong>and</strong> thelength shortened or the tension is increased in a pipe that is anchored to prevent upward movement.When the pressure outside of a tube rises, the tube is elongated or the compression is increased if theends are fixed, Figure 2.6.Buckling failure in casing usually results from axial compression (lengthwise) overloading. The loadproduces ridges in the casing walls or corkscrewing of the tube. Either of these actions relieve compression,but the pipe is usually permanently yielded.The effects of buckling, Figure 2.7, is critical on the design of the casing string. The neutral point,Figure 2.8, is the dividing line between where buckling may occur <strong>and</strong> where it cannot occur in a tubethat is evenly loaded around its radius. Above the neutral point, the tube is in tension <strong>and</strong> will notbuckle. Below the neutral point, the upward buoyancy of the mud <strong>and</strong> other forces including pressure<strong>and</strong> mechanical loading place the tube in compression. Buckling can occur if the compressive load ismore than the pipe can tolerate in the wellbore surroundings. The following information describes theneutral point, first in a theoretical manner <strong>and</strong> then in a practical way. There can be a neutral point inthe casing or tubing string described by the formula:’*2-8
-LOWPRESSURE-HIGHPRESSUREThe tubing will rhomn if k Is frwto mow or it will cmti I tinsionforts on thr packer if it Is mstrainad from moving.REVERSE W N I N GTh. tubing will kngchrn if k I$ fmto mow or It will cram I mmpdvefom on thr packer if k Irmtraind from moving.Figure2.6:(Guiberson)Effects of external <strong>and</strong> internal pressure on lengthchange in a tube.NEUTRALCOIN7Figure 2.7:U111(Harnrnerlindl, 1977)Exaggerated view of tube buckling below the neutral point.Fz $ PiAi- PoAowhere:FzPiAi= true axial force (or axial force rating of the tubular)= pressure inside tubular, psi= cross-sectional area of ID, in.*2-9
YFigure 2.8:(Hammerlindl, 1980)Stress distributions of a tube under various conditions.POA,= pressure outside tubular, psi= cross-sectional area of OD, in.*When F, is algebraically greater than the right-hanc side of the equation, the pipe tends to be straldht.When F, is less than the equation, the pipe tends to buckle. When F, is equal to the equation, the neutralpoint is reached. The right-h<strong>and</strong> side of Eqn. (2.1) may also be referred to as the stability force.The true axial force will vary from point to point in the string, <strong>and</strong> will also vary over the life of the well.Typical considerations necessary to compute F, include the conditions at the time of cementing thecasing or setting the packer in the case of tubing, as well as changes in the environment (temperature<strong>and</strong> pressure) to which the tubular is exposed. For casing, buckling primarily affects wear, particularlyfor intermediate strings through which additional drilling will occur. In extreme cases, splitting mayalso be common. For tubing, the radial clearance between tubing <strong>and</strong> casing is usually sufficient toallow corkscrewing, often producing permanent deformation of the buckled portion of the string.A special case expression for F, uses Poisson's ratio:Fz = 2pPiAiwhere:p = Poisson's ratio, about 0.3 for this applicationThis equation is only appropriate for an open ended tube, clamped at both ends, with PO = 0 <strong>and</strong>AT = 0 , <strong>and</strong> ignoring weight. Under the unlikely conditions of a weightless string with no outsidepressure, buckling in tension is possible. To illustrate the impact of Eqn. 2.2, consider a weightlesstube that is open ended <strong>and</strong> subject to internal pressure only. For this loading, the only axial force isthat due to ballooning given by Eqn. 2.2 <strong>and</strong> shown previously in Figure 2.6. As the inside pressure isincreased, F, increases as 2pPjAis but the right h<strong>and</strong> side of Eqn. 2.1 increases as PjAi. The tube willnot only buckle immediately, but will also buckle in tension.The stability equation is also reported as:12= Fa + PiAi- PoAowhere:2-10
FsFa= stability force= axial loadIn relating this equation to Eqn. 2.1, Fs = -[F, - (PiAi) - (PoAo)] <strong>and</strong> F, = -Fa.Each zone or section of the casing string is checked for tensile requirements following collapse <strong>and</strong>burst calculations. In case of corrections made to a string design to compensate for tension loadrequirements, the order of selection is usually: (1) stronger connection, (2) higher grade (strongersteel), <strong>and</strong> (3) higher weight. Increasing connection strength <strong>and</strong> steel grade is preferred since theyincrease total string strength without adding significant weight. There are so many “premium” connectionsavailable that it is difficult to present a comprehensive data set. Tables of connection specificsare published yearly.37For the sole purpose of casing collapse strength derating due to the effects of tension, a practical“buoyancy neutral point”, designated N.P., can be estimated by Eqn. (2.4) where:N.P. = .(I-&)(2.4)where:N.P. = the “neutral point” for tension effects on casing collapse, ft0, = settling depth of casing string, ftprn = mud density, Ib/gal65.4 is the weight of steel in Ib/gal based on a density of 489.5 Ib/ft3The collapse resistance values given in the manufacturer tables are for casing that is not affected byaxial load. In a well, the casing will be stressed by fluid pressures, Figure 2.9, mechanical bendingforces, Figure 2.10, <strong>and</strong> tensile forces produced by the hanging weight of the casing. In collapse calculations,axial tension produces a reduction in collapse resistance. For purposes of this example, theaxial tension is assumed to be from tension loads on a straight, free hanging pipe <strong>and</strong> not from bendingloads.The equivalent yield strength, Ypal is:’5xY,,,[ ( 1 - 0.75 ( o,/ Y,,) 2, ’’2 - 0.5 ( CTJ Y,,) ] Ypwhere:CT, = axial stress, psiYp = minimum rated yield strength of casing, psiThe percent of yield stress may be calculated by:stYr = -Yrn2-1 1
Figure 2.9:Schematic of the location 0. Jxial (03, tangential(03 <strong>and</strong> radial (or) stresses on a verticalsuspended tube exposed to fluid pressure.tension from hook loads!where:Figure 2.10:Loads on a casing string during running <strong>and</strong>on casing l<strong>and</strong>ed in a curved section of theborehole.Y,S,= percent of yield stress= unit tensile stress, psi2-12
tension fm hook loads!itension from casing belowYm = minimum yield stress of casing body, psiThe percent yield stress is related to percent of full collapse pressure by the curve of Figure 2.11. Theproduct of the percent of collapse <strong>and</strong> the collapse rating is the effective collapse strength (derated foreffects of tension). Because of buoyancy effects, tension only exists above the buoyancy neutral pointcalculated by Eqn. 2.4. The effects of compression below the buoyancy neutral point increase the casingcollapse resistance although the increase is not accounted for in this design.Kgr0fFigure 2.11:TENSION LOAD'. BODY YIELD STREETH(from Halliburton)Effect of axial tension on collapse strength of casing. TheY,vaiue is used in the collapse derating calculation.2-13
Designing for forces involving earth shifts, highly deviated hole, sticking, reciprocating <strong>and</strong> rotatingcasing while cementing or running stresses, involves field optimization <strong>and</strong> the criteria for design differfrom company to company. Earth shift design usually involves multiple strings of pipe or very heavywall pipe across the problem zone. Problem zone recognition can often be made from drilling recordswhere bit dragging (nonassociated with mud cake buildup) occurs long after a zone is drilled. Wellsnear salt domes or flows are considered likely prospects for formation movement.Casing String DesignA complex solution (API method) requiring computer solution is discussed first, followed by a practical,h<strong>and</strong> calculated method.API EquationsCollapse strength rating is the external pressure required to collapse the casing. There are severalmethods for designing casing strings that will produce an acceptable casing design. Most methodsuse an x-diagram graphical approach or a calculated design based on a single strength concern ineach area of design. The API procedure recognizes the changes in steel behavior in elastic, transition,plastic, <strong>and</strong> ultimate yield. The procedure illustrated here for determining the collapse strength isdefined in API Bulletin 5C3.15 This casing design section is merely an introduction to the process. Fora complete treatment, refer to Rabia's Fundamentals of Casing Design.14When exposed to external pressure from mud or reservoir fluids <strong>and</strong> the effects of axial tension fromthe weight of the casing below any point (plus other loads)," a piece of casing may fail in one of threepossible collapse mechanisms: elastic collapse, plastic collapse, <strong>and</strong> failure by exceeding the ultimatestrength of the material. Each failure mode is bounded by limits of the ratio of casing diameter to thickness,plus a transition collapse formula was added arbitrarily since the API minimum elastic <strong>and</strong> rninimumplastic curves do not intersect. The transition formula covers this area. The API minimumcollapse resistance equations are shown in Figure 2.12.15Figure 2.12151. Elastic46.95 x 1 O6pc= D(D ,)2t 7-Applicable - D ranget- D,2+ BIAt- 3BIA2. TransitionYP(A-F)D
3. Plastic[ ( A-2)2+8(B+C/YP)]1/2+ (A-2) D YP(A-F)575pp 2 (B+ C/YP) C+ YP(B- G)(2.9)4. Ultimate Yieldwhere:lil(A-2)2+8(B+CIYP)1/2+ (A-2)2(B+ClYP)1(2.1 0)A = 2.8762 + 0.10679 x 10⁻⁶ YP+ 0.21301 x lO-'OYP - 0.53132 x 10-l6 YP3 (2.1 1)B = 0.026233 + 0.50609 x 10⁻⁶ YP(2.12)YP = minimum yield strength of the pipe, lbC = - 465.93 + 0.030867 YP- 0.10483 x 10⁻⁷ Y p - 0.36989 x 10⁻¹³ YP3 (2.13)-(2.1 4)G = FBIA(2.1 5)The effect of addition of axial tension to a casing string has a net effect of reducing the yield stress ofthe pipe. The reduction may be severe enough to cause a derating of the pipe by a full grade, e.g., N-80 to C-75. The yield strength, Ypa, of the axial stress equivalent grade is:14Ypa = ( (1 - 0.75 (oa/ YP) 2, 1/2 - 0.5 (Gal YP) ) YP(2.1 6)where:Ypa= yield strength of axial stress equivalent, psi2-15
YP = minimum body yield strength of the pipe, Ib0, = axial stress, psiAxial loads generally result from two forces:1. hanging weight of the casing string2. temperature induced forces in thermal wells <strong>and</strong> in nonthermal wells where operating temperaturesmay change by over 100°F.BuoyancyWhen the hole is filled with cement or mud, there is a buoyancy force exerted on the casing by thefluid in the hole <strong>and</strong> opposed by the fluid in the casing. Buoyant force acts on the entire casing string<strong>and</strong> results in a reduction in hanging weight. The amount of buoyant force exerted by the mud is equal. to the weight of the mud displaced by the submerged casing.The weight of steel at 489.5 Ib/ft3 or 65.4 Ib/gal, is several times the heaviest mud weight, yet thebuoyant contribution of the mud is a significant factor in the hook load during running <strong>and</strong> cementingof the casing. Hook loads change dramatically during running <strong>and</strong> cementing operations <strong>and</strong> conditionsdo exist (running closed end casing, dry) where hook load could diminish to zero (the casingfloats).Buoyant weight, Wb, for an open-ended casing string of air weight W,, filled <strong>and</strong> surrounded by onefluid. is:where:pf= density of the fluid(2.1 7)ps = density of the steel, 489.5 Ib/ft3 or 65.4 Ib/galWhen the fluid in the casing is different from the fluid outside the casing, the volumes contained in thecasing <strong>and</strong> displaced by the casing must be calculated <strong>and</strong> the weights summed against the air weightof the casing.For the special case of an additional surface pressure such as holding pressure on the mud in the casingwhile cement sets in the annulus, the surface pressure is incorporated with the load produced bythe mud. The buoyant force, FB, applied to the air weight of the casing becomes:FB = [ (Pis- 0.052pjd) Ai- (PO, + O.052p0d) A,](2.1 8)where:FBpi,PO,pi= buoyancy force, Ib= surface pressure on fluid inside casing, psi (usually zero)= surface pressure on fluid outside casing, psi (usually zero)= density of fluid inside casing, Ib/gal2-16
poAi= density of fluid outside casing, Ib/gal= inside area of casing, in.2A, = outside area of casing, in.2d =depth, ftThe pressure terms affect buoyancy much the same way as pressure affects tubing forces.Example 2.1A 10,000 ft string of 7 in., 26 Ib/ft, N-80 casing is run in a hole filled with 12 Ib/gal mud. The string isequipped with a float shoe.Calculate:a. hook load of an empty, closed end, casing string in mud.air weight = (1 0,000 ft)(26 Ib/ft) = 260,000 Iba( displaced volume of mud = E (d) X depth =4&)' (1 0,000)= 2673 ft3displaced weight of mud = (2673 ft3) [ 12$)(7.485) = 239, 928 IbThe displaced weight of the mud is a force acting upward on the casing, trying to float it out of the well.It has the effect of trying to lighten the total load.hook load = 260,000 - 239,928 = 20,062 Ib(this ignores the weight of air)b. hook load of a mud filled string in mud (same mud weights inside <strong>and</strong> outside).Since the only action is on the cross section of the steel body, the buoyancy factor difference formulais adequate.6,- [I-:) = 1-489.5- lbft3= 0.817wb = (260,000 lb) (0.817) = 212,420 lbc. hook load of 16 Ib/gal cement filled string in mud.total buoyant wt. = wt. of casing in air + wt. of cement - buoyancy of displaced mud.wt. cement = (x/4)(6.276 in.)2 (16 Ib/gal) (0.052 gal/ft in.2)(10,000 ft) = 257,382 Ib2-17
uoyancy force = 239,928 Ib (from part a)total buoyant wt. = 260,000 + 257,382 - 239,928 = 277,455 IbThe effect of gas density is usually ignored for hanging weight or buoyancy calculations. It will be considered,however, in hydrostatic calculations.Collapse Design - Non-API MethodA practical method that considers burst, collapse, <strong>and</strong> tensile forces is also available. This methodmay be worked by equations or by graphical methods. The design is conservative in collapse resistancebecause of the basic assumptions of an empty string in a hole full of mud. In practice, most casingstrings are filled with mud as they are run. The design begins at the bottom of the string.The collapse force produced by fluid pressure from a homogeneous fluid in the well <strong>and</strong> an empty casingstring is:where:PcxpfD,= collapse pressure at a depth D, psi= density of the fluid on the outside of the pipe, Ib/gal= depth at the point of calculation, ftThe forces can be visualized graphically by the methods of Figures 2.13 through 2.1 8.35b(2.1 9)(Hills)Figure 2.13: Graphical collapse force analysis.When the effects of a different fluid, such as cement, inside the pipe is considered, the equationbecomes:’ 6*1P, (PO + D,G,) - (Pi+ D,GJ(2.20)PcxPO= collapse pressure at a depth Dx, psi= external surface pressure, psi (usually zero)2-18
Figure 2.14:(Hills)Graphical burst force analysis.Figure 2.15: X-Graph design method. Alternative casing design.Figure 2.16:(Hills)Graphical method for tension analysis.D,GopiGi= depth of calculation, ft= pressure gradient exerted by the fluid outside the pipe, psi/ft= internal surface pressure, psi= pressure gradient exerted by fluid inside pipe, psi/ftis used where there is an outer casing string <strong>and</strong> an annular pres-The external surface pressure, PO,sure will be exerted. This technique is commonly used to “back up the tubing” <strong>and</strong> increase burst2-19
(Hills)Figure 2.17: Graphical method for over-pull analysis.(Hills)Figure 2.1 8: Graphical buoyancy analysis.resistance of the inner string. It may also be used in some casing designs. Because outside surfacepressure is rare, the term is generally dropped.It is customary to design the primary strings for the worst possible case. Since the worst possible casewill be when the pipe is empty, the equation reduces to:The outside surface pressure is assumed to be zero.(2.21)The design on an empty pipe string may seem excessive but it is done to eliminate consideration of triaxialforces produced by hole irregularities <strong>and</strong> other factors3 The worst possible case design, therefore,covers a multitude of other forces. Because of buoyancy produced by changes in axial loadfollowing setting of the cement, portions of the casing string may be in compression rather than tension.Casing above the point of zero axial tension has less collapse resistance, <strong>and</strong> casing below thepoint of zero axial tension has more collapse resistance since it is in compression. The collapse forceson a casing are usually visualized as being applied by the pressure of the mud in which the string is2-20
un. The effect of tension in reducing the collapse strength of the casing is generally considered, butthe effects of ballooning, ovality, <strong>and</strong> temperature changes during circulating are often neglected.These effects can be severe, especially in high collapse resistance casing such as some 95-grades.For the burst calculations, one of two API approved formulas may be used. For plain end (nonthreaded)pipe <strong>and</strong> pipe with premium couplings (couplings stronger than the pipe body), Barrow's formulais used.2 Y"tPv = 0.875-DO(2.22)where:PyY,Dot= minimum internal yield pressure, psi= minimum yield strength, psi= nominal outside diameter, in.= nominal wall thickness, in.The 0.875 factor allows for a 12.5% variation in wall thickness as permitted by API manufacturingspecifications.For threaded <strong>and</strong> coupled pipe, the internal yield is about the same as for plain end pipe, exceptwhere low clearance couplings are used or where the coupling has less strength than the tube. In thecase of lower strength couplings:Y,DoDi= minimum yield of coupling material, psi= nominal outside diameter of coupling, in.= diameter at root of coupling when pipe has been fully tightened.(2.23)The design for the upper part of the casing string is dominated by the burst consideration. The safetyaspect of controlling kicks <strong>and</strong> blowouts places a large amount of importance on controlling full wellpressure in the upper sections of the string. The worst case is when a blowout occurs <strong>and</strong> the holecontains only gas. The maximum surface pressure then is the maximum formation pressure minus thehydrostatic load created by gas. As a simplification, the mud hydrostatic pressure is taken as the reservoirpressure (unless the reservoir pressure in known).PsprnDtGg= maximum well shut-in pressure= density of mud, Ib/gal= depth of kick, ft= gas gradient, psi/ft (varies from 0.1 to 0.15 psi/ft based on pressure)(2.24)In most cases, the potential problem area will be at the casing shoe. The pressure at the shoe can becalculated from:2-21
‘bx = (2.25)Pbx = burst pressure exerted at depth D, psiQ = formation breakdown gradient, usually from 0.7 to 1 .O psi/ftD, = casing setting depth, ftD, = depth where fb, is being determined, ftTo determine the worst case burst pressure exerted during a blowout with gas in the hole, the externalpressure is subtracted from the previous equation.pbx = GbdDc- GgC D,-where po equals external fluid density in Ib/gal.Dx) - 0.052p,Dx(2.26)Burst force design may also be considered graphically, Figure 2.14.35Eqn. 2.26 can be used to make the start of the X diagram of Figure 2.1 5. The X diagram is constructedby collapse <strong>and</strong> burst calc~lations.’~~~~ The maximum burst line is drawn between the calculatedburst at the surface <strong>and</strong> the calculated burst at the casing shoe. The collapse line is drawnbetween U <strong>and</strong> the maximum collapse pressure at the casing shoe, calculated by Eqn. 2.24 or 2.25.Tension design is the last step for each section of the casing string. The top of each section should bechecked to see that the tensile ratings are not exceeded. The common safety factor is 1.6 to 1.8.When the tensile limits are exceeded, a change to a higher strength joint should be made. Tensionlimits may be gathered from a table of casing properties or calculated by dividing the API 5C3 valuefor joint strength by the safety factor.Example 2.2 - Single String Casing DesignDesign an economical casing string that will satisfy the pressure requirements of collapse <strong>and</strong> burst,<strong>and</strong> the load requirements of tensile force. Strings increase in cost with increasing grade <strong>and</strong> weight.A packer will be set within 100 ft of the bottom of the well. The string must be designed to allow packerrunning <strong>and</strong> setting. It must also allow efficient well operations. Design for an annulus full of mud <strong>and</strong>an empty string; these are the worst normal conditions.Casing Safety Factors: Collapse 1 .l, Burst 1.25, Tensile 1.7Data from Well file:A 10-3/4 in. surface string has been l<strong>and</strong>ed <strong>and</strong> cemented at 450 ft.Depth = 7600 ftMud wt = 12 Ib/galbit size = 8.75 in.Frac gradient = 0.77 psi/ftstraight gauge holeReservoir pressure = 0.56 psi/ftwater base mudBuoyancy Neutral Point for collapse calc.2-22
Bottom hole pressure = ( 12) (0.052) (7600 ft)Maximum collapse pressure (from the mud column) is:= 4742psiP = (12 lb/gal) (0.052 gal/in.2/ft) (7600 ft) = 4742 psi~ ~ X B H2-23
Pick a casing grade <strong>and</strong> weight that has a collapse rating in excess of [(4742) (1.1)] = 521 6 psi Thecasing data on size, weight, grade, burst, collapse, body tensile <strong>and</strong> joint tensile are obtained frompipe books. A partial table for 7 in. casing from one pipe manufacturer is shown in Figure 12.1 9.7.COO7.0007.0007.0007.0007.0007.0007.0007.00026.00 K55*26.00 C7526.00 N8O*26.00 L80*26.00 5595s26.00 595.26.00 CYS95*26.00 C95*26.00 PllO4320525054105410780078007800507062104980 4980 4980 49806790724072401240679072407240724067907240724072408600 8600 86008600 . 8600 8600860099508600996086009960364' 401 592489 631519 667511 641510 696602 747602 747593 122693 853415 -362566 -362604' -36260* -362601 -362717 -362717 -362117 -362830 -3626.276 6.1516.276 6.1516.276 6.1516.276 6.1516.276 6.1516.276 6.1516.276 6.1516.276 6.1516.276 6.1517.0007.0007.0007.0007.0007.0007. COO7.COO7.0007.00029.00 C7529.00 N00*29.00 LOO*29.00 SS95*29.00 S95*29.00 CYS95*29.00 C95+29.00 5105.29.00 PllO29.00 V15067607020702092009200920078209700851098007650816081608160969096909690969011220153007650 76508160 81608160 81608160 81609690 96909690 96909690 96909690 969011220 1122015300 15300562 707597 746587 718655 779692 036692 836C83 800721 859797 9551049 1243634 -408676 -408676 -408676 -408803 -408803 -408803 -408803 -400929 -4081267 -4086.184 6.0596.184 6.0596.184 6.0596.184 6.0596.184 6.0596.184 6.0596.184 6.0596.104 6.0596.184 6.0596.184 6.0597.0007.0007.0007.0007.0007.0007.0007.0007.000?.COO7.0007.0007.0007.0007.0007.0007.0007.0007. COO7.0007.0007.0007.0007.0007. coo7.0007.COO7.0007.0007.00032.00 C7532.00 N80*32.00 LEO*32.00 SS95*32.00 S95*32-00 CYS95S32.00 C95*32.00 S105*32.00 PllO32.00 V15035.00 C7535.00 N8O*35.00 100*35.00 SS95*35.00 S95*35.00 CYS95*35.00 C95*35.00 SlOS*35.00 PllO35.00 Vl5038.00 C7538.00 N8O*38.00 L8O*38.00 5595.38.00 595.38.00 CYS95*38.00 C95*38.00 S105*38-00 PllO38.00 V150823086008600104001040010400973011340107601302097101018010180116001160011600116401278013010162301068011390113901270012700127001342014040151101924084909060906090601076010760107601076012460169909340996099609960110301183011830118301369018670101201080010800108001282012820128201282014850202508490 79309060 84609060 04609060 846010760 1005010760 1005010760 1005010760 1005012460 1164016990 158708660 79309240 84609240 84609240 846010970 1005010970 1005010970 1005010970 1005012700 1164017320 158708660 79309240 84609240 84609240 046010970 1005010970 1005010970 1005010910 10050i2700 1164017320 15870633 779672 823661 791738 860779 922779 922768 812 891 947897 10531180 1370703 833746 076734 833819 876865 964865 964853 920901 . 964996 10961311 1402767 833814 876801 833894 876944 964944 964931 920, 983 9641087 i0961430 1402'699 -453745 .453745 -453745 .453885 -453985 .453805 -459885 .4531025 -4531398 -453763 -498814 -498814 -498814 .498966 -498966 -498966 -498966 .4901119 -4981526 -498822 -540877 -540877 -540077 -2401041 -5401041 -5401041 .5401041 -540I205 -5401644 -540(Lone Star Steel)Figure 2.19: Casing strength tables from one manufacturer.6.094 5.9696.094 5.9696.094 5.9696.094 5.9696.094 I 5.9696.094 5.9696.094 5.9695.094 5.9696.094 ' 5.9696.094 5.9696.004 , 5.8796.604 5.8796.004 5.8796.004 5.8796.004 5.8796.004 5.0796.004 5.8796.004 5.0796.004 5.8796.004 5.8795.920 5.7955.920 5.7955.920 5.7955.920 : 5.7955.920 5.7955.920 5.7955.920 5.7955.920 5.7955.920 5.7955.920 5.795The largest casing that can easily be run in the 8.75 in. hole is 7 in. To satisfy collapse pressurerequirements, pick 26 Ib/ft C-75 as a first choice, collapse = 5250 psi. The first casing will extend fromthe bottom of the well upwards to a point where a weaker (lower grade or lighter weight) <strong>and</strong> cheaperstring can be run. That point depends on the pressure rating of the second string. Several small jumpsin weight or grade can be made or just a few large changes. The route depends more on economics<strong>and</strong> inventory available than on a scientific selection process. Second casing pick is 23 Ib/ft C-75,collapse = 3770 psi derate for safety factor = [3770/1.l]= 3427 psi. How deep can the 23 Ib/ft casingbe set? D, = 3427/(12)(0.052) = 5492 ft.2-24
The 26 Iblft C-75 (the bottom string) has an initial design length of from 5492 ft to 7600 ft; however,the collapse rating of the upper string (the 23 Ib/ft C-75), must be derated for the effects of tensionsince it is above the neutral point. The 26 Ib/ft casing is not derated for collapse since maximum collapsepressure is exerted at the bottom of the well where the casing is below neutral point <strong>and</strong> in axialcompression (which opposes collapse forces).To derate the collapse rating of the upper string for effects of tension:1. Derate the set depth of 5492 ft slightly; typically 2% to 4% will do. 5400 ft will be used here.2. Calc. unit tensile stress, St = (6206 ft - 5400 ft) (26 Ib/ft) = 20,956 Ib.3. Axial load factor, X, = (20,956/499,000) = 0.042, derating factor, Yr, = 0.99 (from Figure 2.11)4. The derated collapse (for effects of tension) of the 23 Ib/ft = 3427 x 0.99 = 3392.5. Collapse pressure at 5400 ft = (5400)(12)(0.052) = 3370 psi.The 3370 psi collapse pressure is less than the 3392 psi collapse rating (derated for safety factor) onthe 23 Ib/ft pipe so the pick of 5400 ft as max set depth is a good one. The bottom of the 23 Ib/ft stringsets the top of the 26 lblft casing. The set points of the 26 Ib/ft are 7600 ft to 5400 ft.The lesser of the two will almost always be the difference of the pore pressure <strong>and</strong> the gas gradient. Inspecial cases where high stimulation pressures must be h<strong>and</strong>led, the stimulation pressure may beselected as the design criteria. Since the top of the 26 Ib/ft is above the neutral point, the burst designbegins to govern. The 23 lblft will also be checked for burst to see how shallow it can be safely set.For a burst design, a surface pressure is needed. Use lesser of:Max pressure at surface = frac press at bottom - gas grad.PSma= [(7600 ft)(0.77 psi/ft)-(7600)(0.1 psi/ft)] = (5852-760) = 5092 psiorMax pressure at surface = pore pressure - gas gradientPSm, = [(7600 ft)(O.56 psi/ft)-(7600)(0.1 psilft)] = 3496 psiSince the 3496 psi is the highest likely pressure while running pipe (before cementing), it will be usedfor my design. There will be many cases where the pore pressure is not known. In these cases, usethe mud weight to approximate the pore pressure.Burst Design (The burst rating of 23 Ib/ft C-75 = 5940 psi)The shallowest that the 23 Ib/ft can be set is:3496 - (594OD.25) - 3496 - 4752 < -Dx = (0.624 - 0.1 ) (0.524)Since the value of D, is less than zero, the 23 Ib/ft C-75 can be set to surface. The 23 Ib/ft C-75 runsfrom 5400 to 0.If the fracture breakdown pressure (with gas column) had been used,2-25
Ps,,= 5092 psi, the top of the 23 Ib/ft C-75 would have been 649 ft <strong>and</strong> 23 Ib/ft C-95 would haveneeded to reach to surface. Notice that a higher grade pipe was used rather than a heavier wall pipe.This allows a packer to be run from surface that would set in the 23 Ib/ft pipe. For some close clearancepackers, the packer for 23 Ib/ft may not be able to pass through even one joint of heavier wallpipethat was set at the top of the well.Tensile (uncorrected for buoyancy)Design0 - 5400 ft 23 Ib/ft C-755400 ft - 7600 ft 26 Ib/ft C-75Notice that the tensile calculations on the bottom most string only extend to the neutral point.An intermediate string is slightly different from a single production string since it may experience theburst pressures from deeper zones. Collapse forces may be felt as well if there is zone communicationbetween the interval below the intermediate string <strong>and</strong> any zone that contacts the outside of the intermediatestring. This problem is more fully addressed in the section on liners. Depending on the jobconditions <strong>and</strong> assumptions, a higher pore pressure in a lower zone may have to be used for burstcalculations. It is reasonable in most intermediate casing designs to verify that the burst rating (withsafety factor) is adequate for the mud from the lower zone. If the cement job extends along the fulllength of all strings, collapse or burst forces have much less effect.Example 2.3 - Casing Design - Intermediate StringGiven:13-3/8" surface casing at 2500 ft12-1/4" hole drilled to 9500 ftMud weight = 12 Ib/galFuture depth = 12,000 ft, future mud weight = 14.5 Ib/galFrac gradient @ 9500 ft, = 0.884 psi/ftDesign a 9-5/8" Intermediate StringAn intermediate string is slightly different from a production string since it will experience the collapse<strong>and</strong> burst forces encountered during the next deeper segment. If it is fully cemented, it is much lesslikely to fail, regardless of the pressure of produced fluid or the mud. Depending on conditions, the jobdesign may require the intermediate string to st<strong>and</strong> the pressures of the zone below, particularly theburst. Additionally, the mud weights inside <strong>and</strong> outside the string can be considered with the formulas.1. Determine max BHPBHP = (pd (0.052)(03 = (14.5) (0.052) (12,000) = 9048 psithe 12,000 ft depth is used to give a worst case2. Collapse resistance design <strong>and</strong> pressuresa. max. collapse pressure generated by mud wt. outside the pipe2-26
Pcx = Dx (0.052) po - Dx (0.052) p j + ( PO - P;)popiPOPi= mud density outside= mud density inside= external surf. press.= internal surf. press.pi = 0 since the csg is empty, PO = Pi since the top of the string is at the surface <strong>and</strong> csgemptyPcx = D, (0.052) po = (9500) (0.052) (12) = 5928 psib. Neutral point (point at which load goes from compression to tension). Note: this is onlyusable for casing collapse calculations.N.P. = D(1-&) = 9500( 1 - &) = (9500) (1 -0.183) = 7756 ftYou can round the 7756 value to 7760 to make calculations easier.c. Casing selection, select lightest, lowest grade. Use safety factor of 1.1 25 for collapse.(1) Pick 47 Ib/ft S-95, collapse = 71 00 psi, burst = 8150 psi, tension (joint) = 1,053,000 psiCollapse = 7100/1.125 = 6311 psi (derated) this satisfies Pcx(2) Pick next lower strength casing, 43-1/2 Ib/ft, col. = 5600, burst = 7510, tens. = 960,000Collapse = 5600/1.125 = 4977 psiNow:Calculate the maximum set depth for the 43-1/2 Ib/ft section. This depth sets the top of the47 Ib/ft section.PC =:Dx = 0.052 (12)49770.052 (12)= 7975 ftThe 47 Ib/ft casing runs from 9500 ft to 7975 ft.Since 7975 is below the neutral point of 7760, no correction is needed.To determine the top of the 43-112 Ib/ft casing string, the base of the next string must be selected.Select 40 Ib/ft S-95 collapse = 4230 psi, burst = 6820 psi, tension = 858,000 psi. Derated collapse =4230A.125 = 3760 psi, burst = 6820/1.125 = 6062 psi (both collapse <strong>and</strong> burst are derated by safetyfactor of 1.1 25.The maximum set depth is:Dx = PC/0.052po = 3760/ [ (0.052) (12) ] = 6025 ftSince this section will be above the neutral point, the effect of tension on collapse rating must be calculated2-27
1. Derate the 6025 ft value slightly, use 5900 ft as a first guess.2. Calculate a unit tensile stress.S, = (7760-5900) (43.5) 80,910 lbNote that the weight calculated is the 43-1/2 Ib/ft pipe, above the neutral point. This is the weight thatthe 40 Ib/ft pipe feels.3.80,910- 80’ = 0.074 [Note that tensile body strength is used‘R = tensile body strength 1, 088, 000here.]4. The derating factor, from Figure 2.11, is 0.975.5. The collapse, derated for tension, is Pc = (3760) (0.975) = 3666 psi.Calculate collapse pressure at 5900 ft.P, = DJO.052) (p,) = (5900) (0.059) (12) = 3681 psiThe guess of 5900 ft was a little too deep, but 15 psi difference is not excessive so we will keep the5900 ft depth.The 43-1/2 Ib/ft casing runs from 7975 ft to 5900 ft.6. Since it is above the neutral point, the burst design will dominate the casing selection. To startthe burst design, calculate a surface pressure that is the lesser of:a. Fracture gradient at the 9-5/8 in. casing shoe, less a gas gradient.b. Formation pressure in the future pay (at 12,000 ft), less a gas gradient. The maximum surfacepressure, P, that the frac gradient will support is:P, = Dtfg- DtGg = (9500) (0.88) - 9500 (0.1) = 7448 psiFor a calculation of the formation (pore) pressure’s effect on the surface pressure, use the pressureon the zone at 12,000 ft. Since all that was given is the mud weight, we use that as the formation pressuregradient. To get maximum surface pressure, subtract the gas gradient (times depth):Ps Df(pf) (0.052) -Df(O.l) (12,000) (14.5) (0.052) - (12,000) (0.1) 7848if this maximum pressure at the surface ever occurred, what would be the pressure at the shoe of the9-5/8 in. casing?2-28
P(at 9500 ft) = D,(p,) (0.052) - [ (0,- 0,) Gg]= [(12,000) (14.5) (0.052)] - [(12,000-9500) (O.l)]= 8798 or a gradient of 0.926 psi/ftSince the 8798 psi is above the pressure necessary to fracture the formation at the shoe of the 9-518 in., the surface pressure of 7848 psi would never occur. To proceed with burst design, use the surfacepressure of 7448 psi from the frac. gradient.The shallowest depth that a casing string can be set (limited by burst) comes from: Pbx = P, + GgDx -PO (0.052)(0x1‘bx = 7448 + (0.1) (0,) - (12) (0.052) (0,) 7448 + Dx (0.1 - 0.624)Q, =7448 - Pbx0.524The shallowest depth that the 40 Iblft pipe can be set is:D, =7448-6062 = 2645 ft0.524(6062 is the derated burst of the 40 lb/ft casing)as a check, the collapse pressure is:P, = (12) (0.052) (2645) = 1650 psi(the derated collapse was 3760 forthe 40 Ib/ft casing)The 40 lblft pipe runs from 5900 ft to 2645 ft.Since the 40 Ib/ft pipe cannot be run above 2645 ft, a stronger pipe is needed. Although 43-1/2 Ib/ftpipe would h<strong>and</strong>le the pressure, the smaller id would restrict the packer size that could be run below it,hence, a stronger grade of pipe (at 40 Ib/ft) is needed. Since the casing tables show that a 40 Ib/ft P-11 O is unavailable, the lower string design must be changed to 43-1/2 Ib/ft strings to allow a packer topass any section of the string <strong>and</strong> still be set in the bottom section. Select 43-1/2 Ib/ft P-11 0 for theupper section (collapse 4430 psi, burst 8700 psi, tension 1,106,000 Ib). This practical overriding of thedesign theory is very common, especially when higher grades are more available or occasionally moreeconomical.Burst = 8700/1.125 = 7733 psiD, =7448 - 7733
The 43-1/2 Ib/ft, P-110 can be run to surface.Check for tension designFinal DesignInterval0-14/51475-26452645-59005900-79757975-9500Wt Grade43.5 P-110 LI BC43.5 S-95 LT&C43.5 S-95 LT&C43.5 S-95 LT&C47 S-95 LT&CThe string from 2645 ft to 5900 ft would have been the 40 Ib/ft except that upper sections had to bethe heavier weight with smaller diameter to h<strong>and</strong>le the burst load. For packer access, the id of thestring must be at least as large at the top as it is in the sections below it.High Pressure <strong>Gas</strong>For purposes of simple calculations, the pressure exerted by the gas column is approximated by0.1 psi/ft. As pressure rises, gas density increases. In high pressure cases, the hydrostatic column ofgas can be substantial. The following graph, from the Baker Calculations H<strong>and</strong>book may be useful inmore closely estimating pressure. More exact figures are available from computer programs that usePVT data.Additional Graphical IllustrationsThe method of graphical illustration of collapse <strong>and</strong> burst used in Figures 2.13 <strong>and</strong> 2.14, can beextended to analysis of tension, Figure 2.1 6, the stresses involved in overpull, Figure 2.1 7, <strong>and</strong> buoyancy2.1 8. All these illustrations are from Hills <strong>and</strong> are the start of the X-diagram casing design process.Running The CasingDynamic loads from running casing into the well can be estimated with the following formula fromVreel<strong>and</strong>.Fm- Wvc = pC,A(2.27)2-30
Bottom-Hole Pressure1 for a Column of <strong>Gas</strong>eous Nitrogen-!-.-. ---700(EaU)U)2a500(3001< .200(1001II Temperature of Nltrogen atWellhead 70" Fahrenheit1000 2000 3000 4000 5000 6000 7000INitrogen Wellhead Pressure in PSIIGeothermal Gradient 1.6" FahrenheitIncrease Per 100 Feet of DepthI2-3 1
where:V, = critical velocityF,WpCOA= the force required to yield the casing= weight of casing hanging below the slips= mass per unit volume= speed of sound in the material == cross-sectional areaFor steel, pC, = &€= 150 lb-sec/h3For example, the load increment produced when 7 in. diameter, 29 Ib/ft casing is being lowered at3 ft/sec (12 seconds per 40 ft joint) <strong>and</strong> is stopped suddenly can be calculated by rearranging Eqns. 2<strong>and</strong> 3 to solve for a force, 6 applied at any casing running velocity, V:F=VpCdF = (36 in./sec) (150 Ib ~ec/in.~) (8.449 in.2)F = 46,000 IbThe force would be in addition to string tensile weights.Once a usable hole has been drilled, the casing string or liner is run to depth <strong>and</strong> cemented in place.Actual running of the string involves several operations to properly place the pipe <strong>and</strong> to avoid damagingthe well. Like any pipe or drill string run in the well, casing is susceptible to differential sticking. Tominimize the problem, mud conditioning <strong>and</strong> centralizers are used. In the case of differential sticking,the pull required to free differentially stuck pipe is:’9where:FAPAcCf= pulling force, Ib= differential pressure into the zone from the hole, psi= contact area of pipe <strong>and</strong> mud cake, in.2= coefficient of friction (avg. of 0.25 is normal)*(2.28)As seen from the formula, differential sticking force (equal in magnitude to F) is dependent upon thecontact area of the pipe <strong>and</strong> the mud cake <strong>and</strong> the mud weight. In a situation with 1.5 in. to 2 in. ofdiameter difference between pipe <strong>and</strong> hole, there is about 2 in. contact between the casing <strong>and</strong> themud cake. When the mud cake is thick <strong>and</strong> spongy or when clearances are very tight, contact crosssectionalarea may double.The force involved in differential sticking is illustrated in the following example. For a casing string runacross a series of permeable zones with a total zone thickness of 100 ft, the mud overbalance is4000 psi at a depth of 8000 ft with a mud weight of 11 Ib/gal against a pore pressure of 10.0 Ib/gal.APA,F= (8000)(11-10) (0.052) = 416 psi= (100x12~2)= 2400 in.*= (416 psi) (2400) (0.25) = 249,600 Ib2-32
Increased mud weight <strong>and</strong> increased contact area can significantly increase the differential stickingforce.The differential sticking force can be considerably lessened by the use of centralizers. Although centralizerscause an increase in drag in the casing <strong>and</strong> are often difficult to run in the well near the surface,Bowman <strong>and</strong> Sherer20*23 estimate that the increase in drag from running centralizers will be lessthan the weight of the casing over the zone where differential sticking is a problem. In the case of theprevious example, the air weight of a 100 ft section of the 8-5/8 in. casing (40 Ib/ft) is 4000 Ib. Thus, ifthe drag caused by centralizers over a 100 ft section were equal to the weight of the casing, theincrease in drag would be 4000 Ib or 1.6% of the differential sticking force. Such an analysis <strong>and</strong> anassociated estimate of cost savings is dependent on the zone of differential sticking being locatednear the bottom of the well. This would mean that only the section of casing to be l<strong>and</strong>ed across thezone would need to be centralized. In reality, the simple example provides a very low estimate of centralizerdrag since centralizers need to be run over the entire string <strong>and</strong> more densely on casing thatpasses intervals prone to differential sticking. Centralizers, however, are a necessary design item onmost strings <strong>and</strong> every effort should be made to run them. It is nearly impossible to differentially sticka casing string with centralizers on every joint2’ but field experience is that it may be difficult to runthat many in a hole with 2 in. or less clearance. Centralizers aid in getting the pipe to bottom, beingable to move the pipe <strong>and</strong> to improve chances of a successful primary cement job.The number of centralizers needed depends upon pipe <strong>and</strong> mud weight, hole deviation <strong>and</strong> hole condition.Calculation programs are available for centralizer spacing. The number of centralizers per jointdepends upon the lateral forces exerted by the weight of casing <strong>and</strong> casingIt is thisweight that forces the casing into the side of the hole. Obviously, the lateral force increases with casingweight, hole deviation angle, <strong>and</strong> weight differential between cement <strong>and</strong> mud while the cement isin the annulus. Occurrence of doglegs <strong>and</strong> other hole problems also influence the force on casing.The use of centralizers in soft or unconsolidated formations is very difficult since the centralizer bladesor springs will tend to imbed in the formation.The number of centralizers must be sufficient to offset the lateral force <strong>and</strong> position the casing nearthe middle of the hole.For the lowest possible drag while running pipe, it is important that the right number <strong>and</strong> type of centralizersbe run. Slim hole centralizers should be used in close-clearance holes. The strongest centralizersare full bodied types described in the chapter on Cementing. Necessary support equipmentincludes stop devices to keep the centralizers in place <strong>and</strong> avoid bunching them on the pipe by freesliding along the pipe at a bend or a point of close-clearance. Casing collars are usually used for stopdevices when only one centralizer per joint is needed. When more than one centralizer per joint isrequired or where a flush joint liner is used, stop devices must be added to position the centralizers.With the use of very hard grades of flush joint liners such as V-150, slip on stop devices, even thosewith set screws or slips may not work.Centralizers should not hinder the ability to move pipe during cementing: rather the centralizers preventthe sticking that hinders pipe movement. The inability to rotate some liners is often caused byinsufficient starting torque or increased torque as cement travels up the annulus.21 The followingexample of starting torque for a liner is taken directly from Lindsey.21“For example, assume a liner joint has a maximum allowable torque rating of 5500 ft-lb, <strong>and</strong>rotating drill pipe <strong>and</strong> liner before hanging requires a torque of 3500 ft-lb. After hanging theliner <strong>and</strong> releasing the setting tool, torque required to rotate only the drill pipe is 1000 ft-lb,<strong>and</strong> rotating drill pipe <strong>and</strong> liner totals 4200 ft-lb. To calculate maximum allowable surfacetorque, the torque required to rotate drill pipe only <strong>and</strong> the torque to overcome bearing frictionmust be added to the maximum permissible liner joint torque of 5500 ft-lb. In this case, it takes700 ft-lb (4200-3500) to overcome bearing friction, plus 1000 ft-lb to rotate only the drill string.All 1700 ft-lb of torque is above the top liner joint <strong>and</strong> must be added to the maximum permis-2-33
sible liner joint torque of 5500 ft-lb. Therefore, maximum allowable surface torque to initiaterotation, <strong>and</strong> for the duration of the job, is 7200 ft-lb - not 5500 ft-lb.”The torque to start rotation may approach the maximum but should reduce to a lesser value as thestring is rotated.20121The second torque factor increase, that of cement movement up the annulus will steadily increaserotating torque. The torque limit for the string being run should be known before the job. Torque is readfrom a torque indicator or estimated by the number of pipe turns to initiate downhole rotation.21The most successful methods of rotation are power swivels, rotary tables, <strong>and</strong> casing power tongs.The power swivels <strong>and</strong> rotary tables are the most reliable; casing power tongs are normally only usedfor joint makeup.Drilling a usable hole is vital to the use of centralizers. It is a high risk operation to run centralizers in ahole drilled without stabilizers. Bowman <strong>and</strong> Sherer20 give four reasons why liners (<strong>and</strong> other casingstrings) do not make it all the way to bottom:1. a usable hole was not drilled (the drift diameter is not equal to the bit diameter),2. differential sticking occurs because centralizers were not used,3. the wrong type centralizers <strong>and</strong> support equipment were used, <strong>and</strong>4. a dirty hole was drilled (one full of bridges or fill).Speed of running the string is a critical factor in formation damage since the casing is like a piston in acylinder with mud as the pressure seal. The pressures created by running casing can be easilyenough to fracture the formation <strong>and</strong> force mud into pay zones. Loss of mud in this manner will alsoreduce hydrostatic load <strong>and</strong> can cause a blowout. Safe running speeds on wells with normal clearances<strong>and</strong> low viscosity mud are 40 to 60 seconds per joint (equal or less than 1 ft/sec). Close clearancestrings or heavily gelled muds require longer run times.A procedure for actual running of a casing string is advanced by API Bulletin D-17, <strong>and</strong> was reportedby Bowman <strong>and</strong> Sherer.23Prior to running the casing, the hole should be cleaned by mud circulation with the bit on bottom <strong>and</strong> aconditioned mud with low solids content <strong>and</strong> low viscosity should be circulated into the hole. After thecasing is run, circulation of mud “bottoms up” at least twice is recommended. The mud circulation withthe casing in the well is necessary since velocity of the mud in the close-clearance annulus of the casing<strong>and</strong> hole will be much higher than with the drill string in the hole <strong>and</strong> more cuttings will be moved.If these cuttings are not removed, they may form bridges in the annulus, blocking or restricting cementflow.Casing String Design - Deviated WellsThe basic difference in casing design for a deviated well is the magnitude of the loads encountered inthe deviated or angle build section. This requires bending <strong>and</strong> torque considerations. Greenip offersthree major points for consideration:1. Axial <strong>and</strong> torque loads can be estimated by analyzing separate sections.2. Relationships can be developed for various parameters in casing string design.2-34
3. The pickup, set down, <strong>and</strong> neutral states produce sufficiently different loads <strong>and</strong> magnitudes toanalyze each separately.First, divide the string into three segments, (1) the extension or reach interval, (2) the build interval(containing the deviation) <strong>and</strong> (3) the vertical interval, Figure 2.20. As with conventional casingdesign, the casing in a horizontal well is designed from the bottom up. Interval (2), the build interval, issimplified by assuming the angle is constant. Interval (l), the extension or reach portion is assumed tobe a constant inclination. An example of the magnitude of the forces at pickup, neutral <strong>and</strong> set downare shown in Figure 2.21.-rPoint 3 -surface-Vertical intervalPoint 2 - KOPBuild intervalPoint 1TD \1(Greenip (Hydril) P.E.I. Dec. 1989)Figure2.20: On a deviated well, divide the well into threeareas: vertical, kickoff or build interval, <strong>and</strong>extended reach interval.Compression, 1 .OOO IbTension, 1,000 Ib-10 -5 0 5 10 15 20 25 30I . ITD = 6,400 MD= 0.35Build angle = 20"/100 nReach length = 2.000 RReach angle = 80'(Greenip (Hydril) P.E.I. Dec. 1989)Figure 2.21: The stress in the casing is most in the build section.Conditions are shown for set down, neutral <strong>and</strong>pickup.2-35
P, (13250) (0.052) (18.5) - (13250) (0.052) (8.3)P, = 6821 psiNP, = D(1- k)18.2 = 9563 ft65.4 65.4= 13250( 1 - -)The casing pick for lowest part of full string: Collapse minimum = (6821) (1.125) = 7674 psi satisfiedby 53.5 Ib/ft P-110(Note: st<strong>and</strong>ard casing design can be used to design the full string to surface, although it will not bedone here .)The first liner will be 6 48 in. Mud weight is 9.2 Ib/galP, = 14800 (0.052) (9.2) = 7080 psisatisfied by 28 Ib/ft N-80collapse minimum = (7080) (1.125) = 7965 psiNP, = 14800 1 -- = 12718 ft (above liner top)(The second liner will be 3-1/2 in. Mud weight is 15 Ib/gal.satisfied by a 9.2 Ib/gal P-110 (NE)Pcx = 15900 (0.052) ( 15) = 12402 psicollapse minimum = (12402) (1.125) = 13952 psiNP2 = 15900 1 -- = 12253 ft (above liner top)( 63Burst failure of liners is usually caused by kicks while drilling below a liner,39p40 pressure when fracturestimulating, or a tubing leak while producing a deep, high pressure zone. All these factors are madeworse by a poor cement job. Since filling the casing/openhole annulus with cement significantlystrengthens <strong>and</strong> supports the pipe, a good cement job over high pressure or earth movement zones isa requirement in any deep well.An illustration of the complications caused by a poor cement job 39*40 is illustrated in Figure 2.22. Aftera primary cement job on the 9-5/8 in. string, the 6-518 in. liner is run <strong>and</strong> a circulation cement job is initiated.The low pressure zone at 13,800 breaks down while cementing, returns are lost <strong>and</strong> thecement top peaks at 13,400 (Figure 2.23a). A top squeeze with cement seals the top of the liner butleaves an uncemented zone from 13,120 ft to 13,400 ft (Figure 2.23b). While drilling near TD to test adeep structure, the temperature of the mud goes from 270" (temp. of the zone at 15,400 ft) to the bot-2-37
tomhole temperature (at 18,500 ft) of 345°F. Since both ends of the liner are cemented, stress will beinduced by the temperature rise.12800 ft13100 ft14400 ft13800 ft14800 ft14-6 1bfgaL (0.759 pifEt)1yx, ftTD 18x0 ftFigure 2.22:An example of two liner design for a deep well. Thehigh pressure zone is isolated by the primary casingstring <strong>and</strong> the first liner covers the lost circulationzone at 13800 ft. The last liner is designed asthe production zone completion string. Cementingprovides pressure integrity <strong>and</strong> support.The amount of stress in fixed end casing isCJ = Ea(AT) = 200Twhere:oaEAT= stress, psi= coefficient of thermal expansion, 6.9 x 1 0-6 in./in./OF, for steel= Young's modulus, 30 x 1 O6 psi, for steel= increase in temperature, OFThe stress is compressional axial load that can cause pipe splitting or deformation, Figure 2.23~.Repair of the collapse may be made by running the 3-1/2 in. liner from above the first liner to TD,Figure 2.24.Liner Tie-BacksAlthough the liner completion described in Figure 2.22 may be used only as a liner, there are someconditions when the liner may be run back to surface. This liner tie-back may be temporary, to protect2-38
A9-5/8", 53.5 Ib/ft, P-110B6-5/8"20 Ib/ftN-80lb/pl (0.946 pi/ft)13120'b/gal (0.468 psi/ft)IFigure 2.23: The problem of an incomplete cement job on a deep liner below a high pressure zoneA. The initial primary circulation of cement on the liner breaks down the zone at 13800 ft<strong>and</strong> the final top of the cement is measured by a temperature log as 13400 ft.B. Top squeeze job seals the liner top but leaves a void from 13120 to 13400 ft behind the6-5/8'1 i ner.C. The shoe of the 9-518l casing leaks, allowing the high pressure zone at 13100 ft to pressureup outside of the 6-5/8". Deeper drilling increases mud temperature <strong>and</strong> results inhigher compressive stresses in the 6-518" liner. Combination of outside pressure <strong>and</strong> temperatureinduced stress causes collapse <strong>and</strong> split of the 6-518".permanent casing strings from wear during drilling4' or permanently, with cement, to strengthen thecasing string through a high pressure zone or isolate <strong>and</strong> stop a casing leak38 or a leaking liner top.42To allow a tie-back, most liners are equipped with a liner tie-back receptacle. The receptacle is aninternally polished receiver that will accept the seal assembly of the tie-back liner. The tie-back linerusually incorporates some type of cement port or sliding sleeve <strong>and</strong> seat that will allow cement to becirculated through to the annulus <strong>and</strong> up the annulus to surface. The seat, float equipment <strong>and</strong>lorplugs used in the cementing operation are of drillable material.CementingCementing a liner in place requires very closely controlled application of existing technology4s46 <strong>and</strong>a fair amount of risk. Three cementing methods are generally accepted for liners.47 Calculating thevolume of cement to be used in a liner cementing job is extremely difficult <strong>and</strong> requires more informationthan available from a simple caliper run. For maximum caliper information, a four arm devicecapable of determining elliptical holes should be utilized for hole volume. Cement excesses ofbetween 20% <strong>and</strong> 100% have been used on a number of liner jobs with larger excesses being responsiblefor better bonding <strong>and</strong> less channels. There is also a direct correlation with absence of channels<strong>and</strong> pipe movement. In liners of 500 ft or less, Bowman <strong>and</strong> Sherer4s46 recommend 100% excessover the calculated annular volume <strong>and</strong> on liners of 3000 ft or more at least a 30% excess is recommended.A single-stage cementing job in which cement is circulated to the top of a liner; much like a2-39
9-5/8", 53.5 lb/ft, P-1106-5/8", 28 Wft, N-803-1/2", 9.2 lb/ft, P-110Figure 2.24Collapsed area repaired by running a 3-112" . liner <strong>and</strong> cementing.primary cement job <strong>and</strong> may include pipe movement during cementing. A planned squeeze program inwhich the lower part of the liner is cemented <strong>and</strong> the top part of the liner is squeezed later. This techniquedoes not have good middle support <strong>and</strong> should not be used to isolate high pressure zones. Theprocedure is more widely followed in worldwide operations because of perceived problems of disengagingthe liner running assembly from the liner <strong>and</strong> of flash setting of cement. Disengaging from theliner before cementing eliminates the ability to move the liner <strong>and</strong> almost universally results in poorcement jobs.A third procedure commonly reserved for short liners is to fill part of the hole with cement <strong>and</strong> thenslowly run the casing string into the cement, forcing the cement to flow up around the pipe. While thismethod can be accomplished with the minimum amount of pumping, the lack of circulation can resultin poor removal of drilling mud. The technique is called a puddle job.Most liner jobs do not include plans to move the liner during the primary ~ementing.~~?~~ The reasonsfor this include:1. Detaching the drill pipe from the liner before cementing minimizes the risk of being unable todetach from the liner once the cement is in place.2. It may be necessary to change to a higher strength drillstring to allow pipe movement.3. Movement may cause the liner hanger to become tangled with the centralizers near the top ofthe string.4. Swab or surge pressures may be created during liner movement, especially in close tolerancewellbores.2-40
5. Movement of the liner during cementing may knock off debris from the borehole wall. The debrismay cause bridges <strong>and</strong> reduce the possibility of circulating cement.Despite the quoted disadvantages of staying attached during the cementing operation, Bowman <strong>and</strong>Sherer4346 site several serious disadvantages with releasing the liner before cementing.1. If the liner is hung off, the small bypass area around the liner offers a greater restriction to flow<strong>and</strong> causes more lost circulation because of the backpressure on the flowing cement.2. If a downhole rotating liner hanger is used (rotation only), additional torque is required to initiaterotation to overcome bearing friction. Pipe often rotates easier when it is being raised or lowered.The difference in torque required is often substantial.3. The potential for sloughing shale <strong>and</strong> annulus bridging is lessened when the operator can alternatebetween rotation <strong>and</strong> reciprocation.4. Premature shearing of the pins in the liner-wiper plug is less likely because there is no relativemovement between the liner <strong>and</strong> the setting tool (these two pieces of equipment movetogether). 495. If cement channels <strong>and</strong> there is a large hydrostatic pressure difference between inside <strong>and</strong> outsideof the running tools, the cups or seals can give way before cementing of the liner is complete.6. The displacement efficiency of cement around the tubulars when pipe is not moved is lessened.When liners are close clearance, then the density differences between mud <strong>and</strong> cement should be asclose as possible. This negates the advantages of hole cleaning by higher density cement. Reciprocation4’of the string is helpful because it produces lateral pipe movement that causes the pipe tochange sides in the wellbore while it is alternately compressed <strong>and</strong> stretched (slacked off <strong>and</strong> pickedup).43 R o t a t i ~ helps n ~ by ~ ~ mixing ~ ~ the ~ ~ cement into wellbore irregularities <strong>and</strong> displacing mud dueto drag forces produced by the flowing cement.43Although liner movement should be a goal in any liner operation, well conditions may prevent any typeof movement. In many cases, however, liner movement can be achieved in a well conditioned hole.Two clear cases where liner should not be moved are:431. When a short or small liner (3-1/2 in. or smaller) is run in a deep well, the liner should be hung offfirst since it may be impossible to tell from the weight indicator whether the liner had beenreleased from the drill pipe.2. In cases of hole deviation over 35O, reciprocation may be difficult due to high drag forces.Many of the problems in liner running can be lessened by drilling a usable hole. Problems with keyseats,ledges, washouts, <strong>and</strong> other nongauge problems intensify when close tolerance liners are to berun. For additional information on problems involved in drilling a usable hole, refer to the chapter onDrilling The Pay.When cement is circulated from the liner bottom to over the liner top, the cement must remain fluidlong enough to detach from the liner <strong>and</strong> to circulate the cement from the well or to pull up above thetop of the cement with the drillstring. If the cement flash sets, then the drillstring will become cementedin place <strong>and</strong> the hole most likely will be lost. Cement may prematurely set, thicken, or cement circulationmay be lost for a number of reasons.2-41
1. Improper thickening or pump times caused by a poor design, ineffective field operations, or badtest results.2. Poor density control on the cement or poor mixing of the cement at the surface.,3. Bridging in the annulus caused by a buildup of cuttings. This is caused typically by the increasednumber of particles picked up by higher annular velocities with a liner in the hole (due to itslarger ID) than around the drillstring.4. Plugging from dehydration of cement caused by excessive water loss in openhole sectionsbelow the overlap.5. Increased hole cleaning of the cement as compared to4he drilling mud.One of the most troublesome problems in cementing design is inadequate hole cleaning prior tocementing. This is especially true when light weight, low viscosity muds are used <strong>and</strong> little attention ispaid to cuttings removal. Heaving shales are also a problem in hole fill <strong>and</strong> may cause washouts.Under no circumstances should circulation be halted with the liner in the hole before all of the cementhas been displaced. Due to the small clearances <strong>and</strong> the yield point of cement, it may be very difficultto start circulation again.Problems1. For a 16,000 ft string of 5-1/2 in., 20 Iblft, C-75, calculate the final hook load at the end of thecement job when 16 Ib/gal cement is in the annulus to surface <strong>and</strong> a 10.5 Ib/gal mud is inside thecasing. Surface pressure on the mud in the casing will be 500 psi.2. A 5000 ft, 4-1/2 in., 10.5 Ib/ft, K-55 liner is run on 3-1/2 in., 13. Ib/ft drill pipe. The liner top is at12,500 ft. Calculate maximum hook load in a 15 Ib/gal mud if the drill pipe <strong>and</strong> liner are filled withmud.3. Calculate the weight of mud that will just balance the weight (float) of a 5000 ft string of 10-3/4 in., 40.5 Ib/ft, K-55 casing string if the string is run empty (neglect wt. of air).<strong>References</strong>1. Buzarde, L. L., Jr., Kastor, R. L., Bell, W. T., DePriester, C. L.: “Production Operations Course 1.- Well Completions,” SPE, 1972.2. <strong>Oil</strong> & <strong>Gas</strong> Journal Tables.3. Bollfrass, C. A.: “Sealing Tubular Connections,” J. Pet. Tech., (June 1985), pp. 955-965.4. Goins, W. C., Jr., Collings, B. J., O’Brien, T. B.: “A New Approach to Tubular String Design,Part 1 ,” World <strong>Oil</strong>, (Nov. 1965).5. Goins, W. C., Jr., Collings, B. J., O’Brien, T. B.: “A New Approach to Tubular String Design,Part 2,” World <strong>Oil</strong>, (Dec. 1965), pp. 83-88.6. Klementich, E. F., Jellison, M. J.: “A Service Life Model for Casing Strings,” SPE Drilling <strong>Engineering</strong>,(April 1986), pp. 141 -152.7. Rike, E. A., Bryant, G. A., Williams, S. D.: “Success in Prevention of Casing Failures OppositeSalts, Little Knife Field, North Dakota,” SPE Drilling <strong>Engineering</strong>, (April 1986), pp. 131-1 40.2-42
8. Greer, J. B., Holl<strong>and</strong>, W. E.: “High-Strength Heavy-Wall Casing for Deep, Sour <strong>Gas</strong> Wells,” J.Pet. Tech. (Dec. 1981), pp. 2389-2398.9. Wooley, G. R., Prachner, W.: “Reservoir Compaction Loads on Casing <strong>and</strong> Liners,” SPE Production<strong>Engineering</strong>, (Feb. 1988), pp. 96-1 02.10. Holliday, G. H.: “Calculation of Allowable Maximum Casing Temperature to Prevent Tension Failuresin Thermal Wells,” ASME 69-Pet-10, Tulsa, Sept. 21 -25, 1969.11. Pattillo, P. D., Huang, N. C.: “The Effect of Axial Load on Casing Collapse,” J. Pet. Tech., (Jan.1982), pp. 159-1 64.12. Durham, K. S.: “How to Prevent Deep Well Liner Failure, Part 2,” World <strong>Oil</strong>, Nov. 1987.13. Lubinski, A., Althouse, W. S., Logan, J. L.: “Helical Buckling of Tubing Sealed in Packers,”Trans.AIME, June 1962, p. 655.14. Rabia, H.: Fundamentals of Casing Design, Graham 8t Trotman, 1987, Boston.15. API Bulletin 5C3: “Formulas <strong>and</strong> Calculations for Casing, Tubing, Drillpipe, <strong>and</strong> Line-Pipe Properties,”American <strong>Petroleum</strong> Institute, (1 983).16. API Specification 5A: “Specifications for Casing, Tubing <strong>and</strong> Drillpipe,” American <strong>Petroleum</strong>Institute, (1982).17. Halliburton Modern Well Completion Course.18. Woodlan, B., Powell, G. E.: “Graphical Method Speeds Deviated Well Design,” World <strong>Oil</strong>,(Feb. 1, 1975) pp. 40-43.19. Wojtanowics, A. K., Maidla, E. E.: “Minimum Cost Casing Design for Vertical <strong>and</strong> DirectionalWells,” J. Pet. Tech. (Oct. 1987), pp. 1269-1282.20. Bowman, G. R., Sherer, B.: “How to Run <strong>and</strong> Cement Liners, Pt. 3,” World <strong>Oil</strong>, (May 1988),pp. 58-66.21. Lindsey, H. E., Jr., “Rotate Liners for a Successful Cement Job,’’ World <strong>Oil</strong>, (Oct. 1986), pp. 39-43.22. API Bulletin 5C-1.23. Bowman, G. R., Sherer, B.: “How to Run <strong>and</strong> Cement Liners, Pt. 4,” World <strong>Oil</strong>, (July 88), pp. 84-88.24. Lee, H. K., Smith, R. C., Tighe, R. E.: “Optimal Spacing for Casing Centralizers, SPE Drilling<strong>Engineering</strong>, (April 1986), pp. 122-1 30.25. “API Specification for Casing Centralizers,” API Specification IOD, second edition, API, Dallas(1 973).26. Myers, G. M., Sutko, A. A.: “The Development <strong>and</strong> Application of a Method for Calculating theForces on Casing Centralizer,” paper 851 -42-H, presented at the 1968 API Spring Meeting of theMid-Continent Dist., Amarillo, TX, April 3-5, 1968.2-43
27. Lubinski, A.: “Maximum Permissible Dog-Legs in Rotary Boreholes,” J. Pet. Tech. (Feb. 1961),pp. 175-194.28. Lubinski, A.: “How to Spot Dog-Legs Easily,” <strong>Oil</strong> <strong>and</strong> <strong>Gas</strong> J., (Feb. 4, 1957), 129-1 33.29. Hammerlindl, D. J.: “Basic Fluid <strong>and</strong> Pressure Forces on <strong>Oil</strong>well Tubulars,” J.P.T., (Jan. 1980),pp 153-159.30. Love, A. E. H.: A Treatise on the Mathematical Theory of Elasticity, 4th ed., Dover Publications,NY (1944), p. 144.31. Klinkenberg, A.: “The Neutral Zones in Drill Pipe <strong>and</strong> Casing <strong>and</strong> Their Significance in Relationto Buckling <strong>and</strong> Collapse.32. Lubinski, A., Althouse, W. S., Logan, J. L.: “Helical Buckling of Tubing Sealed in Packers,” J.Pet. Tech. (June 1962), pp. 655-670.33. Hammerlindl, D. J.: “Movement, Forces <strong>and</strong> Stresses Associated with Combination TubingStrings Sealed in Packers,” J. Pet. Tech. (Feb. 1977), pp. 195-208.34. Woods, H. B.: “Discussion of The Neutral Zones in Drill Pipe <strong>and</strong> Casing by Klinkenberg,” API(1951), pp 65-76.35. Hills, J.O.: “A Review of Casing String Design Principles <strong>and</strong> Practice,” API Production Practices,1951.36. Greenip, J. F., Jr.: “How to Design Casing Strings for Horizontal Wells,” Pet. Eng. Intl., (Dec1989), pp. 34-38.37. World <strong>Oil</strong> Tubing Tables.38. Linsey, H. E., Jr.; “Techniques for Liner Te-Back Cementing,” Production Operations, 1979,pp. 37-39.39. Durham, K. S.; “How to Prevent Deep-Well Liner Failure,” World <strong>Oil</strong>, (October 1987), pp. 46-50.40. Durham, K. S.; “How to Prevent Deep-Well Liner Failure,” World <strong>Oil</strong>, (November 1987), pp. 47-49.41. Manley, D. D.; “Installation of Retrievable Liners,” SPE 17523, Rocky Mountain Regional,Casper, May 11-13, 1988.42. Agnen, J. W., Klein, R. S.; “The Leaking Liner Top,” SPE 12614, SPE Deep Drilling <strong>and</strong> ProductionSymposium, Amarillo, April 1-3, 1984.43. Bowman, G. R., Sherer, B.; “How to Run <strong>and</strong> Cement Liners, Part 1 ,” World <strong>Oil</strong>, (March 1988),pp. 38-45.44. Bowman, G. R., Sherer, B.; “How to Run <strong>and</strong> Cement Liners, Part 2,” World <strong>Oil</strong>, (May 1988),pp. 58-66.45. Bowman, G. R., Sherer, B.; “How to Run <strong>and</strong> Cement Liners, Part 3,” World <strong>Oil</strong> (June 1988),pp. 55-58.2-44
46. Bowman, G. R., Sherer, B.; “How to Run <strong>and</strong> Cement Liners, Part 4,” World <strong>Oil</strong>, (July 1988),pp. 84-88.47. Linsey, H. E.; “New Tools Make Liner Rotation During Cementing Practical,” World <strong>Oil</strong>, (October1981).48. Linsey, H. E., Jr.; “Rotate Liners for a Successful Cement Job,” World <strong>Oil</strong>, (October 1986),pp. 39-43.49. Howell, F. R.; “Liner Reciprocation While Cementing,” Drilling-DCW, July 1979.50. Arceneaux, M. A., Smith, R. L.; “Liner Rotation While Cementing: An Operators Experience inSouth Texas,” SPE/IADC 13448, New Orleans, March 6-8, 1985.51. Lindsey, H. E., Durham, K. S.; “Field Results of Liner Rotation During Cementing,” SPE 13047,Houston, Sept. 16-1 9, 1984.52. Garcia, J. A.; “Rotating Liner Hangers Helps Solve Cementing Problems,” <strong>Petroleum</strong> EngineerInternational, (Sept. 19851, pp. 38-48.Other <strong>References</strong>1. Arceneaux, M. A.; “Liner Operations Made Easy,” Pet. Eng. Intl. (Sept. 1966).2. Goins, W. C.; “Better Underst<strong>and</strong>ing Prevents Tubular Buckling Problems,” World <strong>Oil</strong>, (Feb.1 980).3. Short, J. A.; “Drilling <strong>and</strong> Casing Operations,” Penn Well Publishing Co., 1982.4. Haut, R. C., Crook, R. J.; “Primary Cementing: The Mud Displacement Process,” SPE 8253, LasVegas, Sept. 23-26, 1979.5. Clark, C. R., Carter, L. G.; “Mud Displacement with Cement Slurries,” J. Pet. Tech., (July 1973),p. 775-783.2-45
Appendix 2.AIn the following explanation of buoyancy <strong>and</strong> neutral point, the explanation of Hammerlind129 is usedhere almost in its entirety as he explains the concepts <strong>and</strong> formulas advanced by Lubinski13 <strong>and</strong> Hammerlindl.29A tube hanging free in a well exerts its full weight at the surface slips. If the hole is partially or completelyfilled with liquid, there will be less weight for the same string since the liquid will exert a buoyantforce on the pipe. In Figure 2.8a (from Hammerlindl, 1980), the tube is supported only at thesurface (no liquid in the hole) <strong>and</strong> the stress distribution in the absence of liquid is shown inFigure 20.20b. Since the only support is at the surface, the neutral point is at the bottom of the string.Without fluid, the axial stress, oat may be calculated at any point “x” above the bottom of the tube by:where W, is the average wt (in air) per unit length <strong>and</strong> A, is the cross sectional area of tubing wall.The 0, curve in Figure 2.8b connects the peak tensile surface load produced by the weight of the tubewith the “ 0 dividing line separating surface compression <strong>and</strong> tension forces,The radial stress, CJ,,in the tube at any point is:32where:piPerirerd= pressure inside tube at desired depth, psi= pressure outside tube at desired depth, psi= internal radius of tube, in= external radius of tube, in= radial distance to point under consideration, inIn the case of the tube hanging free, there is no liquid inside or outside the tube, so the radial stress iszero.The tangential stress, at any point, is: For the case of no liquid, the tangential stress is also zero.In the previous formulas, a negative value indicates a tensile force while a positive value shows compression.The direction of the stresses <strong>and</strong> their position on the pipe is shown in Figure 2.9.According to the Archimedes principle, a body submerged in fluid exerts <strong>and</strong> upward force, Fb, equalto the weight of the volume, V; of fluid of density p displaced by the body or Fb = p V.If the tube has a constant cross section, then the volume may be replaced by immersed tube length, L,<strong>and</strong> the tube cross section A,2.A-46
since density (expressed as a gradient) times length is pressure, p, the equation becomes:where pis the upward pressure exerted on the end of the pipe. This pressure is a compressive force<strong>and</strong> shifts the loads in the stress distribution diagram to a positive shown by Figure 2.8~.The fluid in which the tube is suspended, creates a stress at every point equal to the correspondingpressure at that point. This assumes the fluid inside <strong>and</strong> outside the tube is the same. The axial stressequation is then modified to include buoyancy:At this point, the liquid is inside <strong>and</strong> outside the tube <strong>and</strong> radial <strong>and</strong> tangential stresses become important.These stresses are equal to a pressure p’ <strong>and</strong> p’ = p/-p;. At a distance x above the bottom of atube of length L,P= P,+p(L-X)where P, is the surface pressure (if any). Hammerlindl points out that by substituting Pfor Pi for P,’ inthe equations for radial <strong>and</strong> tangential stress, or= at = P (some works use a -P depending on directionof force or pressure). This shows that stress is equal to the pressure at the point of interest.The difference in stress distribution with <strong>and</strong> without fluid is seen in Figures 2.8b <strong>and</strong> 2.8~. The differences(from Hammerlindl) are:1. The lower end of the tube is now in compression.2. The radial <strong>and</strong> tangential stresses equal the fluid hydrostatic pressure.3. The tensile stress at the top is reduced by an amount equal to the fluid exerted stress at the bottom.Static fluids exert a force only in a direction normal to a surface. For the case of a constant diametervertical tube, the upward force of buoyancy is exerted only at the bottom. This is a concentrated force.If a compressive or tensile force, F; is applied at the lower end of the tube, (same fluid inside <strong>and</strong> out)the axial stress distribution is changed <strong>and</strong>
line separating compressive <strong>and</strong> tensile loads.33 This is true because 08 = of = 0; at the neutral point<strong>and</strong> thus o, must equal the full hydrostatic load. This can only occur at the bottom of the tube. Thebottom end of the oa line is displaced from the “ 0 line, first by the magnitude of the pressure (this setsthe end of the o,, of line <strong>and</strong> then by the applied force to set the end of the 0, line. The direction of displacementis consistent with the sign of the pressure or force.In the absence of liquid in the hole, the neutral point is the point of zero axial stress. Since at the neutralpoint 6, = or= og the only point where they may equal zero is the bottom of the tube.In the cases where there is an applied force, F; the neutral point may be shifted up the hole as shownin Figures 2.8d <strong>and</strong> 2.8e. A comparison of the neutral point location shows a considerable differencein location of the neutral point caused by the fluid. With fluid in the hole, the radial, ob <strong>and</strong> tangential,og stresses are no longer zero. They reach a maximum at the bottom <strong>and</strong> decrease toward a minimumat the top of the fluid column. Since the three stresses are equal at the neutral point, the neutral pointis shifted up the hole. This is not due to buoyancy but due to the effect of fluid pressure on stability.The neutral point is located byWhen fluid of different densities are inside <strong>and</strong> outside the tubing, the neutral point is described by?<strong>and</strong> the neutral point is2.A-48
Appendix 2.B - API Casing Design ExampleDetermine the collapse resistance of a casing string when1. the casing has no tension applied (oa = 0)2. the casing has an axial load of 215,000 Ib.Given:Casing 10-3/4,51 Ib/ft, C-75id = 9.850 in., YP (body) = 1,092,000 Ib, For oa = 0, Ypa = 0Converting YPin Ib into psi:YP(body) = l,092,0OO/((d4) (1 0.7s2 - 9.850)2)) = 74,993 psiDiameter over thickness (wall) is:D/t = 10.75/(0.9/2) = 23.9Since the casing is under no load, the mode of failure may be obtained from Figure 2.12. The Dltratioof 23.9 falls in the range of Figure 2.9b, transition collapse. This means that the collapse resistanceequation is:P, = (&-G)YPWhen calculating values of A <strong>and</strong> B for calculation of F<strong>and</strong> G, use the YP expressed in psi.From the calculationsA = 3.00B = 0.0643 B/A2 + BIA= 0.0317F = 1.99G = 0.042If tabulated ranges for Dltare not available, the Dlt range equations from Figure 2.12 may be solved tospecify the proper equation to use. In this caseP, = (1.99 - 0.042 74,933 = 3094 psi23.9The 3094 psi value compares to the book collapse resistance of 31 00 psi. For part b, with an axialload of 21 5,000 psi:2.B-49
- axial load - 215,000 psiOa Cross sect. area (d4) ( 10.752 - 9.8502)= 14,765 psiYpa = ( (1 - 0.75 (14,765/74,993) 2, 1’2 - 0.4 (14,765 psi/74,993) ) 74,993Ypa = 66,512 psiThe values A to G are calculated using the reduced yield strength.A = 2.99B = 0.059 F = 1.963B’A = 0.02932+ BIA<strong>and</strong>F = 1.96G = 0.039pt= ( 23.9- lSg6 0.039)66,512 = 2861 psiThe reduction in collapse strength by 233 psi (7.5% of initial) may be significant in some projectswhere collapse forces are near the maximum of an unstressed casing.2.B-50
Appendix 2.CThe lateral load on a centralizer, from API Specification 1 O06p7 is:’‘I-Wsjsinej+ wsi+ ,sinej++ 27sir16~C0Sbi<strong>and</strong> the tensile force of pipe hanging below the centralizer is:Tj = COS^Tj- 1 sisin 8+ wspse + w- (tantji- tan?ji-21where:NiWSiOiT= Incremental lateral load or force on a centralizer Ibf/in.= Casing weight, Ib/ft= Incremental centralizer spacing or casing length between centralizers, inch= Incremental hole inclination at centralizer, degrees= Tension of pipe hanging below centralizer, Ib= One-half of the change in angle between centralizersat 6, Ni = W, sin@ + 2 q sinbi<strong>and</strong> Ti= Tkl + W, cosOiIf the borehole changes angle rapidly, the hole has a “dogleg.” The incidence of doglegs significantlyincrease the load. The term “dogleg” refers to a change in hole angle <strong>and</strong> hole direction; this is a 3-Dcurve.Hole curvature is determined by:26 = 2 arc sin [ sin2 ( y) - + sin( y)sinei. sinei-1L~binski~~i~~ referred the hole curvature to a st<strong>and</strong>ard 100 ft length to define dogleg severity. Totalhole angle 26 <strong>and</strong> the radius of the hole curvature rare interrelated by the following equation.LetAL= r-26Then2.C-5 1
26 (100)~DLS = AL<strong>and</strong>where:ljDLS = the dogleg severity in the half angle 6AL = the length between survey pointsThe 3-D effect of the borehole curvature increases the lateral load on the centralizers. If the effect isignored, too few centralizers will be used. With the 3-D effect, an effective load is calculated. Theeffective load, N, is defined as the root mean square of gravitational, hole-curvature, <strong>and</strong> axial-loadforces.<strong>and</strong>We = ( Fb) ( W,> (s) sineT, = 2Tsin6The maximum deflection, ymm, or the sag of the casing between the centralizers is at the midp~int.~LJ<strong>and</strong>where:s= centralizer spacing in.2.C-52
EI= Young’s modulus, 30~10~ psi= moment of inertia for the casing string, in.4With the preceding equations, it is possible to calculate centralizer load <strong>and</strong> the centralizer spacing atany point along the string as long as sufficient hole deviation survey information exists for the task.Because of the many values involved, most spacing calculations are done by computer program.2.C-53
Appendix 2.DCasing Horizontal WellsReach IntervalIn the highly deviated section, weight does not play the same role as in a vertical well. The act ofpushing the casing in this section generates a friction force that is in the opposite direction of pipemovement. This force iswhere:dF = (w) (BF) (cose) f (p) (W) (BF) (sine)W = nominal pipe weight/ftBF = buoyancy factor0 = inclination anglep = coefficient of frictiondF = incremental tensionAt the top of the constant inclination reach section, the tension is:where:L = reach interval lengthf1 = tension at the top of the intervalWhile running the string in (setting down on the string), the friction acts to reduce the overall tension:For a 4000 ft (measured depth) kickoff point (KOP), Figure 2.20, with a build angle of 20°/1 00 ft, aninclination in the reach section of 80°, a reach length of 2000 ft, pipe size of 5-1/2 in. (17 Ib/ft), coefficientof friction of 0.35 <strong>and</strong> a mud weight of 9 Ib/gal:BF= 1-(9 lb/gal) x (7.48 gal/ft3)(489.5 lb/ft3)= 0.86Fl = 2000 [ (17) (0.86) (cos80) - (0.35) (17) (0.86) (sin80) ] = 5001 lbSince the sign is negative, a 5000 Ib compressive force must be applied at the top of the reach intervalto push the pipe to the full 2000 ft. The force required would start at 0 <strong>and</strong> increase to the full 5000 Ibas the pipe reached the end of the run.The string is usually picked-up after reaching bottom. This action reverses the friction direction. Thetotal tension is:2.D-54
F, = 2000 [ (17) (0.86) (COS80) - (0.35) (17) (0.86) (sin80) ] = 15,156 lbThe load would be felt at the top of the section with the full column of pipe in the reach section. Putanother way, it requires 5000 Ib of force to push the pipe <strong>and</strong> 15,156 Ib to pull the pipe. At any loadbetween these two figures, the pipe does not move.In this wide range of loads where there is no pipe movement, there may still be a tension at the top ofthe section. At the balance point; friction is zero (no tendency toward movement) <strong>and</strong> the tension is:F, = 2000 [ (17) (0.86) (COS8O) ] = 5077 lbRotation <strong>and</strong> TorqueIf rotation is used during placement or cementing, the torque should be estimated. The torque is afunction of the normal force between pipe <strong>and</strong> open hole, the coefficient of friction <strong>and</strong> the pipe radius.Using pipe body outside diameter, OD, the incremental torque isdM = (p) (W) (BF) (sine) (00)/2In the constant inclination reach section, the rate of torque increase rises with length. The torque, M,,at the top of the section is:M, = (p) (w) (BF) (sine) (L) (OD)/24ft-lbfor the full 2000 ft of casing:M, = (0.35) (17) (0.86) (sin80) (2000) (5.5)/24 = 2310 ft-lbA lower torque may rotate the string if it were being simultaneously picked up or lowered.The Build intervalUnlike the reach interval, loads in the build interval do not change linearly with measured depth. Theincremental tension, dFf, is a function of the normal force, which is a function of the tension, the inclination<strong>and</strong> the build angle.dFf = (w) (BF) (Cose) f (p) (Fn)<strong>and</strong>, Fn, the normal force, is:Fn = ([(Ff) (da)(sine)l2+ (Ff)(do)- [(w> (BF)(sine)]2}0.5where:Ff= tension2.D-55
da = incremental change in a azimuth&I = incremental change in inclination angleIf the change in azimuth is zero: Fn is simplified to:Fn = [ (Ff)(do)- (W) (5171(sine)]The effect of pickup <strong>and</strong> set down on tension in the build section has the same force effect as it did inthe reach section, it opposes the moving force.Because simultaneous equations are solved for Ff, the program is usually h<strong>and</strong>led on a computer. Inthe example here, the tension at the KOP in Figure 2.1 9, can be calculated. For pickup where Fl =15,156 Ib (at the top of reach section), F2 = 28,100 ft (in 400 ft). This is a 32 Ib/ft average rate ofincrease <strong>and</strong> considerable higher than the 14.6 Ib/ft buoyed weight <strong>and</strong> gives an indication of the dragin this section. The rate of increase is not constant, but increases as the KOPpoint is neared. At theKOF the rate of tension increase is 50 Ib/ft in this example.For the compression at Point 1 of -5000 Ib (F1 = -5000 Ib), the set down load is F2 = -4800 Ib.In Figure 2.20, Greenip illustrates the magnitude of tension <strong>and</strong> compression forces in the build <strong>and</strong>reach intervals. Note that the maximum compressional force occurs at about midpoint in the buildinterval. In this example, the maximum compressional force is about 5800 Ib. While not excessive, thisforce does show that intermediate calculations are needed. For the condition of Fl = 5100 Ib (neutralrange), the load at point 2 is F2 = 9200 Ib (from Figure 2.19).Since the torque at point 2 is also a function of the changing normal force in the build interval, its calculationis also done on the computer. Maximum torque would occur when there is no axial movement(in <strong>and</strong> out). This could occur during cementing with rotation but no reciprocation. For the neutralstate, using a value of 2310 ft-lb at point 1 (Ml = 2310 ft-lb), M2 = 2800 ft-lb. Setting down on the pipe(during wash downs) may increase torque load.In the vertical section of the hole, the torque is usually ignored <strong>and</strong> M3 z M2.The program calculations assume that rotation <strong>and</strong> axial drag are independent of each other. In thereal case, rotation will reduce axial drag <strong>and</strong> make pipe movement easier either running in or out ofthe hole. Since the program ignores the effect, the calculations are conservative.Bending StressThe bending stress occurs only at locations within the casing string where there is a change in borehole angle. The maximum bending stresses occur in the build section of the hole. These stresses maydominate the design, especially where the build angle is high. For a given build angle BA, the bendingstress, Sb, in the pipe body is given by:Sb = k(211) (00)(BA) psiSince the bending stress occurs only where there is a change in hole angle, there is no current bendingstress in the constant inclination reach section. The pipe in the reach section must be designed forbending stress since it must pass through the build angle. In passing through a deviated section, atensile force on one side of the pipe body <strong>and</strong> a compressive load on the other (Figure 2.1 0) is created.For design, bending stress is converted into tensile <strong>and</strong> compressive loads, Fb. This is accomplishedby:2.D-56
Fb = (Sb) (Ap)The axial force, Fb, either positive or negative, is matched to the stress, Sb, in a pipe body OD using apipe body area of Ap.In this example:<strong>and</strong>Sb = f (211) (5.5) (20) = f23,200 psiFb = f(23,200) (4.962) = f115,OOOlbThe axial load of the casing as it passes through the build interval has an additional, simultaneousload of 115,000 Ib from the bending force.Summing forces at the kick off point, the net tension load, F2b, is the total of the axial force at point 2,F2, plus the force, Fb, caused by bending.During string pickup,F2b = 28,100 f 115,100 = 143,200 lb <strong>and</strong> -87,000 lbDuring string set down,F2b = - 4800 +. 115,000 c 124,300 lb <strong>and</strong> -105,900 lbFor neutral state,F2b 9200 f 115,100 == 124,300 lb <strong>and</strong> -105,900 lbDuring pipe movement with a full string in the hole, the loads experienced at the KOPcould be from143,200 Ib compression to 120,000 Ib tension. In this example in a medium radius build hole, the loadcaused by bending is over 75% of the total load.Vertical IntervalOnce the load at point 2 has been determined, the tension at the surface (point 3) can be calculatedby:For pickupF3 = F2 + (KOP) ( W) (BF) = 28,100 + (4000) (17) (0.86) = 86,600 lbFor set down2.D-57
F3 = - 4800 + 58,500 = 53,700 lbFor neutral stateF3 = 9200+58,500 = 67,7001bRemember, the 14,000 Ib window for starting pipe movement (between the neutral point <strong>and</strong> setdown) is the result of friction in the build section <strong>and</strong> the reach sections.ApplicationFor a 5-1/2 in., 17 Ib/ft L-30 casing <strong>and</strong> using a safety factor of 1.33 (Joint efficiency of 75%), the jointstrength, Pj, isPi = (0.75) (4.962) (95,000) = 354,000 lbSince the tension loads are highest on pickup, the safety factor at surface is:At the KOe safety factor is:354,000/86,600 = 4.09354,000/143,200 = 2.47For a safety factor of 1.1 8 on the compression efficiency of the connection (85%), the compressiveyield strength, Pjc, isPiC = (0.85) (4.962) (80,000) = 337,000 lbSince the highest compressional loads are produced when setting down the string, the minimumsafety factor occurs in the first joint below the KOR337,000/119,900 = 2.81For the compression calculation, the load, Fib, at the bottom of the build interval is:337,000/120,100 = 2.81When running the string, it will be necessary to apply compression frequently at the top of the reachinterval to run the pipe into the hole.2.D-58
Chapter 3:CementingCementing is one of the most critical steps in well completion. Sadly, coming at the end of drilling <strong>and</strong>in the haste to put a well on production, rarely is the time <strong>and</strong> commitment taken to get a good job. Wethen spend significantly more time correcting it or battling the effects of a bad cement job.Cement fills <strong>and</strong> seals the annulus between the casing string <strong>and</strong> the drilled hole. It has three generalpurposes: (1) zone isolation <strong>and</strong> segregation, (2) corrosion control, <strong>and</strong> (3) formation stability <strong>and</strong>pipe strength improvement. Cement forms an extremely strong, nearly impermeable seal from a thinslurry. The properties of the cement slurry <strong>and</strong> its behavior depends on the components <strong>and</strong> the additivesin the cement slurry. This chapter will focus on the basics of the cementing process. For furtherinformation on cement <strong>and</strong> the cementing process the reader is referred to the Society of <strong>Petroleum</strong><strong>Engineering</strong>’s Cementing Monograph.’Most cements used in the oil industry are a type of portl<strong>and</strong> cement. The name portl<strong>and</strong> was takenfrom an English channel isl<strong>and</strong> with a limestone quarry that was used as source of stone for the developmentof portl<strong>and</strong> cement. Portl<strong>and</strong> cement is produced from limestone <strong>and</strong> either clay or shale byroasting at 2600 to 3000°F. The high temperature fuses the mixture into a material called clinkercement.’ After the roasting step, the rough clinker product is ground to a size specified by the grade ofthe cement. The final size of the cement particles has a direct relationship with how much water isrequired to make a slurry without producing an excess of water at the top of the cement or in pocketsas the cement hardens. The crystals seen in set cement include:’ C3S - tricalcium silicate, C2S - dicalciumsilicate, C4AF - tetracalcium aluminoferrite, C3A - tricalcium aluminate, MgO - periclase or magnesiumoxide, <strong>and</strong> CaO - free lime.Not all cements, even those made from the same components, will react in the same manner whenmixed with water. Basically, the differences are in the fineness of the grind of the cement, impurities inthe water <strong>and</strong> in some minor additives added during the cement manufacturing process. Figure 3.1gives the API designated classes for cements. These classifications of cement were in response todeeper <strong>and</strong> hotter downhole conditions. Note that the useful depths given in the data are derived fromaverage pumping times of neat (no additives) cement for average temperatures involved at thesedepths. Actual well environment controls the limits of the cement. Also, additives such as accelerators<strong>and</strong> retarders can be used to modify the behavior of the cement. In this manner, a class H cement, forexample, can be used to much greater depths than the 8000 ft limit seen in the table.Figure 3.1: API Cement ClassesClass A: For use from surface to 6000 ft (1830 m) depth*, when special properties are not required.Class B: For use from surface to 6000 ft (1830) depth, when conditions require moderate to high sulfateresistance.Class C: For use from surface to 6000 ft (1830 m) depth, when conditions require high early strength.Class D: For use from 6000 ft to 10,000 ft depth (1830 m to 3050 m), under conditions of high temperatures<strong>and</strong> pressures.Class E: For use from 10,000 ft to 14,000 ft depth (3050 m to 4270 m), under conditions of high temperature<strong>and</strong> pressures.Class F: For use from 10,000 ft to 16,000 ft depth (3050 m to 4880 m), under conditions of extremelyhigh temperatures <strong>and</strong> pressures.Class G: Intended for use as a basic cement from surface to 8000 ft (2440 m) depth. Can be usedwith accelerators <strong>and</strong> retarders to cover a wide range of well depths <strong>and</strong> temperatures.3-1
Class H: A basic cement for use from surface to 8000 ft (2440 m) depth as manufactured. Can beused with accelerators <strong>and</strong> retarders to cover a wider range of well depths <strong>and</strong> temperatures.Class J: Intended for use as manufactured from 12,000 ft to 16,000 ft (3600 m to 4880 m) depthunder conditions of extremely high temperatures <strong>and</strong> pressures. It can be used with accelerators<strong>and</strong> retarders to cover a range of well depths <strong>and</strong> temperatures.*Depth estimates are based on conditions imposed by the casing-cementing, well-simulationtests (API RP10-B) <strong>and</strong> should be considered approximate values. The response of thecement to these conditions can be modified by additives.There are a number of other cements that do not fall specifically into any general classification. Thesecements are special blends of portl<strong>and</strong> <strong>and</strong> additives or cements based on other chemistry. Theyinclude pozzlin cement, which incorporates organic resin technology, exp<strong>and</strong>ing cements, whichincrease in volume as the cement sets, silica <strong>and</strong> lime cement for hot wells, <strong>and</strong> low heat generatingcements for permafrost applications. These cements are rarely used in general completions becausethey are more expensive than portl<strong>and</strong> or have other traits that are less desirable than those of portl<strong>and</strong>.Environmental conditions <strong>and</strong> available completion equipment may significantly affect the performanceof the cement or place special requirements on the cement. The unique problems of the effectof temperature on cement setting <strong>and</strong> long-term strength of cements have led to development of specialcements for both steam wells <strong>and</strong> those in arctic environments. High temperatures sharply reducecement strength <strong>and</strong> durability, necessitating the development of stabilizers. Silica additives <strong>and</strong> limebased cements have proved effective in thermal wells. Permafrost cement was developed in responseto a need to cement formations to depths of 2000 ft without producing sufficient heat of hydration fromsetting the cement to melt <strong>and</strong> destabilize the permafrost.The most important aspect of cementing blending is obtaining a consistent slurry with the properamount of additives <strong>and</strong> mix water. The optimum water-to-cement ratio for a cement slurry is a compromise.Maximum cement strength occurs at a water-to-cement ratio of about 2.8 galhack. This isthe minimum amount of water necessary to fully hydrate <strong>and</strong> chemically react with the cement groundto a size that represents Class G. But, a slurry mixed at this water rate has a very high viscosity <strong>and</strong>cannot be pumped. If too much water is used to aid in pumping <strong>and</strong> displacement, low strength <strong>and</strong> avery high free water quantity will occur. The tradeoff between cement strength <strong>and</strong> the mixing watervolume is seen in the data of Figure 3.2.* Free water is defined as water that is not needed by thecement for reaction. When flow stops, it separates out to the top of the cement column. Separationmay occur at the top of a long column or in pockets in highly deviated wek3 These pockets contributeto annular gas leakage <strong>and</strong> other annular flow problems.Cement is mixed by jet mixers that combine cement <strong>and</strong> water in a single pass operation or the moreprecision batch mixers that mix by circulating in a large tank but only mix a limited volume at a time.'Although an acceptable slurry can be achieved in the jet mixer by an experienced operator, the batchmixer allows closer control in critical, small jobs. The jet mixers' are used for almost all large jobs thatrequire a constant supply of cement slurry at a high rate. The density of slurries mixed by these methodsmust be checked periodically with a pressurized mud balance to obtain consistent density. Densityis important to control the reservoir pressure <strong>and</strong> prevent formation fracture breakdown.The quality of the water used to mix the cement varies widely depending upon the specificationsrequired by the company involved. Fresh water, seawater <strong>and</strong> some brackish waters are used to mixcement slurries. For any source of water, the behavior of the resultant cement in terms of setting time<strong>and</strong> pumpability must be known before mixing. Pumpability is measured by a laboratory instrumentcalled a con~istometer.~ This device measures the setting time of a cement slurry by stirring the slurry(under pressure) until it thickens too much to stir. The output is as units of consistency, <strong>and</strong> is timerelated. This test yields the time that a particular slurry can be pumped at a given temperature.Because of the development of offshore fields, seawater has become very widely used for cementing.Seawater, like most inorganic salt brines, slightly accelerates the set time of cement. Fortunately, as3-2
~ ~~Y I I I I0 2.5 5 7.5 10MXING YITER - ULLONS PER 54ck(Smith, SPE)Figure 3.2:Cement compressive strength vs. mix water volume.shown in Figure 3.3, the chemical composition of seawater throughout the world does not vary to alarge degree,5 but some chemical additive additions may be necessary to control effects of salt <strong>and</strong>temperature. Use of brackish water (from bays, swamps, sewage or produced waters) can causeproblems. High salt contents, especially calcium chloride, may decrease the cement set time. Organiccontaminates (such as oil-base mud) may slow the cement set time, sometimes so severely that theslurry does not set."' 1AlaskaI 1 1St<strong>and</strong>ardGr<strong>and</strong> Banks Trinidad Persian Gulf of Sable Sea WaterNewfoundl<strong>and</strong>Suer Isl<strong>and</strong> AS1M.D-114118900 19359I w*'' 1 (K2;IS)2000 2580 24-00 3100 3100140 305 78 171 1340 0 27 24 119319 11649 11170 13044 124992260 2702140 14210690 111551080 1118 1300 1500 1570360 400 408 520 46429499 35553 35283 41359 400788.0 8.3 82 8.21199 1297370 40833559 351697.3 82Figure 3.3: Sea Water Analysis at Various Locations(Smith & Calvert, JPT, 1975)Accelerators or retarders may be used in the cement to change the set time from a few minutes tomany hours. A retarder is used in deep or very hot wells to prevent the set of the cement before thejob is complete. Accelerators are used in shallow or cool wells to speed up the set of cement so lessrig time is lost waiting on the cement to set. Values such as filtrate loss control <strong>and</strong> cement expansioncan also be directly affected. Cement additives may be divided into two general classifications basedon their reaction type; chemical <strong>and</strong> nonchemical. Nonchemical additives are usually materials whichaffect the cement by altering density or controlling fluid loss. Chemical additives modify the hydration(water intake).3-3
Cement DensityControlling the cement slurry density is critical for placing a column of cement where the formationmay be fractured by a heavy slurry or would allow the well to flow if the cement slurry was lighter thanthe pore pressure. For a lighter weight cement than the normal 15 to 16 Ib/gal, bentonite clay may beadded to absorb water to yield a lighter cement with higher bound water volume. Ten to 12 Ib/galcement density can be achieved in this manner. Grinding the cement to a very small size will alsorequire more water to satisfy the high surface area <strong>and</strong> lighten the slurry to the 10 to 12 Ib/gal range.Ultra-light-weight cement^,^'^ using hollow ceramic or glass beads can reduce the overall weight ofthe cement slurry to less than 9 Ibs per gallon. Even lower densities can be achieved by foaming thecement with a compressed gas such as nitrogen.&’’The foamed cements can create densities of 4 to7 Ib/gal but require careful control of annulus surface pressures to avoid gas channels <strong>and</strong> voids. Allthese light weight cements, although strong enough to support the pipe, have less strength than theregular portl<strong>and</strong> cement. Heavy weight materials are added to the cement to increase the cement density,usually to control the pressure in the formation during the pumping of the cement. Iron ore, barite(barium sulfate) <strong>and</strong> s<strong>and</strong> can create slurries to 25 Ibs/gal. Other methods of preparing heavyweightslurries include the use of dispersants which allow less water to be used in a cement <strong>and</strong> still maintainpumpability. A chart of cement density for various methods of density control is contained inFigure 3.4.Figure 3.4: Density Ranges for Various Types of Cement SlurriesIn some treatments where the light weight cements are not used either by preference, economics orfor reasons of strength, stage tools can be used to control the pressures on a zone by running a multistage cement job. A staged job separates the cement job into small cement jobs that only support aportion of the total column <strong>and</strong> weight. The tools prevent the cement columns from contacting eachother until set. An example of a cement stage tool is seen in Figure 3.5. The simplest tool uses a drillableplug to seal the pipe below the tool <strong>and</strong> to open a set of ports that allow the next cement stage toturn the corner <strong>and</strong> start up the annulus. Some tools are equipped with a seal device that preventscement from falling down the annulus <strong>and</strong> ruining the job by creating channels or by exerting morepressure on the lower zones.With these tools, even a deep well with several zones can be cemented by turning the job into severalconsecutive jobs. The staged concept can also be done by cementing with a small volume <strong>and</strong> perforatingthe pipe above the last cement top <strong>and</strong> repeating the process. However, the tools save WOCtime between jobs. The obvious drawback to the tools is the same for all downhole tools; reliability.Fluid LossLost circulation materials control the flow of whole cement into natural fractures or extremely largevugs. The control materials come in three basic types: granular, lamellated <strong>and</strong> fibrous. Granularmaterials such as s<strong>and</strong> <strong>and</strong> other products set a secondary matrix by filling cracks <strong>and</strong> vugs in the formation.They may have a size range from 1/4 in. diameter to fine powder to achieve control. Lamellatedor flaked products such as shredded cellophane stopped at the formation face <strong>and</strong> create ablockage on which cement will form a filter cake. Fibrous material such as paper, nylon or polypropyleneare best suited to bridge small fractures.3-4
S-6
can be lost waiting on cement (WOC) to set. This WOC time can be shortened by the use of accelerators.Cement requires very little strength to physically support the casing. More strength is required inwithst<strong>and</strong>ing loading from drill bits <strong>and</strong> pressure. In designing the cementing operation, it is imperativethat high strength cements be used around the casing shoe (the bottom end of the pipe) <strong>and</strong> acrosspotential pay, thief zones (areas of fluid loss) <strong>and</strong> water producing zones. Filling the annulus behindpipe <strong>and</strong> zone separation requires very little strength <strong>and</strong> more economical cements or cementextenders may be used.While the cement slurry is liquid, the hydrostatic force from the weight of the slurry exerts force to prevententry of gas into the wellbore annulus. When pumping stops, the cement starts to gel <strong>and</strong> set <strong>and</strong>it begins to support itself by the initial bond to the formation. This initial attachment, coupled with fluidloss to the formation, reduces the applied hydrostatic 10ad.l~ Fluids can then enter the annulus, causingvoids <strong>and</strong> channels in the cement behind the pipe. Methods of control include reaction with the formationgas to plug the channels14 <strong>and</strong> stopping the gas from entering by reducing ~ermeabi1ity.l~ Useof an external inflatable casing packer (ECP) is also an option.16 This tool operates like a hydraulic setpacker between the casing <strong>and</strong> the open hole.The necessary volume of cement is the volume of the openhole less the volume of the casing acrossthe zone. An excess of 30% to 100% of the total is usually added to the cement volume to allow forwashouts <strong>and</strong> mud contaminations. The 30% to 100% range of excess cement volumes is large, evenfor the technology of the oil field. It reflects the variability of drillers expertise <strong>and</strong> formation conditions.Hole volume is calculated from the caliper log. The bit diameter should not be used for hole volumecalculations since it will not reflect washouts. In most operations, 4-arm caliper tools that give twoindependent diameters are more accurate than 3-arm calipers that give a maximum or averaged reading.Cementing DesignThe first use of cement in the oil industry is recorded as a water shutoff attempt in 1903 in California.*At first, cement was h<strong>and</strong> mixed <strong>and</strong> run in a dump bailer to spot a plug. Pumping the cement down awell was soon recognized as a benefit <strong>and</strong> a forerunner of the modern two-plug method was first usedin 191 0.2 The plugs were seen as a way to minimize mud contact with the cement. Although bothmechanical <strong>and</strong> chemical improvements have been made in the cementing process, the original plugconcept is still valid.Cement design includes the selection of additives <strong>and</strong> equipment to remove mud <strong>and</strong> properly place<strong>and</strong> evaluate the cement. The cement design depends upon the purpose of the cementing operation.The initial cement is usually to fill the annular space between the casing <strong>and</strong> the hole from the casingshoe to the surface or a point several hundred feet above the zone that must be isolated. The firstcement job is called primary cementing <strong>and</strong> its success is absolutely critical to the success of subsequentwell control <strong>and</strong> completion operations. When a primary cement job fails to completely isolatethe section of interest, repair of the cement job must be done before drilling can proceed. These repairsteps are covered by the collective label of squeeze cementing. In a squeeze job, cement is forcedinto the zone through perforations, ports in tools, hole produced by corrosion, or through the clearancebetween casing overlap liners or strings. Although squeeze cementing has become commonplace, itis expensive <strong>and</strong> its use can be curtailed through improved primary cementing procedures.Primary CementingIn primary cementing, the object is to place a continuous sheath or b<strong>and</strong> of cement around the pipewhich extends without channels or voids outward to the formation face. Primary cementing is not aneasy operation to do correctly. Many things can happen during this process to create problems orweak spots in the primary cement design.3-6
ApplicationThe mixing of cement <strong>and</strong> water is the first critical area of application of cementing technology. To preventfracturing or loss of control, the water <strong>and</strong> cement must be blended together at the proper slurrydensity. The weight of the slurry is equal to the weight of the set cement less any weight of free water.One of the first questions that should emerge in a design is the volume of cement needed for a job. Ina short string or shallow string, complete cement fill of the annulus is needed, plus at least 30%excess to displace the lead cement that is in contact with the mud as the cement displaces the mudfrom the annulus. Cement contaminated with mud will not form an effective seal; it may have mudchannels through it <strong>and</strong> may not develop any strength. In cases where the mud has not been adequatelyconditioned before cementing, as much as 100% excess may be appropriate.The volume of the hole should be measured with a caliper after removing the drilling string <strong>and</strong> beforerunning casing. Calipers may be available in 3-arm, 4-arm or multi-arm styles. Three-arm calipersreport an average “round” hole diameter based on the smallest diameter reading of one of the arms.The four-arm calipers work as two 2-arm calipers. The data from this tool draws an average of thehole based on two circles or ellipses. Both tools are capable of underestimating the hole volume.The caliper tools report the data on a log track that shows deviation from a theoretical line reflectinggage hole or bit size. Washouts <strong>and</strong> irregular hole volumes must be calculated to give an accuratereading on hole size. The easiest way to calculate hole volume in a washout is to use an averagewashout diameter equal to at least 90% of the maximum caliper measured diameter where the diameteris fluctuating widely <strong>and</strong> 100% of the maximum diameter where the hole diameter is more consistent.Calculating the volume of the hole in vertical segments of similar diameter yields usable results.The problems in cementing through a washout are that fluid velocity becomes very low in a washout;swept debris at the leading edge of the cement drops out or mixes in <strong>and</strong> the cement slurry will nolonger scour or clean the mud cake in the washout.There are two types of oilfield cement mixing equipment: on-the-fly <strong>and</strong> batch. Batch mixing is done ina large tank with circulation or paddle mixers. The cement <strong>and</strong> the water are measured into the tank,sometimes with an on-the-fly mixer, with small additions of cement or water to get the right slurry density.Although batch mixing is by far the most accurate method, the size of the cement job is limited bythe volume of the tank at h<strong>and</strong>. Mixing on-the-fly involves moving steady streams of cement <strong>and</strong> waterthrough a zone of turbulence produced by high velocity flow, Figure 3.6. The cement slurry producedin this manner is highly dependent on the experience <strong>and</strong> attention of the mixer operator. Numerousproblems with variances in slurry weight have led to averaging “pods” or tanks, Figure 3.7, downstreamof the on-the-fly mixer. To minimize the damage produced from lighter or heavier th<strong>and</strong>esigned slurries, most cementing service companies have density monitoring devices to report slurrydensity back to the mixer operator.CEMENT HOPPER.. .BREAKER 1WATER0 DRY CEMENT0 CEMENT SLURRYFigure3.6:ROTARY JETTUB SCREENJDISPLACEMENTPUMP SUCTION1.-(Smith, SPE)A “jet” mixer. The slurry density is very muchdependent upon the operator.3-7
CIntrHUpll Pump(Smith, SPE)Figure 3.7:A pod or batch mixer. The averaging characteristicsmakes the slurry density much more consistent.Incorrect cement density can cause gas migration, poor set strength, inadequate cement bond, blowouts, formation fracturing <strong>and</strong> lack of mud displacement. Cement slurry density must be rigorouslycontrolled to enable the subsequent well completion steps to be carried out successfully.Once a consistent cement slurry blend has been achieved, the second critical area, that of the displacementstep, begins. To effectively bond the pipe to the formation with cement, the drilling mud <strong>and</strong>the drilling mud filter cake must be completely removed. Failure to remove the cake or mud will lead tofailure of the primary cement job by leaving mud channels in the cement. Failures necessitatesqueeze cementing or repair operations.Mud conditioning <strong>and</strong> displacement are the next critical areas of cementingIn orderfor cement to isolate zones, a sheath of cement must completely surround the pipe <strong>and</strong> bond the formationwall to the pipe. The mud cake must be removed <strong>and</strong> the pipe must be centralized. Centralizationis needed to provide sufficient st<strong>and</strong>off or clearance between the casing <strong>and</strong> the borehole wall.Removal of the mud <strong>and</strong> mud cake is done by a combination of chemical <strong>and</strong> physical actions that arewell documented but often overlooked during application. The ease of mud removal depends upon thephysical condition of the mud <strong>and</strong> the access to the mud. Mud displacement begins with decreasingthe gel strength of mud <strong>and</strong> removing cuttings. After casing is run in the well, the annular space opento flow is smaller than when drill pipe was present. The smaller annular area creates higher velocitiesthat can disturb deposits of cuttings. Cuttings can accumulate in the lead portion of the cement, contaminatingthe cement <strong>and</strong> creating blockages that can create lost circulation. The presence of a mudcake will prevent bonding of the cement to the formation. An estimation of the volume of cementneeded for removal of mud cake by turbulent flow is:’Vt = (t,) (9) 5.616 ft3/bblwhereV, = volume of fluid (in turbulent flow), ft3tc = contact time, minutes9 = displacement rate, bbl/min3-8
Studies have shown that a contact time (during pumping) of 10 minutes or longer provides better mudremoval than shorter contact times.’ The equation is valid as long as all the fluid passes the point ofinterest. The equation will not be valid for mud outside the path of the flowing fluid, such as when thecasing is uncentralized <strong>and</strong> is pressing against the formation.Movement of the pipe during cementing is one of the best methods of improving the mud displacement<strong>and</strong> reducing the number of mud channels remaining after ~ementing.’~~~~ Reciprocation (up<strong>and</strong> down) <strong>and</strong> rotation of casing help force the mud from the pipe/formations contact areas <strong>and</strong>insure a more even distribution of cement. Rotation of the pipe requires special rotating heads to allowpumping while turning. Reciprocation, or moving the casing up <strong>and</strong> down a few feet while cementing,can be done more easily but does not force the mud from the contact area in the same manner asrotation. Addition of scrapers to the casing can help remove hard mud cake.24 Use of centralizers minimizescontact area <strong>and</strong> may make pipe movement easier.Displacement of the mud <strong>and</strong> the mud cake cannot always be accomplished by flowing cement.Heavily gelled muds <strong>and</strong> tightly compressed filter cakes are very resistant to removal by any flowingfluid. Special removal procedures are necessary. The basic mud removal step is to pump the cementin turbulent flow: the combination of the high velocity, high viscosity <strong>and</strong> abrasive nature of cementwork in unison to scour the formation <strong>and</strong> casing. During scouring, much of the mud <strong>and</strong> cake materialsare mixed in with the first cement pumped. This contaminated cement must be removed from thewell. In the cement volume design, the allowance for contaminated cement is contained in part of the30% to 100% excess cement normally designed into most jobs.If muds <strong>and</strong> mud cakes cannot be removed by cement flow, special preflush fluids <strong>and</strong> mechanicaldevices are available to improve displacement. To improve mud <strong>and</strong> mud cake displacement, thebinding agent in the mud must be broken down. In most cases, the mud binders are clay, polymers orsurfactants. Chemical flushes of acids, solvents, or surfactants are useful but must be selected foraction on specific muds. These flushes are pumped ahead of the cement or spotted in the annulusbefore the cement job.Mechanical devices for mud <strong>and</strong> mud cake removal include casing centralizers, scratchers for cakeremoval <strong>and</strong> turbulence inducing devices to improve mudThe wire or wire ropescratchers break up the mud cake during running of the casing. Complete removal of the cake is notnecessary; the action of the cement will often be sufficient to remove the cake fragments once theintegrity of the cake has been disrupted.The alignment of casing in the borehole is an often neglected factor that has a tremendous impact onmud conditioning, cementing, perforating, <strong>and</strong> production, particularly in highly deviated or horizontalhole^.^^-^' Uncentralized casing always lays on the low side of the hole. In soft formations, the casingmay even embed or bury into the wall of the formation. When casing contacts the wall, the drilling mudcake <strong>and</strong> some whole mud is trapped between the casing <strong>and</strong> the rock. This mud cannot be removed.Mud removal attempts by flushes <strong>and</strong> turbulent cement flow will have little contact as shown in thevelocity profile sketches of Figure 3.8 <strong>and</strong> the photographs of mud displacement <strong>and</strong> channels createdin a flow study recorded in Figure 3.9. Cement bypasses the mud <strong>and</strong> channels are left behindthe pipe. These channels may completely undermine the principles of zone separation by cement <strong>and</strong>usually require repair by squeeze cementing. Channels are the most common form of primary cementfailure.Centralizers <strong>and</strong> pipe movement can improveCentralizers hold the pipe away fromthe wall of the hole so that cement may more evenly displace the mud <strong>and</strong> completely fill the annulus.The design of centralizers varies widely with the application. Centralizing casing in nearly straightholes is relatively easy, but as holes become more deviated, centralization becomes more difficult. Inthe more deviated wells, the weight of the casing will flatten most spring centralizers <strong>and</strong> may deeplyembed some of the solid fin body units. The actual number of centralizers needed for a well dependson the acceptable deflection of the pipe <strong>and</strong> the severity of dog legs in the well. Examples of centralizers<strong>and</strong> their spacing are shown in Figure 3.10. Note in the examples that the centralizer spacing3-9
'WOFigure 3.8:1W - VERCENT 75 - PERCENT 30 - PERCWTSTMWFF STUIMFF STUIWFFCement velocity schematic at differentcasing st<strong>and</strong>offs.decreases (more centralizers needed) as hole angle, pipe size <strong>and</strong> clearance increase.'^^^ The spacingis usually calculated by computer using a model such as that of Lee et al.27 These programsproject spacing on the input of depth, dogleg severity, lateral load, tension <strong>and</strong> deviation. Typicalspacing is from 30 to 60 ft between centralizers.The variance in casing weight can be illustrated by the following examples of buoyed weight of casing.where:WCb = buoyant weight of casing, Ib/ftW, = dry wt of casing, Ib/ftpi = density of fluid in casing, Ib/galpo = density of fluid in annulus, Ib/galdi = inside diameter of casing, in.do = outer diameter of casing, in.for circulation with an 11.5 Ib/gal mud in a 7 in., 26 Ib/ft, N-80 casing:WCb = (26) + 0.0408 ( 1 1.5 (6.276) - 1 1.5 (7.0) 2, = 21.5 lb/ftIf fresh water (8.33 Ib/gal) is used to displace 16 Ib/gal cement to the float collar, the buoyed weightbecomes:WCb = (26) + 0.0408 (8.33 (6.276) - 16 (7) 2, = 7.4 lb/ftMud retards (slows) the set of cement. Minimizing this effect requires mud removal <strong>and</strong> separationfrom the cement whenever possible. Most casing strings are run full of mud during casing placementfor assistance in well control. Cement displaces the mud from the casing before it flows up the annu-3-10
(Wilson & Sabins, SPE)Figure 3.9: Examples of 5” (bottom) <strong>and</strong> 7” (top) casing in 9-518”showing the effect of the flow area at a st<strong>and</strong>off of60% (both cases). The smaller flow area in the 7” testleaves a mud channel that will allow communication.lus. If the mud is lighter than the cement or the mud has high gel strength, the cement will tend to fingeror channel through the mud during its trip down the casing, mixing cement with mud. Mixing ofmud <strong>and</strong> cement in the tubulars can be prevented by use of the two plug system. Before the cement iscirculated down the well, a hollow rubber plug (Figure 3.11), with a disk that can be ruptured at highpressure, is placed in front of the cement. The cement pushes this plug down to the bottom of the well,wiping the inside of the casing <strong>and</strong> displacing the mud from inside the casing ahead of the cement. Atthe bottom of the well, the plug “l<strong>and</strong>s’t or is “bumped” <strong>and</strong> pressure builds up, rupturing the disk.Cement comes through the plug <strong>and</strong> can “turn” up the annulus. The second plug is dropped at the endof the calculated cement volume <strong>and</strong> the cement is displaced down the well with mud or water. Thesecond plug, or top plug, is solid <strong>and</strong> has the same set of wipers as the first plug. At the bottom of thehole, the top plug reaches the top of the first plug <strong>and</strong> pressure rises, indicating that the plug has been“bumped.” The plugs are made of drillable material that can be easily removed if the well is deepened.Correct loading of the plugs is critical. If the plug sequence is accidentally reversed <strong>and</strong> the top plug isdropped first, the job will “end when this solid plug hits bottom <strong>and</strong> the casing is left filled with cement.The actual displacement in the wellbore is very much different than the surface pump rate might indicate,especially when the density of the mud is much less than the density of the cement.*’ When alighter mud is displaced, the cement is in a “free fall.” The cement density is enough to rapidly push3-1 1
HoleAngle10"15"20"25"30"35O40"45O50°*5-112 in.-8-314 in.635753504846444240Maximum Spacing BetweenCentralizers, (ft) (St<strong>and</strong>off 1 in.)*Casing size <strong>and</strong> **hole size(Brouse, World <strong>Oil</strong>, 1983)(World <strong>Oil</strong>, 1988)Figure 3.10: Examples of centralirers <strong>and</strong> centralirer spacing.DIAPHRAGMKILDED RUBBERCAST ALUHINUMINSERTTOP PLUG(BLACK)Figure 3.11:Schematics of the plugs involved in the two plug system.Note the color difference between the plugs. Thecolor makes identification easier when drilling out aproblem well where the cement has set p in the pipe.3-12
the mud ahead <strong>and</strong> displace it from the well without the driving pressure of the pump. This is mostnoticeable in the later stages of the job during displacement when the casing contains more mud thancement. Surface pressure can go to almost zero at low injection rates (the well is said to go on ‘‘vacuum”).At this point, the well is taking fluid faster than it is being injected <strong>and</strong> mud return rate from thewell can be more than the cement injection rate (a vacuum, with void space, is being created in thecasing at the surface). As the cement turns the corner at the bottom of the well <strong>and</strong> starts up the annulus,the injection pressures caused by the heavier cement density will climb. The well returns, whichare monitored continuously at the surface, may go to zero as the cement fills the void volume in thepipe that was evacuated during free fall. It may appear that the well has lost returns by breaking down(fracturing) the formation. This rapid movement of fluids must be included in the design to allow controlof the mud. The problems involved with free fall are rapidly increasing bottomhole pressurecaused by resistance to faster than design mud flow rates around the shoe <strong>and</strong> an apparent “loss ofreturns,” as the cement fills the voids created during the initial free fall. An example of a field job showingpump <strong>and</strong> return rates is shown in Figure 3.12.29 If, for example, the low rate of returns after 2 hrs,caused the operator to reduce the injection rate in an attempt to limit the apparent “loss” of cement,the cement would not be in turbulent flow <strong>and</strong> the mud cake might not be cleaned off the formation.16(Mahony & Barrios)PAV0Figure3.12: The problem of free fall of aheavier cement in a lighter mudsystem. The upper schematicshows the placement of the16lblgal cement with thelighter mud. The graph at left isa model prediction with measureddata from the field(Beirute).After the plug has been bumped, the waiting-on-cement time, WOC, begins <strong>and</strong> pressure is held untilcement has set. Pressure control is assisted by the float equipment. These devices are flapper or poppetvalves near the bottom of the string that prevent the cement from returning to the casing. The onewayvalves are of drillable material <strong>and</strong> are designed to st<strong>and</strong> the high velocity flow of large quantitiesof abrasive cement without damaging the sealing mechanism. Examples of the float valve are shownin Figure 3.13. If the float is at the end of the casing string, it is called float shoe. If it is placed a jointor two off bottom, then it is called a float collar. The preferred location will depend upon the operatorbut for reasons of cement contamination control, float collars are usually preferred. The float collarresults in a joint or two above the shoe being filled with the last cement pumped. This last cement maybe contaminated with residual mud scraped from the casing wall by the top plug. Use of both a floatcollar <strong>and</strong> a float shoe are accepted practice in some areas. The dual floats are used as an extra barrieragainst pressure leak back.After WOC, drill bit just smaller than the casing id is then run if the well is to be deepened. The hole isdrilled through the casing shoe <strong>and</strong> into the formation beneath this string. At this point, the casingshoe is generally tested to insure that a good, leak-tight cement job has been obtained. If there are3-13
Figure 3.13: Examples of floats <strong>and</strong> float locations from Smith (WE).Note that the float collar is located one joint (or more)above the end of the string.leaks during this pressure test, the well is squeezed with cement until a pressure tight seal can beobtained. Since the casing shoe is the weak spot for blowout control, this step is a necessity.In summary, to properly place a good primary cement job requires several factors: selection of theright cement blend, the conditioning of mud, the removal of mud cake, centralization <strong>and</strong> movement ofthe pipe to insure full cement contact around the perimeter of the outside casing wall <strong>and</strong> use ofenough cement to isolate the full zone.Cementing CalculationsThe following calculations follow the formulas used in the cementing monograph.’Buoyant force on the casing by the fluid in the hole tries to float the casing. Hydrostatic pressure actsagainst the effective area of the casing, causing the upward force. The pressure acts on the full areaof the closed end casing if the float is in place <strong>and</strong> holding or on the area created by do-di if the casingis open ended. The weight of the casing string minus the upward buoyancy force gives the buoyed ortrue weight of the casing string in the hole.For 13-3/8 in., 61 Ib/ft, K-55 casing in a 17 in. hole, filled with 10 Ib/gal mud:closed end area = x (do2/4) = 141 in.2effective area = (1/4)x (do2-di2) = 17.5 in.2hydrostatic at 4000 ft = 4000 ft (1 0 x 0.052 psi/ft = 2080 psihydrostatic effect on casing = 2080 psi x 17.5 in? = 36,400 Ibcasing string weight on air = 61 Ib/ft x 4000 ft = 244,000 IbThe buoyed weight of the casing in mud divided by the outside area of the casing gives the pressureneeded to balance the string:207,600 lb/141 in.2 = 1472 psi3-14
Thus, a bottomhole kick or other pressure increase of over 1472 psi (additional 0.368 psilft or7.1 Ib/gal) could start the casing moving upwards. At shallower depths, especially with large diametercasing, the additional pressure to lift the buoyed weight can be 100 psi or less.The pressure to l<strong>and</strong> the top plug when displacing 16 Ib/gal cement with fresh water to 4000 ft(assuming complete annulus fill with cement) is:cement hydrostatic in annuls = 4000 ft x 16 Ib/gal x 0.052 .@ = 3328 psilb ftpsi galwater hydrostatic in casing = 4000 ft x 8.33 Ib/gal x 0.052 lbft = 1733 psipressure to l<strong>and</strong> plug = 3328 - 1733 = 1595 psiIn wells where a1 the exposed formations will not support the full weight of the cement while fracturing,the cement must be lightened or the zone must be protected by only filling the annulus with a partialcolumn of cement (staged cementing).Assume the zone at 4000 ft (bottomhole) has a fracture gradient of 0.72 psi/ft. Calculate the height ofa 16 Ib/gal cement column that will be 200 psi below fracturing pressure:bottomhole frac pressure = 4000 ft x 0.72 psi/ft = 2880 psiallowable bottomhole pressure = 2880 psi - 200 psi = 2680 psicement gradient = 16 Ib/gal x 0.052 = 0.832 psi/ftfull column pressure = 4000 ft x 0.832 psi/ft = 3328 psiIf 16 Ib/gal cement is used, the maximum column height (within the allowable pressure) is:column height = 2680 psV0.832 psi/ft = 3221 flIf a full cement column is needed, the maximum cement density is:maximum density = 2680 psi/4000 ft = 0.67 psi/ft or 12.9 lblgalCement densities are only part of the picture, the friction pressures developed by pumping the cementpast restrictions adds to the hydrostatistic pressure of the cement.Balanced Plug SettingDetermining the height that cement will rise where it can equalize height requires use of a simple balancedplug formula.whereH = height of balanced cement column,N = cubic ft of cement slurry pumped,c = ft3 per linear ft of annulus,T = ft3 per linear ft of tubing.H=-NC+T3-15
Squeeze CementingSqueeze cementing forces a cement slurry behind the pipe to repair leaks or shut of fluid 10~s.~’Squeeze cementing is normally thought to be a repair step, but is also used to seal off depleted zonesor unwanted fluid production.Smith2 documents eight major uses of squeeze cementing for repair <strong>and</strong> recovery control purposes:1.To control high GORs. By squeezing the top section of the perfs, gas production can be made topass vertically through the top part of the formation matrix, slowing the gas production by thecontrast in vertical vs. horizontal permeabilities.2.To control excessive water, squeezing lower perfs can delay water production. Only if an impenetrablebarrier separates the oil <strong>and</strong> water or if vertical permeability is very low, will effectivewater reduction be achieved.3.4.Repairing casing leaks. Cement can be squeezed through holes in casing. This is best accomplishedby very small particle cement.To seal thief zones or lost-circulation zones. Cement slurry may penetrate natural fractures foronly a centimeter or two but may develop sufficient blockage to help control leakoff. The cementslurry bridges on the face of the matrix. Sealing off natural fractures is often difficult.5.To stop fluid migration from a separate zone. This is usually a block squeeze or channel repairoperation.6.7.8.Isolation of zones. Selective shutoff of depleted or abnormally low or high pressure zones.Repair of primary cement job. Filling voids or channels, <strong>and</strong> repair of liner tops are common.Ab<strong>and</strong>onment squeezes. Shutting off depleted reservoirs or protecting fresh water s<strong>and</strong>s.Squeeze cementing is separated into high pressure squeezing <strong>and</strong> low pressure ~queezing.~’~~~High pressure squeezing involves fracturing the formation with cement until a required surface pressureis reached. The importance of high pressures at the end of the job, although popular with manycompanies, is actually of little importance <strong>and</strong> should be well below 1 psi/ft.32333 The high pressuresqueeze uses “neat” cement (no additives) with very high fluid loss. The best use of the technique isusually to shutoff depleted zones <strong>and</strong> to seal perforation^.^^The low pressure squeeze technique is probably more efficient in placing a controlled amount ofcement in a problem area of the well. With this technique, formation fracturing is completely avoided.The pressure is achieved by pressuring-up on the cement <strong>and</strong> allowing the cement to filter out on theformation creating a block in the annulus. Once the cement slurry has hardened or dehydrated to asufficient extent, no more fluid will be displaced. The excess cement that is still the drill pipe or theannulus can be displaced from the well by opening the casing valve <strong>and</strong> flushing with a displacementfluid. The advantages of the low pressure squeeze are less pressure exposure to tubing <strong>and</strong> casing<strong>and</strong> special cementing tools, <strong>and</strong> a smaller quantity of cement.For either of the squeeze cementing process, a relatively low water loss, strong cement is part of thedesign. Most operations use nonretarded API Class A, G or H, which are suitable for squeeze conditionsto 6,000 ft without additives. For deeper wells, Class G or H can be retarded to gain necessarypumping time. In hotter wells (above 230°F), additives should be considered at high temperature toincrease strength.3-16
Although squeeze cementing is often used to help repair primary cement failures to protect the pipe, itis possible to collapse the casing during squeeze cementing. If a packer is set immediately above thezone to be squeezed <strong>and</strong> an open channel exists that links the backside of the casing above thepacker to the interval being squeezed Figure 3.14, then the outside of the casing above the packermay be exposed to the full pressure of the cement squeeze. If the inside of the casing is not be loadedor pressurized, casing failure can occur if the Ap is above pipe strength.,(Hodges, API, 1959)Figure 3.14: An illustration of how cement squeezes belowa packer can result in casing collapse abovethe packer. Some zone of communication isrequired.The thickening time <strong>and</strong> set time of cement used in squeeze operations are calculated in the samemanner as those used in primary cementing. Squeeze pressure does effect the dehydration of theslurry, particularly across zones which are very permeable. Fluid loss additives may be included if theslurry is designed to move any significant distance across a permeable formation. Normal dehydrationof a cement on a permeable section is severe enough to seal off the flow channel before complete displacementis accomplished.Cement Squeeze ToolsA drillable or retrievable cement retainer is a modified packer that helps control the placement ofcement <strong>and</strong> protects other zones from pressure <strong>and</strong> excess cement. Retrievable tools can be set <strong>and</strong>released several items <strong>and</strong> can be used for several squeeze repairs in one trip. Drillable tools are asingle use tool that stays in place <strong>and</strong> is drilled out (if needed) after the cement has set. The tools aremodified packers <strong>and</strong> are available in compression set <strong>and</strong> tension set models. Compression set modelsare normally used below 3000 ft where the weight of the string is adequate to completely engagethe slips.Drillable cement tools are more restricted in setting <strong>and</strong> application than retrievables but offer morecontrol on the set cement. The drillable models are preferred where continued pressure must be maintainedafter squeezing.%When squeezing formations that are naturally fractured, it is more important to fill the fractures ratherthan buildup a filter cake.’Smith’ cites a two slurry system as successful in fractures: a highly accelerated slurry <strong>and</strong> a moderate-fluid-lossslurry. Accelerated slurries are pumped into the zones of least resistance <strong>and</strong> allowed to3-17
take an initial set. After the first slurry has gelled, the moderate fluid loss slurry is forced into the narrowerfractures. The first slurry used for this type of squeeze should take an initial set 10 to15 minutes after placement.Liner CementingCementing of liners requires special equipment <strong>and</strong> techniques to obtain a seal in the close clearancesfound between the liner <strong>and</strong> the open hole or the casing string. For more information, thereader is referred to a set of articles by Bowman <strong>and</strong> Sherer, published in World 47-54 Twocementing techniques are use for liner cementing; a modified circulation job (looks much like acement squeeze) <strong>and</strong> a puddle cement technique. In the circulation/squeeze, Figure 3.1 5, the liner<strong>and</strong> associated equipment is run on drill string with a liner running tool <strong>and</strong> a retrievable packerassembly. After the base of the liner is squeezed, usually up to the shoe of the outer casing or slightlyabove, the liner running tool is pulled out of the liner up to a point just above the liner top <strong>and</strong> the topsection of the liner is squeezed. After drillout of the remaining cement, a liner packer, may be run.IaFigure 3.1 5: Liner cementing sequence.(Bowman & Sherrer)Cementing liners, especially deep liners at high pressures, is complicated since the liner is often isolatedfrom the rest of the string by packers <strong>and</strong> close clearances. The result is that pressures are oftentrapped behind the pipe. Pipe collapse <strong>and</strong> deformation are ~ ommon.~~,~~ Liner cementing technologyis little different from full string technology except that pipe movement (including rotation) is done ondrill pipe40r43 <strong>and</strong> use of plugs requires two part plugs. Liner tie back operations may require specialcirculating guidelines because of the narrow clearance^.^^3-18
Liner hanger clearances near the top will be critical in minimizing backpressure if the cement is circulatedaround the top of the liner in a complete circulation job. Close clearances created by a large linerhanger can raise the backpressure <strong>and</strong> the equivalent circulation density. In some cases, this increasein equivalent density is enough to fracture the well.In a puddle job, the cement slurry is spotted by the drill pipe over the section in which the liner is to berun. The volume calculation for the puddle of cement must consider hole volume <strong>and</strong> liner volume.Undetected washouts in the hole can lead to lack of cement around the liner top. Although the procedureis much simpler than the circulation/squeeze technique, it is also often less effective in providinga seal. The technique is used for short liner sections.Frictional Pressure Dropin PipeThe pressure drop of general slurries in pipe is given by:APf =0.039 6, pv2fawheredpf = friction loss, psi,L = length of pipe, ft,p = slurry density, Ib/gal,v = velocity, Wsec,f = frictional factor, dimensionless.The frictional factor isfor general, nonviscous slurries in turbulent flowf=- 0.0303for plug <strong>and</strong> laminar flowNo1612ReReynolds number, NR~, iswhere:K = consistency index, Ib-secN’, per ft2,N’ = flow behavior index, dimensionless.3-19
<strong>References</strong>1. Smith, D. K.: Cementing, SPE Monograph, 1987.2. Smith, R. S.: Internal Amoco Report on Cementing.3. Keller, S. R., Crook, R. J., Haut, R. C., <strong>and</strong> Kuiakofsky, D. S.: “Deviated Wellbore Cementing:Part 1 - Problems,” JPT, (Aug. 87), 955-960.4. API Bulletin RP-lOB,5. Smith, R. C., Calvert, D. G.: “The Use of Sea Water in Well Cementing,” J. Pet. Tech., (June1 975), 759-764.6. Smith, R. C., Powers, C. A., Dobkins, T. A.: “A New Ultralightweight Cement with SuperStrength,” JPT, (Aug. 1980), 1438-44.7. Harms, W. M., Ligenfelter, J. T.: “Microspheres Cut Density of Cement Slurry” <strong>Oil</strong> <strong>and</strong> <strong>Gas</strong> J.,(Feb. 2, 1981), 59-66.8. Davies, D. R., Hartog, J. J., Cobbett, J. S.: “Foamed Cement- A Cement with Many Applications,”SPE 9598, Middle East <strong>Oil</strong> Tech, Conf. Manama, Bahrain, March 9-12, 1981.9. Harms, W. H.: “Cementing of Fragile Formation Wells With Foamed Cement Slurries,” JPT,(June 1985), 1049-1 057.10. Benge, 0. G., Spangle, L. B.: “Foamed Cement - Solving Old Problems with a New Technique”,SPE 11 204, SPE Tech. Conf., New Orleans, Sept. 26-29, 1982.11. Bannister, C. E.: “Evaluation of Cement Fluid-Loss Behavior Under Dynamic Conditions,” SPE7592, Houston, Oct. 1-3, 1978.12. Brice, J. W., Holmes, B. C.: “Engineered Casing Cementing Programs Using Turbulent FlowTechniques,” J. Pet. Tech. (May 1964), 503-508.13. Cheung, P. R., Beirute, R. M.: “<strong>Gas</strong> Flow in Cements,” SPE 11207, presented 57th Annual Tech.Mtg., New Orleans, Sept. 26-29, 1982.14. Bannister, C. E., Shuster, G. E., Woolridge, Jones, M. J.: “Critical Design Parameters to Prevent<strong>Gas</strong> Invasion During Cementing Operations,” SPE 11982, presented Ann. Tech. Mtg., San Francisco,Oct. 5-8, 1983.15. Cheung, P. R., Myrick, B. D.: “Field Evaluation of an Impermeable Cement System for Controlling<strong>Gas</strong> Migration,” SPE 13045, presented Ann. Tech. Mtg., Houston, Sept. 16-1 9, 1984.16. Smith, R. C.: “Successful Primary Cementing Can Be a Reality,” J. Pet. Tech., (November 1984),1851-1 858.17. Sauer, C. W.: “Mud Displacement During Cementing: A State of the Art,” JPT., (Sept. 1987),1091-1101.18. Smirk, D. E., Kundert, D. P., Vacca, H. L.: “Application of Primary Cementing Principles, RockyMountains <strong>and</strong> Texas,” SPE 16208, Prod. Operat. Symposium, Okla. City, March 8-1 0, 1987.3-20
19. McLean, R. H., Manrey, C. W., <strong>and</strong> Whittaker, W. W.: “Displacement Mechanics in PrimaryCementing,” J. Pet. Tech. (February 1967) 251-260.20. Parker, P. N., Ladd, B. J., Ross, W. M., <strong>and</strong> Wahl, W. W.: “An Evaluation of a Primary CementingTechnique Using Low Displacement Rates,” SPE 1234’40th Annual Meeting, Denver, October 3-6, 1965.21. Clark, C. R., Carter, L. G.: “Mud Displacement with Cement Slurries,” J. Pet. Tech. (July 1973),775-782.22. Garcia, J. A.: “Rotating Liner Hanger Helps Solve Cementing Problems,” Pet. Eng. Int. (September1985) 38-48.23. Bowman, G. R., Sherer, B.: “How to Run <strong>and</strong> Cement Liners,” World <strong>Oil</strong> (March 1988), 38-46.24. Crook, R. J., Keller, S. R., <strong>and</strong> Wilson, M. A.: “Deviated Wellbore Cementing: Part 2 - Solutions,”JPT, (Aug 87), 961-966.25. Reiley, R. H., Black, J. W., Stagg, T. O., Walter, D. A., <strong>and</strong> Atol, G. R.: “Cementing of Liners inHorizontal <strong>and</strong> High-Angle Wells at Prudhoe Bay, Alaska,” SPE 16682, 62nd Annual Meeting,Dallas, September 27-30, 1987.26. Wilson, M. A., Sabins, F. L.: “A Laboratory Investigation of Cementing Horizontal Wells,” SPE16928, 62nd Annual Meeting, Dallas, September 27-30, 1987.27. Lee, H. K., Smith, R. C., Tighe, R. E.: “Optimal Spacing for Casing Centralizers,” SPE Drilling<strong>Engineering</strong> (April 1986), 122-1 30.28. API Specification 1 OD, “Casing Centralizers,” Feb. 17, 1986, 3rd Ed.29. Beirute, R. M.: “The Phenomenon of Free Fall During Primary Cementing,” SPE 13045, Ann.Tech. Conf., Houston, Sept. 16-19, 1984.30. Howard, G. C., Fast, C. R.: ‘Squeeze Cementing Operations,” Trans., AIME (1 950) 189, 53-64.31. Baret, J. R.: “Why Cement Fluid Loss Additives Are Necessary,” Paper SPE 17630 presented atthe SPE International Meeting, Tianjin, China, November 1-4, 1988.32. Patton, L. Douglas: “Squeeze Cementing Made Easy,” <strong>Petroleum</strong> Engineer International (October1987), 46-52.33. Rike, J. L.: “Obtaining Successful Squeeze - Cementing Results,” Paper SPE 4608, presented atthe fall meeting, Las Vegas, September 30-October 3, 1973.34. Goolsby, J. L.: “A Proven Squeeze-Cementing Technique in a Dolomite Reservoir,” reprintedfrom Journal of <strong>Petroleum</strong> Technology (October 1969), 1341-1 346.35. Shryock, S. H. <strong>and</strong> Slagle, K. A.: “Problems Related to Squeeze Cementing,” Journal of <strong>Petroleum</strong>Technology (Vol 20, August 1968), 801-807.36. Hodges, J. W.: “Squeeze Cementing Methods <strong>and</strong> Materials,” SPE Squeeze Symposium, Lubbock,March 15, 1918.3-21
37. Carter, L. G.; Harris, F. N. <strong>and</strong> Smith, D. K.: “Remedial Cementing of Plugged Perforations,”Paper SPE 759 presented at the California Regional Meeting, Santa Barbara, October 23-25,1963.38. Edwards, A. G.: “Squeeze Tools,” Squeeze Cementing Symposium, Lubbock, March 5, 1981.39. Brouse, M.40. Gust, D. A., McDonald, R. R.: “Rotation of a Long Reach Liner in a Shallow Long-Reach Well”, J.Pet. Tech., (April 1989), 401 -404.41. Harms, W. M., <strong>and</strong> J. S. Febus, “Cementing of Fragile-Formation Wells With Foamed CementSlurries,” Journal of <strong>Petroleum</strong> Technology (June 1985), 1049-1 057.42. Harms, Weldon M., <strong>and</strong> David L. Sutton, “Ultra-Density Cementing Operations,” Journal of<strong>Petroleum</strong> Technology (January 1983), 61 -69.43. Lindsey, H. E., “Rotate Liners for a Successful Cement Job,” World <strong>Oil</strong> (October 1986), 39-43.44. Lindsey, H. Ed, “Techniques for Liner Tie-Back Cementing,” Production <strong>Engineering</strong>, 1978, 37-39.45. Durham, Kenneth S., “How to Prevent Deep-well Liner Failure (Part l),” World <strong>Oil</strong> (October1987), 46-50.46. Durham, Kenneth S., “How to Prevent Deep-well Liner Failure (Part 2),” World <strong>Oil</strong> (November1 987), 47-49.47. Bowman, Glenn R., <strong>and</strong> Bill Sherer, “How to Run <strong>and</strong> Cement Liners (Part l),” World <strong>Oil</strong> (March1988), 38-46.48. Bowman, Glenn R., <strong>and</strong> Bill Sherer, “How to Run <strong>and</strong> Cement Liners (Part 3),” World <strong>Oil</strong> (June1 988), 55-58.49. Bowman, Glenn R., <strong>and</strong> Bill Sherer, “How to Run <strong>and</strong> Cement Liners (Part 4),” World <strong>Oil</strong> (July1 988), 84-88.50. Bowman, Glenn R., <strong>and</strong> Bill Sherer, “How to Run <strong>and</strong> Cement Liners (Part 5),” World <strong>Oil</strong> (September1 988), 65-70.51. Bowman, Glenn R., <strong>and</strong> Bill Sherer, “How to Run <strong>and</strong> Cement Liners (Part 6),” World <strong>Oil</strong> (October1988), 69-72.52. Bowman, Glenn R., <strong>and</strong> Bill Sherer, “How to Run <strong>and</strong> Cement Liners (Part 7),” World <strong>Oil</strong>(November 1988), 75-79.53. Bowman, Glenn R., <strong>and</strong> Bill Sherer, “How to Run <strong>and</strong> Cement Liners (Part 8),” World <strong>Oil</strong>(December 1988), 71-74.54. Bowman, Glenn R., <strong>and</strong> Bill Sherer, “How to Run <strong>and</strong> Cement Liners (Part 9),” World <strong>Oil</strong> (January1989), 44-48.55. Goodwin, Joe, “Centralizer Placement in Deviated Holes,” Drilling (April 1985), 54-57.3-22
56.57.58.59.60.61.62.Parcevaux, Philippe, “Guides Emerge for Cementing Horizontal Strings,” <strong>Oil</strong> & <strong>Gas</strong> Journal,October 19, 1987, 35-41.Smith, R. C., R. M. Beirute, <strong>and</strong> G. B. Holman, “Improved Method of Setting Successful CementPlugs,” Journal of <strong>Petroleum</strong> Technology (November 1984), 1897-1 904.Rike, J. L., <strong>and</strong> Erik Rike, “Squeeze Cementing: State of the Art,”Journal of <strong>Petroleum</strong> Technology(January 1982), 37-45.Sauer, C. W., <strong>and</strong> W. R. L<strong>and</strong>rum, “Cementing - A Systematic Approach,” Journal of <strong>Petroleum</strong>Technology (December 1985), 21 84-21 96.Hartog, J. J., D. R. Davies, <strong>and</strong> R. B. Stewart, “An Integrated Approach for Successful PrimaryCementations,” Journal of <strong>Petroleum</strong> Technology (September 1983), 1600-1 61 0.Mahony, Bernard J., <strong>and</strong> John R. Barrios: “Cementing Liners Through Deep, High PressureZones,” <strong>Engineering</strong> Essentials of Mud Drilling, HBJ Publishers, 1962.Smith, R. C., R. M. Beirute, <strong>and</strong> G. B. Holman, “Postanalysis of Abnormal Cementing Jobs with aCementing Simulator,” SPE Production <strong>Engineering</strong> (August 1987), 157-1 64.Cementing: Review Questions1.2.3.4.Calculate the buoyant weight of 9-5/8 in., 47 Ib/ft, N-80 casing when 16.4 Ib/gal cement justreaches the shoe <strong>and</strong> there is a 8.33 Ib/gal surfactant water flush in the annulus.Derive a formula for the required density of a displacing flush that will give a neutral density witha flush PO.For a well with a fracture gradient of 0.6 psi/ft at 7000 ft, calculate the maximum cement heightabove the zone when using 16.4 lblgal cement (use a maximum bottomhole pressure of 200 psibelow frac pressure).For the example in #3, calculate the cement density that will allow a full cement column to surface(use a maximum bottomhole pressure of 200 psi below frac pressure).3-23
Chapter 45Packer Selection <strong>and</strong> Tubing ForcesPackers create a seal between the annulus <strong>and</strong> tubing. They may also serve as anchors <strong>and</strong>/or hangersfor tubing strings. Although the concept of a packer is simple, the variety in devices is extensive. Apacker may be described by its setting mechanism; hydraulic or mechanical, by its running mechanism;wireline or tubing, by its permeance; permanent or retrievable, by its function or by some otherdescription. Its purpose is clear, it is the main downhole wellbore pressure control in many wells. Slipsanchor the packer in place in the casing, a necessity where differential pressures exceed severalthous<strong>and</strong> psi. Mechanical set packers set their slips by pushing a wedge- or cone-shaped pieceagainst a set of tapered slips (hardened steel gripping surfaces) to drive the slips out <strong>and</strong> into the casingwall. Mechanical energy is supplied by tubing rotation, tension, or compression. Hydraulic setpackers set slips by fluid pressure, supplied by liquid or gas generating explosive charge. The slipsare made on pistons that move out laterally for the few millimeters needed. The pistons may bedesigned to retract when pressure is released or remain out in some permanent installations. Packerslips are usually designed to hold in one direction, acting as an anchor to resist upward movement oras a hanger to resist downward movement. By using two sets of opposing slips, the packer can beanchored from either direction. An accompanying packing element (an elastomer, e.g., synthetic rubber)is exp<strong>and</strong>ed by the slip setting action tubing or pressure which exp<strong>and</strong>s the seals against the wallof the pipe <strong>and</strong> generates a pressure tight seal.The purposes of packers are:1. Casing protection from pressure or fluids in the tubing2. Separation of zones3. Subsurface pressure <strong>and</strong> fluid control for safety4. Artificial lift support equipmentPicking the right packer requires knowledge of the operational <strong>and</strong> completion requirements. This putsan early design load on completions/operational engineers: get it right or risk an early workover toreplace a poorly selected packer.Packers can be selected with aid of a decision tree planner such as shown in Figure 4.1. If a fully openwellbore is not required, the choice will most often be a permanent packer. As the name implies, thepermanent packer is a permanent feature of the well. Removal requires milling of the slips.Production PackersA gas well completion with a packer can often eliminate problems of produced liquid heading <strong>and</strong>loading if a tail pipe is run below the perforations. For some wells, including many older wells withincreasing water cut <strong>and</strong> decreasing flowing tubing pressure <strong>and</strong> rate, smaller tubing or “velocitystrings” can assist in keeping the gas velocity high enough to lift the liquids?Because the packer seals the tubing string, it must have compatibility with string size <strong>and</strong> string movement.The packer must be metallurgically compatible with produced fluids <strong>and</strong> the metal in the tubingstring. Elastomers must be stable at operating temperatures, pressures <strong>and</strong> in produced fluids <strong>and</strong>completion or stimulation fluids.Special EquipmentWhen large pressure differentials are expected in any tool that needs to be released, a pressureequalizing valve must be incorporated to keep the pressure from driving packer <strong>and</strong> tubing up (or4-1
Isapncker<strong>and</strong>ffor Isolation?ard metalselectionFigure 4.1:(modified from Peden)A packer selection criteria flow sheet.down) the well. Most valves work with the first tubing movement; opening a vent between upper <strong>and</strong>lower sections before the continued tubing movement releases the anchoring slips.When the tubing must be routinely pulled, a plug profile in the packer <strong>and</strong> an ON/OFF tool eliminateskilling the A wireline plug may be set in the profile in the packer to shut in the well <strong>and</strong> the tubingmay be pulled while the retrievable packer remains in place with the well shut in. The well is effectivelycontrolled by the packer <strong>and</strong> plug for repair or replacement of the tubing, without needing to kill thewell.Various types of packers are schematically illustrated in Figure 4.2. The discussion that followsdescribes several of the features3-’Solid head retrievable tension packers are used when the pressure below the packer is greater thanthe annulus pressure above the packer. This commonly occurs in an injection well or during low pressuretreating. Tension packers are preferred in injection wells so that the slips are in the annulus:away from the corrosive effects of the injected fluid. Caution must be exercised when setting tensionpackers on small diameter tubing in a well with large diameter casing. In some cases, such as 2-3/8 in. tubing in 7 in., casing the tension needed to set the packer may exceed the tensile strength ofthe tubing.8 When a force is applied to the tubing, it will respond by stretching. Figure 4.3 can be usedto estimate stretch on tubing for an applied force.Solid head retrievable compression packers are used when pressure above the packer is greater thanthe pressure below the packer. This normally occurs in a producing well with a full annulus of packer4-2
VUVEIIUmIcRIIPFigure 4.2:(from Guiberson)Examples of various packers that might be used in a normalcompletion.VALVEau?WMUWUC#SEALSRIBEERSLIPfluid. The compression set packers are the easiest to unseat <strong>and</strong> pull. Both compression set <strong>and</strong> tensionset packers can be affected by tubing length changes caused by pressure fluctuations <strong>and</strong> temperaturechanges. Probably the most popular retrievable packers use a J-latch set with tubing rotation<strong>and</strong> slack off as the setting forces. When the tubing is latched in or otherwise solidly connected, carefulconsideration must be given to temperature effects to avoid cork screwing <strong>and</strong> buckling the tubing.Retrievable packers have a wide range of applications but are not used in deviated, thermal, or deepwells where tubing movement may be a severe problem.Retrievable hydraulic set packers are set by applying hydraulic pressure in the tubing. The pressureexp<strong>and</strong>s the elements <strong>and</strong> sets the slips against the wall of the casing. This packer may be removable<strong>and</strong> is usually released by pulling on the tubing which shears pins or opens a valve within the packer<strong>and</strong> releases the seals <strong>and</strong> slips. Hydraulic packers are very common in dual completions, especiallyin deviated wells.Dressing PackersEquipping a packer for the characteristics of an individual well is called “dressing” a packer. Mostpackers will work in a range of casing weights of a particular size casing.Allowing Tubing MovementPolished seal bore packers are usually permanent packers set at a predetermined depth by eitherwireline or tubing. A seal assembly attached to the bottom of the tubing string is stung into the packerpolish bore receptacle to achieve sealing. In wells with a severe amount of tubing movement, a longseal assembly <strong>and</strong> a polished seal bore packer are used to establish a slip joint to let the tubingexp<strong>and</strong> <strong>and</strong> contract as needed.4-3
Effects of TemperatureAny well component will react to a change in temperature by a volume or reaction change. The componentsaffected by temperature include tubulars, produced fluids, cements, acids, <strong>and</strong> corrosionproperties. The changes in these fluids <strong>and</strong> materials, especially when the changes are unexpected,may lead to failures in components of the well. In most wells, a value for bottomhole temperature,BHT, is usually available from logging runs. As with most remotely sensed values, the BHT should bechecked with other methods to make sure the value is correct. An incorrect BHT may lead to expensiveproblems with an otherwise correctly designed completion.As a check on BHT, use the following formula. Average temperature gradient is 1.6"F per every 100 ftof true vertical depth, d. The formula is BHT = T, + (0.1) (U) (1.6), where T, = average surface temperatureOF. Gradients vary with geothermal activity. Substitute the local gradient for the 1.6 value. Withthe correct gradient values for individual areas, bottomhole temperature may vary by a factor of 2 forwells of the same depth but in different thermal activity areas.Changes in temperature are at least as important as the total temperature. The first change in temperatureis experienced as the well warms up from a circulating BHT to the static BHT. Whenever the wellis circulated with a cooler fluid, BHT decreases. The rate of warming after circulation is stopped,depends on the amount of temperature differential between the static <strong>and</strong> circulating BHT <strong>and</strong> the volumeof circulation that has occurred. Wells that have experienced long-term injection or circulation ofcool fluids will reach static BHT much slower than wells in which the injection or circulation is limited.In general, the following statements describe how temperature affects the tubing or casing in a wek71. The tubing temperature is assumed to be the same as the injected fluid if no circulation isinvolved. If circulation occurs, the temperature of the top few tubing joints will be the same as theinjected fluid, but the "temperature front" will only slowly work down. The analogy of heat transferin a circulating well is that of a shell-<strong>and</strong>-tube heat exchanger. The fluid rising in the annulusexchanges heat with the injected fluid.2. In injection without circulation, or in the case of produced fluids, assume the entire tubing stringis the same temperature.3. The temperature of an unheated injected fluid is assumed to be the same as the ambient air temperaturein an onshore well. In offshore wells, injection of sea water from a deeply placed intakeor injection of any fluid into a deep water well where the riser is not appreciably insulated c<strong>and</strong>rastically lower the temperature. The coldest point in these systems is the mud line ternperature.4. In a dual packer situation, treat each string as a separate calculation. The calculations on dualstrings are made with the bottom string first, working up to the top.The assumptions that all the tubing be considered as the same temperature is a simplifying move. It isa "worst possible case" that will result in a more conservative design (higher than needed safety factor).Where temperature alone affects the pipe, steel exp<strong>and</strong>s or contracts 0.0000828" per ft per O Fgained or lostThe extremes of temperature change in well completion <strong>and</strong> producing operations is usually seen incompletions that are exposed to thermal stimulation or cyclic thermal production (or steam injection).The effect of tubing <strong>and</strong> casing length changes in the wells that are thermally cycled is covered in thechapter on thermal completions. Other severe cases of temperature cycling occur in a CO2-flood environment.In both injection <strong>and</strong> production wells, CO2 expansion may significantly reduce temperature.4-4
Deep CompletionsDeep well operations pose special problems. In most deep well operations, the use of retrievablepackers is extremely limited. Most operators choose to use a permanent packer for reasons of tubingmovement (with a PBR) <strong>and</strong> with temperature <strong>and</strong> pressure limitations on some retrievables.11f’2IsolatesCasing AboveLinerFrom Producing FluidsNo No No NIA Yes Yes No No YesFigure 4.4:A Comparison of features <strong>and</strong> limitations of several packer types for deep completions.The descriptions refer to the packers listed in Figures 4.5 to 4.13.4-5
Figure4.5:The simplest method of allowingtubing movement. A permanentpacker with internalpolished bore receptacle <strong>and</strong>seals on tubing.Figure4.6:A seal bore or polished boreadded to the packer to giveextra sealing <strong>and</strong> protectionagainst corrosive fluids.I'I(left) An alternative toa packer is a liner topreceptacle <strong>and</strong> sealassern bly.Figure 4.8:(right) The same completionas in 5.7except that the lineris cemented in place.(no liner hanger).4-6
Figure4.9:Liner top receptacle <strong>and</strong> permanentpacker sharing commonseals on tubing.Figure 4.10:Seal bore extension belowpacker <strong>and</strong> separate liner toprecept.W BFigure 4.11:Packer with extra long sealreceptacle to allow for tubingmovement in extreme operatingconditions.4-7
Figure 4.12:Polished bore receptaclemounted on top of thepacker.Figure 4.13:Combination of a liner topreceptacle (below) <strong>and</strong> a polishedbore receptacle (above)on top of the permanentpacker. This isolates linermovement from tubing movement.Seal ConsiderationsSuccessful seal selection involves specifying a seal that will operate at the production <strong>and</strong> treatingconditions. The seal bore assembly may range from 1 to 3 ft in cool operations to over 30 ft in extremecases of temperature ~ycling.’~ Seal materials such as those in Figure 4.15 are common in the industry.There are no universal elastomers (polymer, plastic, rubber, etc.) that are suitable for all uses.Seals must be selected on the basis of cost, thermal environment <strong>and</strong> chemical resistance. Seals maydeteriorate by swelling, gas permeation, softening, hardening, nibbling under pressures, or failure ofthe internal bonding system that holds the elastomer compound together.21Inserting the seal assembly on the tubing into the polished bore receptacle, is referred to as stab-in. Itis the first <strong>and</strong> often the most severe task that a seal system must undergo.13 Damage caused by runningmay be overcome with a protective sleeve around the seals. Metal spacers between the seals areused to decrease damage from friction during ~tab-in.’~4-8
Seal Material1 = satisfactory2 = fair (OK for static seal)Figure 4.14: Chemical Resistance of Several Seal CompoundsSeal ProblemsThe force to pull out of a seal assembly may often be more than expected due to normal seal friction,pressures above <strong>and</strong> below the seal, areas on which the pressure can act, solids covering the sealarea, <strong>and</strong> seal problems such as seal deteriorization that will cause sticking.The general force balance to unseat a seal in good condition is:whereF = upward force,W = mass of the string,Pa = pressure above seals,A, = area on which Pa is exerted,Pb = pressure below seals,Ab = area on which Pb is exerted,C = the seal friction for the mechanism.See Figures 4.1 8 <strong>and</strong> 4.1 9 for details on areas.Tubing <strong>and</strong> Packer ForcesForces on the packer may come from fluid pressure experienced during production <strong>and</strong> from packerfluid or other source of annulus pressure. In all these calculations, it must be remembered that allthe changes of pressure <strong>and</strong> temperature are changes from some original or starting pointcondition.The are four classifications of tubing movement caused by pressure or temperat~re.’~-*~4-9
All the movements but buckling can be expressed as a force, <strong>and</strong> each force is a straight line functionof pressure or temperature differential.1. Temperature - Tubing length changes with temperature change, exp<strong>and</strong>ing with a temperaturerise <strong>and</strong> contracting with a decrease in temperature. The change in length is:AL, = CLAtwhere:AL4 = change in length, inchesC = coefficient of expansion, for steel C= 6.9 x 1OW6/OFL = length of tubing, inchesAt = average temperature change, O F from initial.The force, f4, caused by temperature change on tubing latched in place is:F, = 207 Ata A,where:F4AtaA,= temperature induced force, Ib= change in average temperature of tubing, O F= cross-section area of tubing, sq. in.2. Piston Effect - The internal <strong>and</strong> external tubing pressures at the packer act on the differentialarea created by the tubing <strong>and</strong> packer m<strong>and</strong>rel to change the tubing length.AL1 = -EA,[ (Ap- AiIAPi- (Ap-Ao)APo](4.3)where:AL, = change in tubing length, in.L = length of tubing string, in.E = modulus of elasticity for steel = 3 x 1 O7 psiA, = cross-sectional area of tubing, in.2Ap = area of packer bore (stinger), in.2Ai = area of tubing id, in?Ao = area of tubing od, in.*APi = change in pressure inside tubing at packer, psiAPo = change in pressure in annulus at packer, psiWhen the tubing is latched in place, the force created by the piston effect is:4-10
Fl = [ (Ap-Ai)APi- (Ap-Ao)APo](4.4)3. Ballooning - The ballooning effect is the result of pressure changes inside <strong>and</strong> outside the tubing.It may be expressed by:2L APia - R2 APoaAL3 = -[108 R2- 1In latched tubing, the force, F3, generated is:1where:F3 = ballooning force, IbsR = ratio of tubing OD to IDL = tubing length in inchesAPia = change in average tubing pressure, psiAi = inside area of tubing, sq. in.APoa = change in average annulus pressure, psiA, = outside area of tbg., sq. in.The (APjdj) term is the shortening effect of ballooning <strong>and</strong> the (AP,,tA,) term represents a forcethat tries to lengthen the tubing.4. Buckling - buckling of the tubing can be caused or increased by a variety of conditions. Some ofthese are: (1) upward acting packer forces, (2) higher pressure inside the tubing than outside,(3) increased casing diameter to tubing diameter ratios, (4) lower density fluid in the tubing thanin the annulus, <strong>and</strong> (5) larger packer bores.Buckling of the tubing above a packer permitting free motion will shorten the tubing. Such bucklingis a result of the differential between the pressure inside the tubing <strong>and</strong> that outside the tubingacting on the full cross-sectional area of the packer bore at the tubing seal. Where thepacker limits tubing motion, the tubing weight set on the packer must also be considered.Calculation of the length change from buckling forces are shown in the following formula.AL2=- r2AP (A Pi- A PO)8 El ( ws + wi- wo)(4.7)where:A 4rAp= contraction of tubing, in.= (casing ID -tubing OD) + 2, in.= area of stinger OD (packer bore), sq. in.4-1 1
E = Modulus of elasticity for steel (30 x 1 O6 psi)APi = change in pressure in TBG. @ packer (affected by applied surface pressure <strong>and</strong>change in fluid density in TBG.), psiAPo = change in pressure in annulus @ packer (affected by applied surface pressure <strong>and</strong>change in fluid density in CSG.), psiI = moment of inertia of TBG. around its axis = d64 (OD4- ID4)w, = weight of TBG./in. in air (1/12 of nominal weighvft)Wj = weight of fluid inside one inch length of TBG. (fluid density x area of TBG. ID)w, = weight of annular fluid displaced by one inch length of tubing (density of CSG. fluidtimes area of TBG. OD)The tubing constants for W, + Wj+ W, are shown in Figure 4.1 6. Since the values for I, w, Wj,<strong>and</strong> w,, for common size tubing <strong>and</strong> mud weights will become constants, the term:2.40;:E 2.902.0003.402-1/163.402-318 4.702-7/8 6.503-112 9.20Tubing OD Welght Wl<strong>and</strong> WOt-+-+(Inches) (lbslln.) (lbdln.)1.660 w, - 200 W\1 .go0 w, - 242 WO2-318 w, 9.39252.355.065-.062.086-.m.OS-.073.101-,095.134-.142.196-213291-1.3933.142 2.190 1.4343.341 2.405 .428 1.3894.430 3.126 1.304 .704 1.4176.492 4.880 1.012 1.611 1.3079.632 7.031 2.590 3.885 1.368w,+ w,. w,I I 1Figure 4.16:Tubing Constants <strong>and</strong> Values of A, A,, A, 1, <strong>and</strong> (W, + W, - WO) for Use in Buckling Calculationsr2 Ap28E/( Ws+ Wi- WO)will become a constant for any particular completion. Once the constant is calculated, a curvecan be plotted for varying (APi- AP,). There is no buckling movement caused by differentialpressure when annulus pressure is greater than the tubing pressure; the tubing will have buck-4-12
ling movement caused by differential pressure only when tubing pressure is greater than annuluspressure at the packer.''v20Length or Force Changes?Whether tubing length change or force change calculations are needed depends on how the tubing isattached to the packer.vb1. If there is no packer <strong>and</strong> the tubing is freely suspended (not touching the bottom of the well), alleffects produce a length change.2. If the tubing is l<strong>and</strong>ed on the packer, it is restrained from moving downward. Positive lengthchanges cannot occur <strong>and</strong> are translated to force. Tubing shortening can occur.3. If the tubing is latched into the packer, no movement can occur in either direction <strong>and</strong> all effectsare converted to forces.4. If the tubing is stung through the packer, all effects will be length changes unless the stop at thetop of the seal assembly contacts the packer. If the tubing elongates enough to engage the stop,the movement will then be converted to force.5. If the tubing is set in tension or compression, the effects of pressure or temperature inducedforce changes are added or subtracted from the force in place before the change. Sometimesthese changes are enough to unseat the packer.Example: A well is completed with a PBR packer set at 9300 ft. <strong>and</strong> uses, 4-1/2 in., 12.6 Iblft, N-80tubing. The tubing weight (compression) on the shoulder of the PBR is 20,000 Ib, at flowing conditionsof bottom hole flowing pressure of 1700 psi, <strong>and</strong> a surface pressure of 250 psi. The averageproducing tubing temperature is 250" F. The average tubing injection temperature is 75°F. Use fracturepressures calculated in problem 2. What seal assembly length is needed to keep from pulling outof the PBR during a fracture stimulation? Assume that the seal assembly needs to be 1 ft longer thanthe length change from ballooning <strong>and</strong> temperature change. Consider both temperature <strong>and</strong> ballooningforces (ignore buckling <strong>and</strong> piston force). Seal assembly OD <strong>and</strong> ID are same as 4.5 in. tubing(4.5 in. <strong>and</strong> 3.958 in. respectively).Solution:First, account for the 20,000 Ib force, DF , with temperature change =>AF = 207 A, AtA, = cross sectional area of tubing wall, in2At = change in average tubing temperature, OFA, = n/4 (4.52 - 3.9582) = 3.6 in2At = [20,000/ ((3.6)(207))l = 36.8 OF (this is the temperature change (cooling) in the tubing that isrequired to remove the 20,000 psi of force load applied by the tubing at the packer. Remaining temperatureis (250 - 75) - 26.8 = 148.2"F.Now, what length change will be produced with a temperature change (cooling) of 148.2OF?AL = LCAtL = length, inchesC = coefficient of thermal expansion, 6.9 x 1 0-6At = change in average tubing temperature, OF4-13
AL = (9300 x 12) (6.9 x 1 0-6) (1 48.2) = 11 4.24 inches = 9.51 ftBallooning Induced Pipe Length MovementAL(-2L$E) [(APia-R2APoa)/(R2-1)]E = modulus of elasticity, 30 x 106L = length, inchesy = Poisson’s ratio, 0.3 for steelR = ratio of tubing OD to IDAPia = change in average tubing pressure, psiAPoa = change in average annulus pressure, psiAL = change in tubing length, inAPia = ?tubing pressure before = (1700 + 250)/2 = 975 psitubing pressure after = (7836 + 4423)/2 = 6130 psi(the 7836 psi = BH frac pressure D hydrostatic back to packer, or= [9600 ft x 0.83 psi/ft] D [(9600 - 9300) ft x 8.5 x 0.0521 = 7836 psi.(the 4423 psi way surface pressure during fracturing).APia = (6130 - 975) = 5155 psiR = 433.958 = 1.1 37, R2 = 1.293AL = (-2L$E) [(APia-R2APoa)/(R2-1)]AL = (-2 (9300) (12) (0.3) / (30 X 1 06) ) [((5155 A ((1.293) (0))) / (1.293-l)]AL = (-(0.002232)) (51 55 / 0.293) = 39.27 inches = 3.27 ftThe total length change = 9.51 + 3.27 = 12.78 ftThe stinger needs to be at least 12.8 + 1 ft = 13.8 ft long to keep the tubing from pulling out of thepacker during the fracture stimulation. A greater safety margin than 1 foot is common.Setting the PackerSuccessful packer setting depends on having a clean set point in the casing. Before a packer is set, acasing scraper, Figure 4.1 7, is run to remove mud, scale, cement, or corrosion debris <strong>and</strong> mill scale.Chances of successfully setting the packer go up sharply when a casing scraper is run. Some personnelresist running a scraper because of creating debris that can go to the perforated interval <strong>and</strong>cause formation damage.L .. .Figure 4.17:--aa- ----(OM scraper, Composite Cat.)An example of a casing scraper. They are run prior to setting a packerto clean the casing set point.The effect of pressure in the annulus <strong>and</strong> in the tubing on the packer depends on the tubing/packerconfiguration. When the tubing id is larger than the bore of the packer, Figure 4.1 8, the annulus pres-4-14
sure pushes up <strong>and</strong> the tubing pressure pushes down. When the tubing id is smaller than the packerbore, Figure 4.19, the annulus pressure pushes down <strong>and</strong> the tubing pressure pushes up. The effectof pressure in this example is a piston effect.Figure 4.18:When the tubing id is larger than the bore of thepacker, the annulus pressure pushes up <strong>and</strong> the tubingpressure pushes down.Figure4.19: When the tubing id is smaller than thepacker bore, the net force may beupward for equal pressures of PO <strong>and</strong>pi.4-15
In a sting through completion with a very short seal assembly or in a latch in completion, it is necessaryto know how much weight to set off on the packer. Assuming the tubing id is smaller than thepacker bore, the needed weight would be the product of the expected operating pressure times thedifference in area between the tubing id <strong>and</strong> the packer bore.21Packers are always tested for seal after setting. If the test pressure is too high, the packer can unseat<strong>and</strong> move. In a tension set packer, for example, the maximum annulus pressure for test can be calculatedas follows.21An injection well is equipped with a tension set, hook wall packer. The tubulars are 7 in., 23 Ib/ft, N-80,(id = 6.366 in., Ai = 31.8 in.2) casing <strong>and</strong> the tubing is 2-7/8 in., 6.5 Ib/ft, C-75 (id = 2.041 in., Ai =6.5 in.2) tubing. The packer is set with 18,000 psi Ib tension with the annulus filled with treated water(density = 8.4 Ib/ft). The annulus pressure that can be applied before the packer releases is: (Rememberthat fluid pressures must account for the hydrostatic gradient.)P=18,000 lb((31.8-6.5) inch)2= 739psiIn the surface pressure test, pressure up to 739 psi could be applied before the packer would unseat<strong>and</strong> move.Combined ForcesThe combination of temperature <strong>and</strong> pressure effects on the length of the tubing produces a netchange. The values from the previous four calculations are added to give a net movement or force.The stresses produced by pressure on the packer itself are also important <strong>and</strong> will determine if weightset or tension packers will become unseated under particular operating conditions. The pressure,either annulus or well pressure below the packer act on the exposed areas of the packer. The methodof calculations of the packer forces is to sum the forces; upward acting forces are negative. There arethree forces that must be considered - (1) tubing weight or tension, (2) annular pressure force <strong>and</strong>(3) the pressure acting on the bottom of the packer. The annular pressure force is:where:FpA = Annular force exerted by the pressure at bottomhole, IbsAa = Area of inside of casing, in.2ATO = Area of tubing od, in.2PAB = Annular bottomhole pressure, psiThe force pressure underneath the packer is:where:(4.1 0)4-16
FPT = Force beneath the packer exerted by fluid in casing, IbAc/= Area of inside of casing, in2AT, = Area of inside of tubing, in2PTB = Pressure from fluids in casing below packer, psiThe piston force, previously described, is the net effect of the forces trying to push the seal into or outof the packer.Special PackersThere are a number of packers that are made for special applications. Coiled tubing packers are availablethat will pass through 3-1/2 in. tubing <strong>and</strong> packoff in 7 in. casing.22 Inflatable packers are madethat can be filled with cement for permanent repairs under partially collapsed casing, Figure 4.20.’These packers are also used to packoff in openhole. Many packers are made of drillable materialsthat can be removed easier than the permanent packers that must be milled.23 This type of packerincludes many of the cement retainers <strong>and</strong> squeeze tools.- Liner- Collapsed CasingFigure 4.20:Inflatable packer shown in acased hole section below apartially collapsed section.Tubing Stretch <strong>and</strong> CompressionWhen packers are set by tension or weight of tubing, some deformation of the tubing is to beexpected. Pulling force to set a tension set packer may stretch the tubing several feet depending onamount of pull <strong>and</strong> size of tubing. Figure 4.3 can be used to estimate the ~tretch.~ Compression setpackers can result in tubing buckling <strong>and</strong> some steel compression. This accounts for a small amountof length <strong>and</strong> reduces the amount of weight that is set off on the packer.ProblemsA 10,000 ft well with 7 in. casing has a permanent packer set at 9300 ft. A seal bore assembly with 8 ftof seals on the end of a 3-1/2 in. tubing string is stabbed into the packer. Four ft of seals extend into4-17
the packer at constant producing conditions. BHT = 185°F. BHP = 4600 psi. Production is 1000 bpdwith a 30% water cut. API gravity = 32”. The flowing bottom hole pressure is 4400 psi, shut in BHP is5100 psi <strong>and</strong> the frac gradient is 0.7 psi/ft. Packer seal bore is 3.7 in. Tubing is 10.3 Ib/ft, with id =2.922 in. <strong>and</strong> seal od = 3.6 in. The well is shut in for 24 hours <strong>and</strong> then fractured with 50,000 gal ofwater based frac fluid. Surface temperature is 85°F.1. What effect will the temperature change produce on the tubing?2. What will be the piston effect?3. What will be the buckling effect?4. What will be the ballooning effect?5. Will the tubing unseat from the packer during the job?<strong>References</strong>1.Buzarde, L. E., Kaster, R. L., Bell, W. T., DePriester, C. L.: Production Operations Course 1 -Well Completions, Society of <strong>Petroleum</strong> Engineers, Lecture notes for a video course, 1972.2.Wesson, H. R. Jr., Shursen, J. L.: ”Coiled Tubing Velocity Strings Keep Wells Unloaded,” World<strong>Oil</strong>, (July 1989), pp. 56-60.3.58.: “Pick the Right Production Packer,” Pet. Eng. Int. (September 1987), pp. 54,57, <strong>and</strong>4.5.6.7.8.9.10.11.12.13.Patton, L. D., Abbott, W. A.: Well Completion <strong>and</strong> Workovers -Tubing <strong>and</strong> Packer Systems,” Pet.Eng, Int., (May 1981), pp. 137-144.Smart, E. E. Sherwood, J. H.: ”Special Jobs: Workover Packer Selection,” <strong>Oil</strong> Patch,(March/April 1981)Smart, E. E.: “How to Select the Right Packer for the Job,” Pet. Eng. Intl., (July 1978)Packer Completion Techniques, Guiberson Publication.Conversation with Jerry Bowen, Amoco, Sept. 1, 1989O’Brian, T. B. Webster, K. B.: “Deep Duals Simplified” SPE 3904, 1972.Holliday, G. H.,: “Calculation of Allowable Maximum Casing Temperature to Prevent TensionFailures in Thermal Wells,” ASME Pet. Mech. Eng. Conf., Tulsa, Sept. 21-25, 1969.Moseley, N. F.: “Deep Well Completion Methods,” Production Operations, Pet. Eng. Int. Pub.,pp. 48-50, 1978.Moseley, N. F.: “Graphic Solutions to Tubing Movement in Deep Wells,” Prod. Operations, Pet.Eng. Int. Pub., pp. 31-35, 1978. Rubbo, R. P.: What to Consider When Designing DownholeSeals,” World <strong>Oil</strong>, (June 1987), pp. 78-83.Lubinski, A., Althouse, W. S., Logan, J. L.: “Helical Buckling of Tubing Sealed in Packers,” Trans.AIME, June 1962, p. 655.4-18
14. Lubinski, A.: “Influence of Neutral Axial Stress on Yield <strong>and</strong> Collapse of Pipe,” Trans., AIME(1 975) 97.15. Hammerlindl, D. J.: “Movement, Forces <strong>and</strong> Stresses Associated with Combination TubingStrings Sealed in Packers”, J. Pet. Tech., (Feb. 1977), 195-208.16. Hammerlindl, D. J.: “Basic Fluid <strong>and</strong> Pressure Forces on <strong>Oil</strong> Well Tubulars,” J. Pet. Tech., (Jan.1 980), 153-1 59.17. Hammerlindl, D. J.: “Packer-to-Tubing Forces for Intermediate Packers,” J. Pet. Tech., (March1980), 51 5-526.18. Lubinski, A., Blenkarn, K. A.: “Buckling of Tubing in Pumping Wells, Its Effects <strong>and</strong> Means forControlling It,” Trans., AIME, (1 957) 97.19. Patton, L. D., Abbott, W. A.: “Well Completion <strong>and</strong> Workovers - The Tubing/ Packer System:Movement <strong>and</strong> Forces,” Pet. Eng. Int., 112-122.20. <strong>King</strong>, P. G.: “Basic Hydraulics as They Affect Packer Calculations,” SWPSC, Lubbock, pp. 45-48.21. Technical H<strong>and</strong>book, Properties of Chemical Compatibility of Elastomers for Seals, Fluid SealingAssociation, 2017 Walnut Street, Philadelphia, Pa. 191 03.22. Evett, A.: “Thru-Tubing Straddle Packer Exp<strong>and</strong>s, Seals in Casing”, Ocean Ind., (Feb. 1989),p. 44.23. Hushbeck, D. F., Streich, S. G.: “Drillable Service Packer Systems Increase Well Service Versatility,”SPE 18896, Prod. Oper. Sym., Okla. City, March 13-14, 1989.24. Hushbeck, D. F.: “Precision Perforation Breakdown for More Effective Stimulation Jobs,” SPE14096, Int. Pet. Mtg., Beijing, China, March 17-20, 1986.4-19
Chapter 5:Well Heads, Chokes <strong>and</strong> SSSVsWell headsWellheads are the connection point for the tubulars <strong>and</strong> the surface flow lines as well as being the surfacepressure control point in almost any well operation. They are rated for working pressures of2000 psi to 15,000 psi (or greater). They must be selected to meet the pressure, temperature, corrosion,<strong>and</strong> production compatibility requirements of the well. There are three sections of a wellhead,<strong>and</strong> each serves a function in the completion of a well.’ The outermost cemented casing string, usuallyeither the conductor pipe or the surface string, is fitted with a slip type or threaded casing head.The head, Figure 5.1, also called a well head flange, supports the BOPs during drilling <strong>and</strong> the rest ofthe well head during production. A port on the side of the head allows communication with the annuluswhen another casing string is run. For all additional casing strings, a casing spool is used. The spoolhas a flange at each end. The flange diameter, bolt pattern <strong>and</strong> seal assembly are a function of thespool size range <strong>and</strong> the pressure rating. When specifying well head equipment, all pieces should berated for the same pressure. The tubing is hung <strong>and</strong> isolated in a tubing spool. The tubing is “spacedout” to come to the right height for the seal assembly by the use of pup joints (short pieces of tubing).Annulus communication is provided in the ports on the side of the spools.Figure 5.1:(Kastor, 1972)Wellhead assembly showing casing <strong>and</strong> tubinghangers. The casing head is screwed orwelded to the conductor or surface string.Each spool has alignment screws for aligning the tabular in the center of the spool. Alignment is criticalsince each flange connection (bolt hole alignment) depends on the last casing being in the centerof the spool below it.Multiple tubing strings can be accommodated by special heads. These head designs depend on isolationseals in the well head <strong>and</strong> multiple tubing spools. Setting the tubing <strong>and</strong> casing strings in tensionis a common practice to offset the effects of buckling created by tubing expansion when hot fluids areproduced.5- 1
The seal between each section is a single metal ring that fits in grooves in the top <strong>and</strong> base of connectingspool sections. The pressure to seat these metal-to-metal seals is provided by compressionwhen the section flanges are bolted together. <strong>Oil</strong> is applied to the seals before bolting down theflanges. Various methods <strong>and</strong> devices for sealing have been tested for seals. Elastomers are subjectto attack by solvents2 <strong>and</strong> temperature ~ycling.~ Metal to metal seals are the most common, especiallyin severe service areas. In sour gas (hydrogen sulfide) areas, special metals are often needed forwellhead^.^The final section of the wellhead is the familiar “Christmas tree” arrangement of control valves. Thetree sits on top of the tubing hanger spool <strong>and</strong> holds the valves used in well operation, Figure 5.2. Themaster valve is a full opening valve that is the main surface control point for access to the tubulars. Itis always fully open when the well is producing or when a workover is in progress. The working pressurerating of the master valve must be sufficient to h<strong>and</strong>le full wellhead pressure. If a valve or fittingin the upper part of the tree must be replaced, the master valve can be closed without killing the well(for all wells with a clear tubing, i.e., no rods). On very high pressure (P, > 5000 psi) or hazardouswells, there may be two master valves; a backup for insurance against leaks in the main valve. Thewing valve (often two valves) are mounted immediately above the master valve in a separate spool.Produced fluids leave the wellhead at the wing valve connection. The purpose of multiple wing valvesis to allow changing of chokes or flow line repair without interrupting well flow. The swabbing or lubricatorvalve is mounted above the wing valve <strong>and</strong> is used to open the well to entry by a tool string. Aschematic of the wellhead <strong>and</strong> tubulars is shown in Figure 5.3.Figure 5.2:S 2 - w - (Kastor,1972)“Christmas Tree” valve assembly for surfacewell control. On high pressure or sour gaswells,The choke is the only device used to limit the production of flowing fluids. Using a valve, such as thewing valve or master valve, to limit fluid flow would allow fluid flow (possibly with solids) to cross thesealing surface of the valve. This could lead to erosion <strong>and</strong> a leaking master valve <strong>and</strong> would requirekilling the well to replace the valve.5-2
Drilled Hole for ConductorPipe (if not driven)Surfaw Pipe Drilkd HobPrcdmon CaringHole Drilled for LinerProduction LinerFigure5.3:A rough schematic of a completedwell with normal hardware.A connection on top of the swabbing valve can be used to mount a lubricator. A lubricator is a pressurerated tube that allows a tool string to be lowered into the well, even while the well is flowing. Oneend of the lubricator is attached to the swabbing valve <strong>and</strong> the other contains a seal assembly thatseals against the wireline that is used to run the tool. Since the lubricator st<strong>and</strong>s straight up to allowthe tool string to drop into the well, the length of the lubricator (<strong>and</strong> the length of the tool string) is controlledby the length of lubricator tube that can be safely supported by the equipment on location. Amore detailed discussion of the lubricator will be given in the chapter covering wireline techniques.Subsea WellheadsA special type of well head is involved in a subsea well. In subsea wells, the wellhead sits on theocean’s bottom at depths from less than a hundred feet to over 2500 ft. Access is much more difficultthan in a surface well, thus subsea completions require a well to be low maintenance, usually a sweetgas or flowing oil well. The wellheads for these wells must be self contained units with controls thatcan be manipulated by remote action at the well head by a ROT (remotely operated tool), by diver orby ROV (remotely operated vehicle). Almost all subsea operations, including drilling, begin after atemplate is installed on the ocean floor. The template serves as a locator for almost all tools used todrill, complete <strong>and</strong> workover the well. A schematic of the template <strong>and</strong> several workover <strong>and</strong> completion“tools” are shown in Figure 5.4. The modular work devices in the figure are characteristic of a surfacewireline assisted operations. The production well head that fits into the template must provide the5-3
same solid connection to the well as all l<strong>and</strong> based well. Because of the remote or diver operation,however, appearances are vastly different than a surface well. Replaceable components of the wellheadsuch as valves <strong>and</strong> chokes are often equipped with guide bars to assist in remote replacement.Figure 5.4:A subsea template <strong>and</strong> assorted workover <strong>and</strong> completion tools.5-4
Coiled Tubing Well HeadsThe use of coiled tubing for recompletion <strong>and</strong> even initial completion of some wells requires the use ofspecial hangers or even complete wellheads that are designed especially for coiled tubing. Coiled tubingis being used in place of conventional tubing in some wells to minimize rig cost or to avoid killingthe well to run tubing. Because of the lack of connections, coiled tubing can be run through strippingrubber seals in the BOP or through a st<strong>and</strong>ard stripper head. Hanging the tubing off in the wellheadrequires slips; <strong>and</strong>, in live well workovers, these can be attached to the tubing <strong>and</strong> snubbed throughthe BOP stack to the slip bowl portion of the wellhead, or the slips can be made a part of the wellhead<strong>and</strong> activated from outside.Coiled tubing completions may incorporate well ore bolt-on components or may be completely spoolableincluding gas lift valves, SSSVs <strong>and</strong> packers.Examples of a hanger element are shown in Figure 5.5 <strong>and</strong> 5.6. These heads require a setting pointbelow the master valve for a workover where the wellhead is nippled down. For low cost recompletionswhere the existing tubing <strong>and</strong> wellhead will not be removed, the coiled tubing is set through theexisting master valve with the coiled tubing hanger <strong>and</strong> a new master valve set above the old mastervalve. Success of the coiled tubing completions <strong>and</strong> recompletions has been good when the tubing issized correctly for the well condition.LIFT TWEADS'SLICK NECK,UPPER SEAL ASSEMBLY. I21 POLY PACK SAL5'BELLEVLLE SPRNGS1-14) SLIP KTTING PINS-SLIPS+ 0-RNG- SLP RETAWG SPRINGSv//A-sLlpc COIL TUBING HANGER BODYIwi-,l41POLY PACK SEALSETDrTBr1-SET SCREWSCOL TUBING INSTALLATIONRECEPTACLErota1 Tool Co.]Figure 5.5:Coiled Tubing HangerHydrate Control in Coiled Tubing CompletionsCoiled tubing offers very good opportunities for recompletion or even initial completion of some wells,however, coiled tubing is particularly susceptible to collapse <strong>and</strong> compaction from production forces ifan ice plug or hydrate plug forms either in the tubing or around the tubing. Problems in some opera-5-5
COILED TUBING HANGER‘ WSnNGPROWCTlONTvBlNGHANOw(Camco, 1996)Figure 5.6:Coiled Tubing Hanger.tions where ice plugs have formed in the annulus during flow have caused sufficient force to collapse<strong>and</strong> compact coiled tubing to the point where 30-40 ft of coiled tubing are compressed into an areaonly 5 or 6 ft long. The only way to prevent ice plugs is either to control the rate of the gas flow so thatthe temperature drop during gas expansion does not create ice plugs or to inject a freeze inhibitorbelow the hydrate point to totally inhibit the formation of the ice.Example: Wellhead configuration - For a gas producing formation at 9600 ft with a reservoir pressuregradient of 0.55 psi/ft, what is the minimum wellhead equipment pressure rating (in psi) needed tocover production or fracture stimulation with an 8.5 Ib/gal frac fluid, when fracturing the zone at 9600-11 000. The friction pressure down the 4-1/2 in., 12.6 Ib/ft, N-80 work string (packer set at 9300 ft)during the frac will be 75 psi/lOOO ft of tubing length. During production flow the friction pressure is10 psi/lOOO ft. Shut in during production will be with a full column of gas (0.1 psi/ft). St<strong>and</strong>ard safetyfactor for well head working pressure is 80% of rated capacity.Solution: Calculate highest possible surface pressure.5-6
1. Max producing pressure (shut in with gas column) = (9600 x (0.55-0.1) = 4320 psiDon’t use the friction pressure on producing since the worst production surface pressure case is staticwith gas in the tubing.2. Max fracture stimulation surface pressure = (0.83 x 9600) - (9600 x (8.5 x 0.052)) + (9.3 x 75)(7968 psi) D (4243 psi) + (698 psi) = 4423 psiMinimum wellhead pressure rating 4423/0.8 = 5529 psiChokesChokes hold a backpressure on a flowing well to make better use of the gas for natural gas lift <strong>and</strong> tocontrol the bottomhole pressure for recovery reasons. In vertical pipe flow, the gas exp<strong>and</strong>s rapidlywith decreasing hydrostatic head <strong>and</strong> the liquid moves in slugs through the tubing. The potential gaslift energy is rapidly lost <strong>and</strong> liquids fall back <strong>and</strong> begin to accumulate over the perforations. Accumulatingliquids hold a back pressure on the formation. If enough liquids accumulate, the well may “die”<strong>and</strong> quit flowing. A choke holds back pressure by restricting the flow opening at the well head. Backpressure restricts the uncontrolled expansion <strong>and</strong> rise of the gas <strong>and</strong> thus helps keep the gas dispersedin the liquids on the way up the tubing. Chokes may be variable or have a set opening,Figure 5.7. The set openings, often called “beans,” are short flow tubes. They are graduated in 64th~of an inch. Common flow sizes are about 8 through more than 20 (in 64th~) for small to moderate rategas wells. Liquid producers <strong>and</strong> high rate gas wells us 20+ choke settings. The size of the chokeneeded depends on reservoir pressure, tubing size, amount of gas, <strong>and</strong> amount <strong>and</strong> density of liquids.Variable chokes may use a increasing width slot design that allows quick resetting. They are useful onwell cleanups following stimulation where choke size can vary over the course of a single day from4/64ths to over 40. They are also used where periodic liquid unloading necessitates frequent chokesize changes.I JI0(from FMC)Figure 5.7:One form of adjustable choke.Solids in the produced fluids are the major source of failures for chokes. Abrasion from s<strong>and</strong>, scale,ice, corrosion particles <strong>and</strong> other solids can cut out the choke restriction <strong>and</strong> cause the well to load up5-7
with fluids <strong>and</strong> die. Choke abrasion from solids <strong>and</strong> cavitation is increased when large pressure dropsare taken. In these situations, choke life is often measured in minutes. For better performance at highpressure drops, take the drop in stages across three or more choke sets in series. The problem is withgas expansion; as gas goes from 5000 psi to atmospheric pressure, the gas exp<strong>and</strong>s 340 fold, with asimilar increase in velocity. The same pressure drop, taken in series from 5000 to 3000, from 3000 to500 <strong>and</strong> 800 to atmospheric results in gas volume (<strong>and</strong> velocity) increases of 136 fold (5000 psi to3000 psi), 150 fold (3000 psi to 800 psi) <strong>and</strong> 54 fold (500 psi to atmospheric). The 340 fold total dropis the same, but the velocity increase across any one choke is significantly reduced.Subsurface Safety ValvesWhen a well head is damaged, through accident or even terrorist incident, the fluids from a producingwell can continue to flow, creating pollution <strong>and</strong> safety problems. One solution to the wild well potentialis the use of safety valves. Safety valves are used to automatically halt the flow of fluid from a wellin the event that the surface equipment of the well is damaged. Safety valves located at the surfaceare surface safety valves (SSVs) <strong>and</strong> those located below the wellhead are subsurface safety valves(SSSVs). SSVs are located above the master valve <strong>and</strong> below the choke <strong>and</strong>/or beyond the choke onthe production line. SSSVs are located in the tubing string below the ground or mud line. Together, thesurface safety valves <strong>and</strong> subsurface safety valves form a redundant system of fail-safe valves. Thevalves are designed to be fail-safe; they are designed in a normally closed position. Opening of thevalves requires application of a pressure to the valve to hold the valve open. When the pressure islost, all safety valves close automatically. Safety valves are typically used offshore, in environmentallysensitive areas <strong>and</strong> in some remote locations on unattended wells.Any requirement for a subsurface safety valve <strong>and</strong> the depth of the valve below the wellhead dependsupon the application <strong>and</strong> local government requirements. In offshore U.S., SSSVs are required <strong>and</strong>the subsurface safety valve is usually set in the tubing string 100 ft or more below the mud line. In theevent of an accident or disaster, in which the wellhead equipment is partially or completely damagedor removed, the valves will shut in the wells <strong>and</strong> prevent pollution <strong>and</strong> fire.The pressure that keeps the safety valves open is supplied by a small pump in a hydraulic-controlledpanel on the surface platform.12 The pump is an automatic hydraulic supply unit, powered usually byclean gas pressure. The pump supplies the control line with a 7 Ib/gal clean hydraulic oil at a set pressure.Other types of actuation systems that have been tried for control of the SSSVs include differentialflowing pressure,’0 electric downhole solenoid,” velocity actuatedIg gas,l3 electromagnetic wavecontrol (directed through the sediment^)'^-'^ <strong>and</strong> through loss of tension in the tubing string.The earliest valves were designed to close if the well flow reached some maximum rate <strong>and</strong> wereused almost exclusively offshore. The idea behind the design was that the valve would close if theplatform was damaged in a storm. The problem with this type of downhole “flow sensitive” control, wasthat the valves were continually in need of resizing as the well’s production capacity declined (reservoirdepleted). The maximum rate trigger-mechanism was also a nuisance when high rate flow of gaswas needed to meet market dem<strong>and</strong> or when liquid slugged through the tubing. SSSV control is nowalmost exclusively from the surface via a small hydraulic control line on the outside of the tubing. If thepressure supply is interrupted, the valves closes automatically.The valve sealing mechanism varies with manufacturer <strong>and</strong> the age <strong>and</strong> type of the valve. MostSSSVs use either a flapper valve or a ball valve with the current favorite being the flapper. The seat<strong>and</strong> flapper unit are protected from the well stream by a spring opposed sleeve that slides through theopen flapper <strong>and</strong> isolates both the seat <strong>and</strong> the flapper. The sleeve is held in place by the hydrauliccontrol pressure. The flapper assembly may be elastomer seal, metal-to-metal or a mixture of the twosystems. Metal-to-metal seal units can be built for pressures in excess of 25000 psi. Ball valve unitsare equipped with spring loaded mechanisms that rotate the throat out of the well stream when thehydraulic opening pressure is removed. Examples of flapper <strong>and</strong> ball valves are shown in Figure 5.8.Other types of seal mechanisms have also been tried.5-8
Figure 5.8: Examples of ball valves(above, 0th) <strong>and</strong> flapper (left,Camco).The two conveyance types of subsurface safety valves are tubing retrievable <strong>and</strong> wireline retrievable.Tubing retrievable valves are run as part of the tubing string (the valve body is made up as part of thestring) whereas wireline retrievable valves can be run <strong>and</strong> retrieved from a profile set in the tubingstring. In the U.S., the tubing retrievable valves ars almost twice as popular as the wireline retrievablevalves, while in non-U.S. areas, the wireline valves are more popular than the tubing retrievables. Thereasons for the popularity differences are found in personal preferences, workover cost differences<strong>and</strong>, to some extent, in regulations regarding well operation. The benefits of the tubing retrievablevalve is that it has a fully opening bore, with very little obstruction to the flowing fluids. One disadvantageis that if there is a problem with the valve, the tubing must be pulled to the depth of the valve forservice. This requires use of a rig; a large cost for many remote platforms. The tubing retrievablevalves also require a relatively large upper casing section because of large valve body. The largeouter body diameter (over 7 in. for a 4-1/2 in. bore valve) is necessitated by the flapper, spring <strong>and</strong>pressure equalization equipment within the valve. The wireline retrievable subsurface safety valve canbe replaced by wireline without pulling the well, but it restricts the opening through which fluids mayflow. The flow restriction for this type of valve may reduce 4-1/2 in. tubing to about a 1-112 in. boreover the 5 to 6 ft length of the valve. For most wells, this is not a severe restriction over a very shortlength. In wells that produce paraffin or scale, however, this flow restriction, especially near the top ofthe tubing may serve as the site for solids deposition <strong>and</strong> promote rapid valve failure. In wells that produces<strong>and</strong>, any restriction may be a site for abrasion. In wells that do not precipitate or produce solids,the valves are often a good choice, especially in areas where well deliverability rate is critical <strong>and</strong> timeconsuming workovers (such as pulling the string to replace a tubing retrievable SSSV) must beavoided. Wireline retrievable valves must be set in a special profile that is made up as part of thestring. The profile seat is connected to the same type of external control line that is used for the tubingretrievable valve. A set of seals on the outside of the wireline valve isolates the hydraulic pressureport in the profile <strong>and</strong> allows a connection to the valve control mechanism. If the valve fails or malfunctions,the wireline unit can be removed <strong>and</strong> replaced by a low cost wireline operation with minimumproductivity interruption.5-9
Safety valve failures are rare but have been documented. When a valve fails to close, it is classifiedas a failure. When a valve fails to open, it is classified as a malfunction. The difference between thetwo labels comes from the design intent of the valve. Since the valve is designed to close when surfacecontrol pressure is lost, a failure is failure to close. Either event is troublesome.One study on the reliability of SSSVs, showed the valves to have a failure rate that was on the order of0.8 to 2.3% in normal operations.16 One of the biggest reasons for SSSV failure (of valves tested) isplugging of the sealing mechanism with paraffin, scale, produced s<strong>and</strong>, ice <strong>and</strong> other ~ olids.~,~~~~It isvery important to operate the valves periodically so debris can be removed from the assembly <strong>and</strong>that valve’s internal mechanism can be lubricated. This operation is known as “exercising” the valve<strong>and</strong> is recommended to be done once per month. To exercise the valve, the wing vent is usuallyclosed to shut the well in <strong>and</strong> the safety valve is open <strong>and</strong> closed several times. Merely releasing <strong>and</strong>restoring the hydraulic pressure at the surface will not confirm that the valve has actually closed. Afterthe hydraulic control pressure is released, a few hundred psi can be bled off the tubing at the surface.If the pressure does not come back to initial shut-in pressure, then the valve is sealing. The amount ofpressure that needs to be bled off at the surface depends of what seat material is in the valve. Elastomerseals are tested at about 500 psi while metal-to-metal seals are usually tested at least 500 toover 1000 psi. The recommended test pressure is available from the valve manufacturer. A regularmaintenance schedule may be a legal requirement of ~peration.‘~-’~Reliability of the valves is very good if precautions are taken on regularly “exercising” the controlmechanism. All of the 36 wells on the ill-fated Piper Alpha platform in the North Sea were equippedwith SSSVs as per regulations. After the platform was destroyed, the fire was caused by the uncontrolledvolume of produced gas in the pipeline (nearest shutoff was reportedly 1-1/2 miles away). Thefire-fighting crew reported only minor leaks from tubing of the shutin wells. In Kuwait, ten wells of the700+ that had well heads damaged or destroyed were reportedly equipped with SSSVs. The valvesprevented fires on those wells.Opening the valve, either on initial well startup or after shut-in to check valve operation should follow aset of simple rules. To prevent valve damage, the pressure on both sides of the valve must be equalized.If the valve is a flapper design, the pressure is best equalized by pumping down the tubing toopen the valve. If the unit is a ball valve, it may have to be opened by activation of the hydraulic pressurecontrol unit. Flapper valves can also be opened by hydraulic actuator pressure. With either system,if the valve must be opened by the hydraulic mechanism, the differential pressure across thevalve must be equalized before valve opening to prevent valve damage. Pressure equalization isaccomplished with internal baffles that allow controlled flow of gas or liquid through the a part of thevalve body. After pressure above <strong>and</strong> below the valve is equalized, the valve can easily be opened. Ifthe valve is opened with a differential pressure across the valve, the fluid flow across the seal maycause erosion of the valve face.An additional element of consideration for SSSVs is the construction material. Since they are directlyin the flow stream, the SSSVs must be designed to withst<strong>and</strong> operational corrosion or erosion forces.Construction materials of corrosion resistant metals such as lncalloy or Hastelloy are common.Selection of the type of SSSV depends on well condition^.^ Included in the considerations are legalrequirements, depth of placement, pollution st<strong>and</strong>ards, dual strings,20r21 subsea wellhead,22? casingsize near surface, presence of kill strings, annular flow, cost of workovers, frequency of workovers,type of workovers, deliverability obligations <strong>and</strong> the cost of the valve. When these <strong>and</strong> other variablessuch as pressure, setting depth, <strong>and</strong> temperature are considered, a decision can generally be madeby examining the requirements <strong>and</strong> behavior of the available equipment.8Setting depth of a valve depends on the ability of that valve to close in the event of an accident. TheSSSV is rated with a closing pressure, F, If the control line pressure drops below F, the valve closes,shutting in the well. The F, value effectively limits how deep the valve can be set since either controlline hydrostatic fluid pressure or annular fluid hydrostatic (in the event of a control line break) could5-10
keep the valve open if the fluid hydrostatic exceeded the SSSV closing pressure. A simple formulatranslates the closing pressure rating into maximum set depth.Max Set Depth =MHFGSet Depth = maximum set depth of SSSVF, = closing pressure rating of SSSVF, = a safety factor, F, = 0.15 F, usual minimum is 75 psi.MHFG = maximum hydraulic fluid gradient.In th case of the valve with F, = 350 psi, an empty (unpressured annulus)the set depth is:nd a 7 Ib/gal hydraulic oil,Max Set Depth =350 psi - 75 psi = 755 ft0.364 psi/ftThe 0.364 psi/ft is the gradient of 7 Ib/gal fluid <strong>and</strong> 75 psi was used because F, = 0.15 x 350 = 53 psi.If the annulus is liquid filled (or gas under pressure), the MHFG that would be used is the maximumgradient produced at the SSSV. For example, a 15 Ib/gal packer fluid in the annulus would change themaximum setting depth for the same spring to:Max Set Depth =350 psi - 75 psi = 352 ft0.78 psi/ftExample: An offshore platform uses a SCSSV, set at 450 ft below the mud line (ocean floor). Thewater depth is 300 ft <strong>and</strong> the platform is 75 ft above the sea surface. The hydraulic fluid used for valveoperation has a density of 8.4 Ib/gal. Sea water density is 8.5 Ib/gal. The annulus of the well is filledwith inhibited sea water (8.5 Ib/gal). What is the minimum flapper closure pressure (Fc) needed (inpsi) for operation under all environments including loss of the control line at the downhole valve.FS = 75 psiSolution: Set Depth = [Fc D Fs] I MHFG,Fc = [Set Depth x MHFG] + FsThere are two possible hydraulic fluid <strong>and</strong> set depth combinations:1. at operating conditions, set depth = 450 + 300 + 75 = 825 ft, The hydraulic density = (8.4 x0.052) = 0.437 psilft for this condition.2. at "disaster" conditions (loss of control line at valve) set depth = 450 + 300 = 750 ft, (note thatthe air gas is not use D <strong>and</strong> fluid now is sea water). The hydraulic fluid density = 8.5 x 0.052 =0.442 for this condition.Condition 1, Fc = (825 x 0.437) + 75 = 436 psiCondition 2, Fc = (750 x 0.442) + 75 = 407 psi..The minimum flapper closure Dressure needed is 436 DS~5-1 1
The other safety valve path that must be considered is the annular area. Annular safety control is necessaryin areas that require SSSV isolation where the annular area is or could become a flow path.The annular pressure control systems that are currently on the market are packer type devices thatuse an applied hydraulic force to hold the annular flow channels open. All of these devices serve as ahanger so that the tubing suspension is maintained regardless of wellhead damage. Hanging significanttubing weight from these devices causes significant problems because of potential casing deformation.Two approaches have helped cure this problem. The packer slip assembly has been enlargedin one model to spread out the load. In the other approach, a casing profile is run in the casing string<strong>and</strong> the tubing hanger is set in the profile.A special case in subsurface safety valves is the coiled tubing completion, Figure 5.9. This completion,all completely spoolable onto a coiled tubing reel .can be more easily pulled in the event of aworkover.CONTROL LINE HANGERICT HANGER WITH SUPSAND PACK-OFF SETCONTROL LINECOILED TUElNQSAFETY VALVEQAS LIFT VALVESLOCATOR SEAL ASSYPERFLAPPER(Carnco, 1996)Figure5.9A coiled tubing completionwith a subsurfacesafety valve.<strong>References</strong>1. Buzarde, L. E., Jr. Kastor, R. L., Bell, W. T., DePriester, C. L.: “Production Operations Course I -Well Completions,” SPE, 1972.2. Bazile, D. J., II, Kluck, L. M.: “New Wellhead Equipment for Old <strong>Oil</strong>fields,” SPE 161 22,SPEAADC Conference, New Orleans, March 15-1 8, 1987.5-12
3. Coxe, B., Pyle, C. L.: “Wellhead Innovations for Hot, High-pressure Wells,” J. Pet. Tech. (February1983), pp. 284-290.4. Fowler, E. D., Rhodes, A. F.: “Checklist Can Help Specify Proper Wellhead Material,” <strong>Oil</strong> <strong>and</strong><strong>Gas</strong> J. (January 24, 1977), pp. 62-65.5. Bleakley, W. B.: “The How <strong>and</strong> Why of Downhole Safety Valves,” <strong>Petroleum</strong> Engineer (January1986), pp. 48-50.6. Peden, J. M.: “Rationality in Completion Design <strong>and</strong> Equipment Selection in the North Sea,”Paper SPE 15887 presented at SPE European <strong>Petroleum</strong> Conference, London, October 20-22,1986, pp. 347-361.7. Krause, W. F. <strong>and</strong> P. S. Sizer: “Selection Criteria for Subsurface Safety Equipment for OffshoreCompletions,’’ Journal of <strong>Petroleum</strong> Technology (July 1970), pp. 793-799.8. Nystrom, K. 0. <strong>and</strong> D. W. Morris: “Selecting A Surface-Controlled Subsurface Safety Valve forDeep, Hot, High-pressure, Sour <strong>Gas</strong> Offshore Completions,” Paper SPE 11 997 presented at58th Annual Technical Conference <strong>and</strong> Exhibition, San Francisco, October 5-8, 1983, pp. 1-4.9. Beggs, H. D.; J. P. Brill; E. A. Proano, Roman-Lazo, C. E.: “Selection <strong>and</strong> Sizing of Velocity-ActuatedSubsurface Safety Valves,” Trans. ASME, June 1980, Vol. 102, pp. 82-91.10. Gano, J. C.: “Differential Sensing Direct-Control <strong>Gas</strong> Storage Well Safety Valve,’’ Paper SPE19086 presented at the SPE <strong>Gas</strong> Technology Symposium, Dallas, June 7-9, 1989, pp. 287-294.11. Gresham, J. S. <strong>and</strong> T. A. Turcich: “Development of a Deepset Electric Solenoid SubsurfaceSafety Valve System,” Paper SPE 14004 presented at the Offshore Europe 85 Conference,Aberdeen, September 10-1 3, pp. 1-9.12. Schaefer, H.: “Subsurface Safety Valves,” Paper OTC 1295 presented at Second Annual OffshoreTechnology Conference, Houston, April 22-24, 1970, pp. 681 -688.13. Morsi, K. M.: “Surface <strong>and</strong> Downhole Production Safety Systems for Sour <strong>Oil</strong> <strong>and</strong> <strong>Gas</strong> Wells,”Paper SPE 13743 presented at Middle East <strong>Oil</strong> Technical Conference <strong>and</strong> Exhibition, Bahrain,March 11 -1 4, 1985, pp. 1-6.14. Drakeley, B. K.: “Electromagnetic waves used for valve control,” Offshore (September 1987),pp. 53-54.15. Kleckner, J. J.; R. C. Dickerson; P. M. Snider; J. A. Zublin; R. L. Sphan; P. F. Menne; J. H. VanDer Lichte; B. H. Ter Horst; N. H. Akkerman; L. H. Rorden; H. S. More; J. E. Kattner; A. Samuels;R. A. Wendt; T. Hoh; E. Beauregard; P. L. Ferguson; P. J. H. Carnell <strong>and</strong> H. H. Clark: “ProductionOperations Forum,” Paper SPE 15468 presented at the 61 st Annual Technical Conference <strong>and</strong>Exhibition of the Society of <strong>Petroleum</strong> Engineers, New Orleans, October 5-8, 1986, pp. 1-6.16. Medley, E. L.: “Experience With Surface Controlled Sub-Surface Safety Valves,” Paper EUR 32presented at European Offshore <strong>Petroleum</strong> Conference <strong>and</strong> Exhibition, London, October 24-27,1978, pp. 257-262.17. Molnes, E.; M. Raus<strong>and</strong> <strong>and</strong> B. Lindqvist: “SCSSV Reliability Tested In North Sea,” <strong>Petroleum</strong>Engineer (November 1987), pp. 38-40.18. Engen, G. <strong>and</strong> M. Raus<strong>and</strong>: “Reliability Studies Test SCSSVs In The North Sea,” <strong>Petroleum</strong>Engineer (February 1984), pp. 30-36.5-13
19. Busch, J. M.; B. J. Policky <strong>and</strong> D. C. G. Llewelyn: “Subsurface Safety Valves: Safety Asset orSafety Liability?” Journal of <strong>Petroleum</strong> Technology (October 1985), pp. 181 3-1 81 8.20. Geyelin, J. L.: “Down Hole Safety Valve for Concentric Completion,” Paper SPE 16536 presentedat Offshore Europe 87, Aberdeen, September 8-1 1, pp. 1-9.21. Calhoun, M. B.; M. Deaton <strong>and</strong> J. W. Tamplen: “Subsurface Safety Systems for TLP Completions,”Paper SPE 12996 presented at the European <strong>Petroleum</strong> Conference, London, October25-28, 1984, pp. 31 3-31 5.22. ;Yonker, J. H.: “Newest Through-Flowline Retrievable Safety Valves for Subsea Completions,” J.Pet. Tech., (Nov. 1984), p. 1922-1 928.23. Going, W. S. <strong>and</strong> R. E. Pringle: “Safety Valve Technology for the 1990’s,” Paper SPE 18393 presentedat SPE European <strong>Petroleum</strong> Conference, London, October 16-1 9, 1988, pp. 545-552.24. Morris, A. J.: “Elastomers Are Being Eliminated in Subsurface Completion Equipment,” PaperSPE 13244 presented at the 59th Annual Technical Conference <strong>and</strong> Exhibition, Houston, September16-1 9, 1984, pp. 1-4.25. Mason, P. G. T.: “Downhole High-pressure Equalizing Safety Valves: A Solution-Variable LabyrinthSeals,” Paper OTC 5576 presented at the 19th Annual OTC, Houston, April 27-30, 1987,pp. 21 7-227.26. Raulins, G. M.: “Safety by Down-Hole Well Control,” J. Pet. Tech. (March 1972), p. 263-271.27. Rubli, J.: “New Developments In Subsurface Safety Valve Technology.”28. Sides, W. M., Going, W.: “Controlling Self Equalizing Velocity Extends Valve Life,” <strong>Petroleum</strong>Engineer Int., February 1992.29. Hopper, Christopher T.; “Simultaneous Wireline Operations from a Floating Rig with a SubseaLubricator”, SPE Production <strong>Engineering</strong> (August 1990), pp. 270-274.30. O’Brien, E. J. Ill, Hetl<strong>and</strong>, Torger; “The Underwater Production System”, SPE (February 1991),pp. 33-39.31. <strong>King</strong>, Gregory W.; “Drilling <strong>Engineering</strong> for Subsea Development Wells”, SPE (September 1990),pp. 11 76-1 183.32. Cyvas, M. K.; “Subsea Adjustable Choke Valves: A Focus on a Critical Component”, SPE(August 1989), pp. 301-308.33. Simpson, D. M., Pearce, J. L.; “Downhole Maintenance of Subsea Completions”, SPE (May1989), pp. 161-16634. Dines, Chris, Cowan, P., Headworth; “An Operational Subsea Wireline System,” Journal of<strong>Petroleum</strong> Technology (February 1989), pp. 171 -1 76.35. Dawson, A. P., Murray, M. V.; “Magnus Subsea Wells: Design, Installation, <strong>and</strong> Early OperationalExperience”, SPE (November“ 1987), pp. 305-31 2.36. Reynolds, P. W., Marquette, L. J.; “Completing Subsea Wells at Ekofisk”, <strong>Petroleum</strong> EngineersInternational, (1978), pp. 57-60.5-14
37. “Shell tries Recessed Subsea Completion”, Drilling Contractor (April 1982), pp. 132-1 36.38. Kelly, A. O., Bourgoyne, Dr., Jr., A. T., Holden, Dr. W. R.; “A Computer Assisted Well ControlSafety System for Deep Ocean Well Control”, Paper presented at international Well ControlSymposiumNVorkshop in Baton Rouge, Louisiana, (November 27-29, 1989), pp. 1-1 8.39. Davis, R. J. R., Pond, R. J.; “Development of the Subsea Completion System for the Highl<strong>and</strong>erField, Journal of <strong>Petroleum</strong> Technology, (April 1986), pp. 453-460.40. Morrill, David L.; “The Simple Subsea Well Concept”, SPE (September 1979), pp. 1083-1 091.5-15
Chapter 6: Corrosion <strong>and</strong> ErosionCorrosionCorrosion is defined as destruction of a metal by chemical or electrochemical reaction with its environment.’It is reported that 80% of failures in production <strong>and</strong> pipeline operations are caused by corrosion.2Corrosion may be apparent by metal loss, strength loss by cracking <strong>and</strong> solids problemscaused by formation of corrosion by-products. One of the first decisions in well completion design isthe selection of the proper casing <strong>and</strong> tubing. Corrosion will not alter calculation of the tensile, burst<strong>and</strong> collapse, but it may dictate the selection of the grade of material necessary to satisfy theserequirements. Corrosion is common in almost all hydrocarbon-producing environments <strong>and</strong> costs hundredsof millions of dollars throughout the industry every year.3 In addition, the economic problems areintensified through loss of revenues due to down time <strong>and</strong> deferred prod~ction.~For corrosion to occur, there must be a circuit produced through which electrical current can flow. Thecircuit is called the corrosion cell <strong>and</strong> the electrical current produced by the process, although verysmall, can do enormous damage to metal systems.The basic cause of corrosion is instability of metal in its refined form. Because of the free energy relationship,the metals tend to revert to their natural state through the process of corrosion. Pure metalsrarely exist in the natural world. To obtain a pure metal, a salt of the metal (the ore) is refined (energyadded). This energy input is stored in the metal <strong>and</strong> serves as a source of potential (voltage) for thecorrosion circuit. Since different metals require varying amounts of energy to refine, there are variationsin the amount of voltage available for the circuit. The following table from Patton5 is included toshow the tendencies of metal to corrode. The half-cell potentials, which were reported by Peabody,6were measured with a hydrogen reference electrode in a solution of the metal salt.The ranking of metals from most easily corroded to least corroded is a galvanic series. For metalscommon in the oil industry, the ranking is as follows.2magnesium (<strong>and</strong> magnesium alloys)zinc (<strong>and</strong> galvanized coatings)aluminum (soft alloys)cadmium (<strong>and</strong> cadmium coatings)aluminum (hard alloys)steel, cast ironstainless steel (300 AISI, active)leadtin6- 1
naval brass, magnesium bronze, yellow brassadmiralty brass, aluminum bronze, red brasscooper, silicone bronzelnconelMonelstainless steel (300 AISI, passage)Hastelloy B <strong>and</strong> C-276 (<strong>and</strong> other high nickel alloys, super alloys)Galvanic corrosion occurs when the dissimilar metals are coupled in an electrolyte. The attack is fromcurrent flow within the simple “battery” formed by the metals <strong>and</strong> the water. Metals that are widely separatedin the previous galvanic series will show the highest level of corrosion. Coatings on the metalsurface, such as iron carbonates, block the galvanic current <strong>and</strong> lessen corro~ion.~In any steel, the important sources of galvanic cell potential difference are:81. The various states of heat treatment of the steel, such as:a. weld metal deposits,b. the junction of weld <strong>and</strong> base metal,c. tubing end heat treatment prior to upset (joint) manufacture2. Cold Work <strong>and</strong> residual stress that result in anodes.The Corrosion CircuitThe corrosion circuit requires an anode (the site of corrosion on the metal), a cathode, a metal connectionbetween the anode <strong>and</strong> the cathode, <strong>and</strong> an electrolyte (liquid) surrounding the anode <strong>and</strong> thecathode.Chemical ReactionIn acid solutions (pH e 7), reduction of hydrogen ions to hydrogen gas can be the dominant reaction inthe absence of H2S gas. In neutral or basic soluiions (pH 17), reduction of oxygen is the dominatereaction. When gases such as CO2 <strong>and</strong> H2S are present, the reactions are modified by the gases.Presence of CO2 in neutral solutions can cause direct reaction of bicarbonate or carbonate ion withthe steel. This can deposit a beneficial protective films such as iron carbonate. H2S on the metal surfacestops the formation of hydrogen gas from hydrogen ions <strong>and</strong> permits a large percentage of thecathodic hydrogen ions to enter the steeL7 This is the start of one of the hydrogen embrittlements;cracking in hard steels or blistering in soft steels.As the metal corrodes, it dissolves at the anode <strong>and</strong> enters the solution as ions. It is an oxidation reactionsince the iron leaves in an state. The electrons flow toward the cathode, where hydrogen gasis evolved. The schematic of the corrosion cell is shown in Figure 6.1 .5 The anode reactions are:2Fe42Fe +,+4e2Fe +%2Fe+3+2eThe cathodic reaction involves electrons received from the anodic reaction:312 0, + 3 H, 0 + 6 e + 60 H-6-2
1Fe0 2 3 HO ' 2 ~2H+t1/2 0220H'- ANODEFigure 6.1:ELECTRONFLOWk " 2 / ELECTROLYTE2e' 2e' METAL SURFACECATHODE(Jones. 19881A representation of the corrosion cell.The overall corrosion reaction is:2Fe+3U20+3/2 02+2f-e(OH),This reaction is for corrosion produced in neutral, agitated salt water.5 The actual location of theanode <strong>and</strong> cathode may vary with the inhomogeneities in the metal <strong>and</strong> attack may be localized ormay occur over a very wide area. The rate of reaction is dependent upon many factors, including thesalinity of the water, flow velocity, temperature, pH, metal alloy characteristics, <strong>and</strong> dissolved gasessuch as oxygen, carbon dioxide <strong>and</strong> hydrogen sulfide.The overall corrosion process results in weight loss at the anode caused by the loss of iron <strong>and</strong> hydrogenembrittlement of high strength <strong>and</strong> highly stressed steels by penetration of the atomic hydrogen.The corrosion reaction is most severe where pits are formed. The intensity of the pitting is affected bythe manufacturing, h<strong>and</strong>ling <strong>and</strong> production factors. In these areas, abnormalities such as largegrains, poor heat treating, improper stress relief, mill marks, pipe wrench nicks, damage during running,<strong>and</strong> other factors contribute heavily to the location of electrochemical attack that causes pits.Endean summarized the common sources of metal corrosion as:*1. Hydrogen sulfide - causes both pitting <strong>and</strong> general attack. The reaction product is a black, usuallyshiny mass <strong>and</strong> may be in the form of a hard scale or a finely divided solid dispersed in thewater.2. Carbon dioxide - attack is through pitting with brown or black reaction product. Pits produced inCO2 attack are frequently in a line <strong>and</strong> resemble a large cavity. The remainder of the pipe may beunaffected.3. High concentration chloride brines with a pH of 6-7 produce shallow wide spread pitting attacksimilar to acids but much less severe.4. HCI - mineral acid attack produces severe general pitting with frequent occurrence of deep channels<strong>and</strong> deep pits.6-3
5. Sulfate reducing bacteria - SRBs produce a localized corrosion by trapping their own low pHwaste product <strong>and</strong> protecting the corrosion from inhibitor contact. The location of the corrosion isusually under the bacteria colony.6. Erosion damage - high velocity contact by fluids, gases containing mists <strong>and</strong> droplets, or fluidscontaining solids generates a smooth surface with frequent shallow channels, plateaus, <strong>and</strong>sharply defined transition areas, especially around the area of highest fluid velocity <strong>and</strong> directlyacross from perforation^.^The amount of corrosion is often expressed as a mils (or thous<strong>and</strong>ths of an inch) per year, MPY. Thismeans of expressing corrosion is only usable when the corrosion rate is an even attack on the surfaceof the steel. Where pits occur, an MPY value is useless: generation of even a few deep pits can ruin apiece of equipment without loosing but the smallest fraction of a percent of the total metal mass. Rateof pit growth varies with the depth <strong>and</strong> size of the pit <strong>and</strong> the rate of penetration of the pit will actuallyincrease with depth of the pit.2 As the pit is growing, the very bottom of the pit is the anode. This areabecomes smaller with pit depth as the pit forms a V shape. The smaller bottom area looses metal at afaster rate to satisfy the current flow of the corrosion circuit. This is the reason for pin hole leaks in anotherwise solid piece of equipment.Acid <strong>Gas</strong>esThe special case of production of hydrogen sulfide gas, H2S, carbon dioxide gas, CO2, or a mixture ofthe two is the area of acid gas technology.’O The corrosion produces one or more types of HydrogenEmbrittlement, HE, in the steel. Hydrogen embrittlement reduces the toughness of steel (a loss of ductility)<strong>and</strong> is most prevalent around existing defects (micro or macroscopic) in the steel. The steelsmost susceptible to hydrogen embrittlement problems are those with a yield strength of 80,000 psi, orgreater (N-80 <strong>and</strong> higher alloys). In lower strength steels, hydrogen blistering is occasionally found.The corrosion caused by acid gasses is influenced by the pH <strong>and</strong> by pressure, temperature, the corrosionresistance of the metal <strong>and</strong> the passive corrosion films formed on the surface of the metal.Several forms of hydrogen embrittlements, HE, have been described including stress corrosion cracking<strong>and</strong> stress sulfide cracking.’&’’All forms of hydrogen embrittlement are brittle failures of a metal at a stress level below its yieldstrength as a result of their exposure to atomic hydrogen.’’ The atomic hydrogen is generated onmetal surfaces by corrosion rea~tion.’~ The hydrogen is diffused into the metal <strong>and</strong> causes a reductionin the ductility of the metal. Sour gas increases the corrosion of HE by:‘’ (1) low pH of fluids thatcontain H2S, (2) sulfide causes a greater percentage of the hydrogen created at the surface to enterthe metal, <strong>and</strong> (3) the anodic portion of the corrosion reaction tends to be localized, which helpscracks initiate. The result of these actions is extremely rapid failure of some metals in sour fluids.HE is generally associated with high strength steel <strong>and</strong> is common with H2S wells. The factors controllingHE are:*1. Steel yield strength - steel with yield strengths of 90,000 psi or lower (C-90, N-80, L-80, C-75,etc.) are usually less susceptible to hydrogen embrittlement.2. Hardness - Maximum hardness should be a Rockwell “C” scale of 22 or lower (the hard steelsare much more prone to attack from HE).3. Stress level - At low stresses HE failures are lessened. In HE susceptible steels there is athreshold below which HE will not occur. This threshold value is lowered for higher strengthsteels.6-4
4. Internal stress - The internal stress, which includes stored tensile stress produced by welding,bending or surface damage is a common initiator for corrosion.5. Hydrogen concentration - The time to failure of any high strength steel is a function of the concentrationof hydrogen.6. Temperature - HE failures usually do not occur above 150°F. (A special exception to this is thecase of stress corrosion cracking7)Two special cases of HE are sulfide corrosion cracking <strong>and</strong> stress sulfide cracking. Sulfide corrosioncracking, SCC, causes a brittle failure of metals by the action of localized corrosion <strong>and</strong> stress.lg SCCis normally encountered near the bottom of wells <strong>and</strong> in hotter environments than other forms of HE.7In sour gas systems, SCC causes failure of high strength steels, all types of stainless, <strong>and</strong> many lowalloy nickel-based alloys.lg SCC will also occur in production of hot brines (chloride rich). SCC is commonin stainless alloys <strong>and</strong> materials. Alloys containing about 8% nickel are the most ~usceptible.~Alloys with over about 42% nickel are usually immune to SCC.7 These alloys include Inconel, Incoloy,Monel <strong>and</strong> Hasteloy. Other immune alloys may include cobalt-cromium-nickel-molybedenum alloys,nickel-free low alloys, <strong>and</strong> nickel-free martensitic stainless steels.There is a relationship between the environment <strong>and</strong> the metal to cause SCC; only certain metals willcrack in given environments at the critical stress level. SCC is considered to be an anodic process inwhich a crack is initiated (usually by HE) <strong>and</strong> reaction progresses inside the crack. The dissolution ofmetal at the tip of the crack controls the process. The environment inside the crack may be very differentfrom that on the surface of the casing due to the large area of metal <strong>and</strong> the protected environment.The pH of the produced fluids, for example, may be between 4 <strong>and</strong> 6, while inside the crack, pHmay be between 1 <strong>and</strong> 2 (highly acid) because of higher concentration of chloride ions, whichincrease the local corrosion rate.lg The overall corrosion rate of a material that is undergoing SCCmay be low <strong>and</strong> outer appearance may be good. However, the detrimental SCC corrosion in the crackoccurs as the result of the localized, often unseen, attack.Stress sulfide cracking, SSC, occurs in high strength (high hardness) steels exposed to sour gas production.It is also known as hydrogen stress cracking <strong>and</strong> hydrogen embrittlement cracking.20 SSC iscracking that results from hydrogen charging (large volume entrance of hydrogen) of high strength<strong>and</strong>/or high hardness steels. Most SSC occurs at lower temperatures <strong>and</strong> is prevalent in the upperparts of the well. It may accelerate during periods of shutin or cool down, requiring only a reduction intemperature to become active. SSC is a form of hydrogen embrittlement <strong>and</strong> is a bulk alteration of themetal surrounding the surface areas.Most corrosion rates increase with an increase in temperature up to about 140 to 150°F. At this point,several forms of corrosion are lessened <strong>and</strong> some corrosion inhibiting films begin to form. Although anincrease in temperature renders the steel more susceptible to attack by SCC, an increase in temperaturedecreases the rate of stress sulfide cracking, SSC. At higher temperatures, the atomic hydrogenthat contributes to the initiation of the crack by embrittlement is able to diffuse out of the steel. Temperaturethresholds exist for SSC <strong>and</strong> above these limits, SSC does not occur. The limits for hydrogensulfide content <strong>and</strong> temperature are indicated in Figures 6.2 <strong>and</strong> 6-3. Figure 6.3 shows that the temperaturethreshold for SSC free behavior is dependent upon the grade of steel. SSC can be controlledwith use of lower strength alloys.Controlling CorrosionApproaching corrosion control from a well completion position may involve selection of corrosionresistantalloy,i1~i2*19*2’-24 films <strong>and</strong> coatings,2532 liquidor cathodic protectiondevice^.'^^^-^^ The least expensive route will depend on the produced or injected fluids, completiondesign <strong>and</strong> the level of protection required in the operation.6-5
ssc\ 40.001 10 do 80 100 120 140 160 180YIELD STRENGTH (kri)Figure 6.2:(Kane & Greer, 1977)The maximum H2S concentration limit forSSC-free behavior at 100% of yield strengthappliedstress, shown as a function of theyield strength of the steel.mU'i 20UmLIcI 100Q6TsscFigure 6.3:(Kane & Greer, 1977)Mimimum temperature for SSC-free behaviorat 100% of yield strength-applied stress,shown as a function of the yield strength ofthe steel.Modifying the produced fluid by changing pH or removing water or dissolved gasses such as oxygen,CO2, or H2S are usually only available for use in pipelines <strong>and</strong> injection systems. <strong>Gas</strong> removal systemssuch as gas stripping, degeneration <strong>and</strong> chemical treating may all be used to remove or reducethe content of gases. Changing the character of the produced fluids is usually achieved by changingoperating conditions to control the separation of the condensing phase.6-6
T c ri'f2
T000v0dF(rrr;t100CI
Coatings are a relatively simple <strong>and</strong> inexpensive way to isolate the metal (the anode <strong>and</strong> cathode)from the electrolyte liquid. Permanent coatings include plastic, tars, cement <strong>and</strong> paint. Coatings areusually chosen for a protection against a particular liquid. The plastic coatings, for example, includeresins <strong>and</strong> polymers that are resistant to low pH waters, oxygen, COs, or salts. Coatings are not resistantto all influences however: acids, alcohols, <strong>and</strong> other materials will destroy some coatings. Caremust be taken in working over wells with coated tubing to avoid damage to the surface of the coating.Abrasive action such as wireline action or coiled tubing are very detrimental. Damage to coated surfacesoffer sites for very localized, intense corrosion.Liquid corrosion inhibitors act as temporary coatings or films on the surface <strong>and</strong> are effective in providinga passive film or a coating if they are replenished on a regular basis. Selection <strong>and</strong> applicationof inhibitors are critical elements in the corrosion control program of a well. There are literally hundredsof chemical inhibitors for control of dozens of different corrosion problems on various types ofsteels. The inhibitor for a particular application must be selected from lab or field tests at the conditionswhere the corrosion will be active. Normally, these selection tests are started in the lab <strong>and</strong> completedin the field with field trials on test metal coupons.Complete reviews <strong>and</strong> comparisons of the methods of applying corrosion inhibitors are rare, but a fewcase histories do exist. Houghton <strong>and</strong> We~termark~~ have provided data on some corrosion problemsin the North Sea <strong>and</strong> compared the methods for application of corrosion inhibitors. In the wells thatwere used for a database, average workover life was approximately 60-120 days. CO2 corrosion <strong>and</strong>erosion were present in these wells’. Erosion was determined to have a significant influence on therate of corrosion <strong>and</strong> CO2 corrosion/erosion was found to be the normal mechanism of attack on thesewells.During the study, the rate of corrosion for these wells was determined to be exponential rather thanlinear. Once the corrosion started, very rapid increases in the corrosion rate were common. The mostprevalent place for attack of the corrosion/erosion was at changes in diameter or direction of the fluidflow. The paper pointed out that sweet corrosion was prevalent in these wells even though there wasless than 14% formation water in the total produced fluids.Ekofisk wells in the study that had a high GOR showed increased corrosion; probably by providinggreater volumes of CO2 <strong>and</strong> by increasing the flaw velocities of the produced fluids. The GOR hasalso been shown to be a factor in corrosion in other studies. Even in gas wells, a change in flowingfluid composition because of condensation of C-3+ hydrocarbons can result in a change in corrosionintensity or location.40 The most common corrosion site depth was in the mid-range from 4000-7000 ft. The mid-range location on these wells corresponds with gas breakout <strong>and</strong> increased turbulencefrom suspended gas that is rapidly exp<strong>and</strong>ing due to the lowering of hydrostatic head.In all cases of wells deviated more than 20°, a preferential attack along the low side of the tubing wasspotted. This attack reportedly resulted in troughs 1 in. wide that tracked along the inside of the lowside of the tubing.This “pipe trough” development has also been though to be the result of a low oil wetting tendency ofthe Ekofisk crude, which would result in a water wetted pipe. If the fluid velocity in these flowing wellsis below 2.5 to 3 ft/sec, the approximate minimum velocity for water entrainment in the oil, a free waterlayer would exist at the lowest point due to gravity separation <strong>and</strong> increased corrosion could occur.8The corrosion/erosion attack location was identified using casing calipers. Corrosion in caliper trackshas also been observed. The cause may be that early caliper surveys were not followed with inhibitortreatment to repair damaged protective films.In the higher volume wells, preferential attack occurred on the pin-end shoulder on the coupling. Theshoulder seems to cause additional turbulence <strong>and</strong> pitting is a byproduct of the turbulence.6-9
The paper reported a comparison of inhibitor treatment types, in terms of both economically application<strong>and</strong> performance. Formation squeezes with inhibitor, continuous injection, <strong>and</strong> tubing displacementswere all examined. Continuous injection was found to be the least expensive in almost all flowrates studied.A second case study, <strong>and</strong> one that covers economics of chemical inhibitor usage was provided byAkram <strong>and</strong> Butler.41 This work showed that the cost of the successful inhibitor protection program wasabout $29,000 per well per year, compared with a super alloy tubular cost (for passive control) ofabout 1.25 million. The cost of carbon steel tubulars for the same well was $271,000 (all dollar valuesare 1982 U.S. dollars). The economic impact of the successful inhibitor program was significant;34 years of inhibitor operation to equal the simple difference of super alloy <strong>and</strong> carbon steel tubularcost. Obviously, the successful control of corrosion using either method depended upon good design<strong>and</strong> strict application. All inhibitor films have to be replaced on a regular basis. While this addition isrelatively easy in injection wells by surface addition to injected fluids, it is more difficult in producingwells. The inhibitor must be circulated into position <strong>and</strong> allowed to film on a clean surface withoutbeing disturbed by action of other surfactants, inhibitors or solvents. Most inhibitors must be placed asa dispersed phase in a non reactive fluid without the aid of surfactants. The application of these materialsmay range from simple “dump” jobs down the back side (low pressure injection into the annulusat the surface in a well without a packer) to periodic workovers requiring the well to be shutin whileinhibitor is injected down the tubing. Some wells are completed with a small string of tubing (1/4 in. to1 in. diameter) down the outside or inside of the tubulars where the inhibitor <strong>and</strong> other treating chemicalscan be injected continuously.Some naturally passive films (a reaction product of the metal <strong>and</strong> the wetting fluid) provide a barriersurface that reduces the potential produced in the corrosion circuit by altering the reactivity of surface.The film may be a metal oxide laye?5v27 or other reaction by-product that is not easily attacked by producedfluid. These films are recognized as major corrosion controlling mechanisms. Corrosion of lowalloy steels at temperatures below 140°F, increase with the partial pressure of CO2 in the gas phase.Above 140°F the corrosion decreases with temperature because of the formation of iron carbonate<strong>and</strong> iron oxide films. The films are destroyed by acidizing or erosion during high velocity flow. In certaincases, passivity is designed into the alloy by combining chromium <strong>and</strong> nickel with iron. Whetherthese iron-chromium <strong>and</strong> iron-chromium-nickel alloys are active or passive depends upon the alloycomposition <strong>and</strong> the electrolyte. For example, in CO2 rich environments, 13% chrome alloys are successfulin preventing corrosion that destroys other alloys.25Cathodic protection using sacrificial anodes or impressed current to offset the current of the corrosioncell, can be applied to the outside of casing <strong>and</strong> pipelines <strong>and</strong> to the insides of production processingvessels where a continuous water phase exists. It cannot be used internally in most production tubingor inside pipelines.Materials for Sour ServiceThe following description of materials for Sour Service is from Wilhelm <strong>and</strong> Kanelg <strong>and</strong> representsgeneralized guidelines on selection of tubular components for hydrogen sulfide <strong>and</strong> carbon dioxideservice.High strength tubular steel grades, often containing chromium <strong>and</strong> molybdenum designated for use inH2S service include C75, L80, C90, <strong>and</strong> some specially processed C95. These materials exhibit necessaryresistance to SSC under some specific conditions for use in sour gas operations.In general, the higher the yield strength of a material, the more susceptible it is to SSC. There are norecognized carbon or low alloy steel compositions suitable for sour service at ambient temperatureswith yield strength in excess of 11 0,000 psi. The most widely used criterion for selection of materialsfor sour service is hardness. NACE requirement MR-01-75 specifies that for steels to be considered,they must have a hardness value below HRC-22 (some exceptions to HRC-26).426-10
Stainless steel casing (greater than 12% chromium) are used when superior resistance to general corrosionis necessary. Table 2 shows composition of several of the high nickel alloy materials. Thesteels increase in cost as corrosion resistance is increased.The following paragraphs, also from Wilhelm <strong>and</strong> Kane,lg describe the general classifications of thehigh strength alloys available for use in corrosive environments. Stainless steel is a generic term for agroup of steels having a chromium content of over 12%. Most metallurgists refer to the stainless steelswith the more widely based term “corrosion resistant alloy,” or CRA. The general classes of the alloysare listed in order of increasing resistance to SCC <strong>and</strong> SSC (also increasing cost).1.2.3.4.5.6.Martensitic stainless steels, (11 -1 8% chromium) have applications in wellheads <strong>and</strong> tubingwhere high yield strengths are not required.Precipitation hardened stainless steels (12-1 8% chromium <strong>and</strong> 6-1 2% nickel) are useful fordownhole equipment or tools that require non-cold-worked, high yield strength materials. Someof these materials, depending on composition, may be susceptible to SCC <strong>and</strong> SSC.Duplex stainless steels (22-28% chromium <strong>and</strong> 5-7% nickel) have a resistance to chloride crackingthat exceeds the resistance of low alloy austenitic stainless steels, but they may be susceptibleto SSC or SCC in the presence of H2S.Low alloy austentinic stainless steels (1 8% chromium <strong>and</strong> 10% nickel) offer better resistance toSSC than martensitic stainless steels, but yield strengths are limited. These alloys are susceptibleto SCC <strong>and</strong> pitting by chlorides.High alloy austentinic stainless steels contain 20-30% chromium <strong>and</strong> 20-35% nickel. Theyachieve strength through cold work <strong>and</strong> offer the best combination of corrosion resistance <strong>and</strong>mechanical properties of all the CRAs. The cost for these alloys is high.Nickel-based super alloys such as C-276, 71 8, <strong>and</strong> MP35N (cobaltlnickel-based) have betterresistance to H2S than most other types of commercial alloys but may be extremely expensive.They do have the advantage of very high yield strengths.7.Titanium alloys are slowly being introduced to the industry although the use is rare at the presenttime.CO2 CorrosionCO2, one of the acid gases, is a very common contaminate in gas, oil <strong>and</strong> water production, even insweet reservoirs. CO2 corrosion of steel is usually a localized corrosion that takes the form of pits ofvarious sizes. Liquid water is necessary for CO2 corrosion to take place.43 The typical corrosion productof the CO2 reaction is ferrous carbonate.a Dissolved carbon dioxide content is a function of pressure<strong>and</strong> temperature <strong>and</strong> pH is much less important. Corrosion increases for increasing carbondioxide content.Pitting produces severe penetration. Outside of the affected areas, the corrosion rate might be limited<strong>and</strong> the transition from an affected to an unaffected area can be very abrupt. The action of CO2 attackhas been described as both chemical <strong>and</strong> physical through ero~ion.~~~~~Erosion can accelerate theoverall corrosion rate by a hundredfold or more by removal of protective scales, oxides <strong>and</strong> corrosioninhibitor films. Even for CO2, however, the increase in rates usually is in the area of five to tenThe addition of CO2 gas to water can reduce the pH to a value below 4, promoting acid attack. CO2corrosion from chemical attack has been generally effectively controlled through the use of 13%chrome tubulars.6-11
Although CO2 corrosion <strong>and</strong> stress sulfide cracking have nothing in common when both corrosion factorsare present in a well, control of both forms of corrosion may be accomplished by using a corrosion-resistantalloy to block CO2 attack <strong>and</strong> a reduced hardness to prevent SSC. Choosing a 13%chromium steel that has a hardness below 22 Rockwell hardness-C, (LSO tubing), should also beeffective.One severe drawback to using the 13% chromium steels is that they exhibit very limited resistance topitting during storage where air <strong>and</strong> chloride are present (seacoasts). This type of corrosion can muchmore significant inside the pipe, particularly if condensation inside the pipe forms st<strong>and</strong>ing puddles.24In the well, control of pitting corrosion of the 13% chrome steels relies on the deaeration of water.The second type of severe corrosional effect produced by CO2 is largely physical -the erosional effectproduced by changes in fluid flow direction or an effect often described as ~ avitation.~~*~~*~~Erosion isthe increase in the rate of metal deterioration from the abrasive effects of a fluid flowing into orthrough a pipe. Other sources of erosion may include entrained gas in liquids, liquid droplets in gas,solids in any fluid, very high flow rates, or any restriction in the completion strings that causes a drasticchange in the flow velocity of the produced fluids. Erosion may often lead to a removal of the effectiveinhibitor, corrosion film, or reactant film. Severe cases can be identified by grooves or roundedpits or holes that are usually smooth <strong>and</strong> lie along the direction of flow. Removal of a protective inhibitoror corrosion oxide film takes place when the strain on the film or corrosion oxide layer exceeds thestrain for the failure of the film. Erosion by solids <strong>and</strong> droplets may also affect the tenacity of the filmon an exposed surface. The failure of a corrosion oxide layer takes considerably longer than the failurefor most film-forming materials.Squeezing or continuous injection of inhibitors may not be cost effective if the completion string ID issmaller than the minimum ID required to prevent erosion. If this principle is violated, the film may becontinuously stripped off, even at high loading rates. Not all inhibitor films react in the same manner tostripping by erosion; a few products offer very good performance in high velocity applications.Other FactorsThe presence of oxygen either as dissolved or entrained gas substantially increases the corrosion,Figure 6.4.2 In almost all fluid h<strong>and</strong>ling systems, oxygen must be removed prior to injection of water orshipment of the fluids by pipeline.The pH of the water <strong>and</strong> the velocity of the water influence the corrosion attack. The chart inFigure 6.5 illustrates the relative corrosion of flowing <strong>and</strong> nonflowing fluids versus the fluid pH. Thevelocities shown in the graph are for water velocities of 3 to 7 ft per second. Below 3 FPS, corrosion isreduced at pHs above 7. Notice for the flowing case that there is very little corrosion in waters with apH above 7 (basic). In these high pH waters, iron is almost insoluble, so the byproducts of a corrosionreaction cannot be swept away from the corrosion site <strong>and</strong> the corrosion reaction is stopped.The amount of water in the production is also a factor in corrosion. Water cuts below 25% are likely tocause less corrosion than water cuts above 45%, especially at pHs below 7. As water cut increases,the tendency for a steel surface to be oil wet decreases. Corrosion is very low for most oil wet surfaces<strong>and</strong> very high for most water wet surfaces. Since most wells are at least very slightly deviated,the water caused corrosion damage may be confined to a trench in the low side of the pipe. In wellswhere the flow rate in the tubing is not high enough to keep all the liquids moving at near the samevelocity, the water may reflux (up <strong>and</strong> down with gas rate changes) in the low side, creating a seriouscorrosion trench even at very low water cuts. Inspection with caliper or electromagnetic surveys (measuresmetal loss through field generation <strong>and</strong> interruption techniques) can usually spot the trench ifone exists. Water can be produced <strong>and</strong> carried as an emulsion (entrained water) at flow velocities of3-1/2 to 5 fps.6-12
0 5 10 15 20 25CARBON DIOXIDE - PPMFigure 6.4:(Endearn, 1989, Champion Chem.)Effect of dissolved oxygen on relative corrosion rate.RELATIVE CORROSION VS pH L VELOCITTCORROSION-EROSIONc7-11 12 10 8 7 8 4 2ALKALINE -pH-ACIDIC-Figure 6.5:(Endearn, 1989, Champion Chem.)Relationship of velocity of water <strong>and</strong> pH to corrosion.Corrosion by Stimulation AcidsThe use of stimulation acids such as HCI <strong>and</strong> HCVHF create severe problems in the specialty tubulars.Special problems of selective effects of inhibitor^,^^ pitting <strong>and</strong> intergranular attack,47 detrimentalinfluence of added organics,48i49 <strong>and</strong> increased corrosion of the fluoride ion,50 require special inhibitors<strong>and</strong> special inhibition techniques for the high allow steels. The primary attack of the steels by acidis severe pitting <strong>and</strong> intergranular attack that is difficult to control with inhibitors. Localized pitting maybe severe enough to ruin a section of the string.Acid inhibitors work in the same manner as other corrosion inhibitors; by filming <strong>and</strong> passivating thesurface. The HCI <strong>and</strong> HCVHF acids are much more severe environments than other types of corrosion<strong>and</strong> the inhibitors for these uses are specially blended <strong>and</strong> have much shorter effective life spans.6-13
Also, presence of mutual solvents, alcohols, oil solvents <strong>and</strong> surfactants in the acid may alter ordestroy the effectiveness of some inhibitors.Some of the expensive super alloys, such as the 13-chrome materials, may be especially sensitive toHCVHF acid attack <strong>and</strong> special inhibitors are required.Destruction of ElastomersThe steels used in the tubulars <strong>and</strong> well equipment are not the only materials susceptible to corrosion.The elastomers (plastics <strong>and</strong> rubbers) used in the seals are also affected by the well fluids <strong>and</strong> mustbe carefully selected to avoid problems. The attack on elastomers by gas is usually by swelling or blistering,5’both involve invasion of the elastomer by the gas. Rapid release of the pressure around agas permeated seal will likely cause explosive decompression <strong>and</strong> destruction of at least the outerlayer, the sealing edge, of the seal. Surprisingly, although gas permeation of a seal can destroy theseal when pressure is released, the seal may function adequately before pressure release. Reactionof various liquids to elastomer seals depends on seal type <strong>and</strong> position, temperature, liquid type, pressure,previous seal contamination <strong>and</strong> the presence of some lubricants used for tool assembly.52 Ingeneral, nitrile seals are used for most general purpose applications where oil contact is necessary.Other compounds such as the fluorinated elastomers (e.g., Viton) are available for contact with aromaticsolvents (xylene <strong>and</strong> toluene). Other specialty compounds are available for specific, highly corrosiveconditions or contact with powerful solvents; however, seal cost increases quickly with the moreexotic elastomer compounds. Some metal-to-metal seals are being offered where elastomer destructionis most severe.53Microbial CorrosionMicrobiologically influenced corrosion (MIC) active corrosive influence of the attached (sessile) bacteriacolonie~.’~*~~ The problems are two fold; the colonies cover areas of steel, blocking corrosioninhibitors from reaching the pipe surface, <strong>and</strong> the waste products of the colonies are often very corrosivein the protected areas under a colony. The sulfate reducing bacteria, SRBs, are the most detrimental,with the capability of souring wellbores <strong>and</strong> parts of reservoirs with H2S. Bacteria arecontrolled by cleaning the water <strong>and</strong> treating with bactericides.Nonmetallic TubularsAs an alternative to steel casing with its problems with corrosion, fiberglass casing, tubing <strong>and</strong> rodsare being applied in some ~ e l l s The . ~ advantages ~ ~ ~ ~ of the plastic materials are excellent resistanceto most forms of water related corrosion <strong>and</strong> some scale <strong>and</strong> paraffin deposition. Most applicationshave been in shallow, low pressure wells, where high strength is not needed; however, new placementtechniques <strong>and</strong> plastic formulations are stretching limits of application.Predictive Techniques <strong>and</strong> Inspection DevicesMonitoring the rate of corrosion is of critical importance to determine when to repair or replace equipment<strong>and</strong> to judge the effectiveness of corrosion control techniques on well eq~ipment.~~-~~ A systematicexamination of the produced fluid chemistry, operating conditions <strong>and</strong> failures can describe thepotential for further failure.55 Monitoring of corrosion in the well uses several logging techniques tomonitor abrasion (<strong>and</strong> other wear), pitting <strong>and</strong> surface corrosion.The data from produced fluid analysis includes ion analysis, pH, gas type <strong>and</strong> content. It can be usedwith computed based predictive models to establish a general potential for corrosion in the well. Corrosioncoupons inserted into the well stream can verify the predictive results <strong>and</strong> help evaluate theeffect of an inhibitor. Sections of test pipe are also used, normally in surface piping, to evaluateselected metals.6-14
When a corrosion related failure occurs, it is most important that the cause of the failure be determined.The analysis of corrosion products <strong>and</strong> the characteristic corrosion pattern can usually determinethe type of corrosion that caused the failure. Hardness tests, microscopic examination, <strong>and</strong>chemical analysis of the failed <strong>and</strong> unaffected surfaces are also tools of identifi~ation.~~To monitor the corrosion rate <strong>and</strong> general condition of the tubulars in the well, a set of instruments areused that provide data for comparisons with earlier readings to arrive at a corrosion or erosion rate.These tools include multifingered caliper~,~~ probes for measuring anodic activity,57 induction tools tomeasure pipe mass,58 magnetic devices,59 sonic tools that measure pipe thickness,60 <strong>and</strong> someexperimental tools that locate cracks in the pipe.60 These tools will establish a rate of corrosion orwear when the results from several regular runs are compared.ErosionSurface erosion from solid particles in a high velocity produced fluid stream is normally associatedwith unstable formations such as unconsolidated s<strong>and</strong>s. Other occurrences of erosion include casesof choke <strong>and</strong> tree loss following rapid back flow of wells after fracturing. The common denominator isthe high flow velocity.Maximum velocities that can be tolerated in a situation will depend on the flowing fluid <strong>and</strong> other factorsincluding foaming or emulsifying tendency, solids <strong>and</strong> entrained gas. Mechanical limitations in thepiping design or metering apparatus may also influence the maximum permissible flow rate.Although some information exists that a corrosion inhibitor film is removable by high velocity flow,2i61other authors offer evidence of successful inhibitor film performance at mass velocities of up to100 Wsec with abrasion where inhibitor was continuously present.62 In any design where flow rateswill be high, a testing program should be used to identify the best method of corrosion protection.The concept of critical velocity for flow of fluids with no solids in sizing of piping is covered in API RP-14E.63 In general, the limits for dry crude flow velocity in pipe is about 30 to 35 fps (ft per second) <strong>and</strong>for wet crude, the maximum velocity is 20 to 25 fps. At faster flow rates, some steel may be lost toabrasion from the clean liquids. In some inhibitor protected systems, the limit of fluid velocity is oftenmuch higher than set by the API equation.,VPCCCC= maximum velocity to avoid corrosion= fluid density in pounds per cubic ft= operating constant= 100 to 125 for long life projects= 160 for short life projects= 150 to 300 for projects with good inhibitor filmingThe validity of the RP-14E equation has been debated by Craig68-70 <strong>and</strong> Smart,71 <strong>and</strong> a version ofCraig’s information is relayed in the following information.The erosion rate of any metal surface is strongly controlled by the presence <strong>and</strong> hardness of naturallyoccurring (but metal-composition related) oxide or sulfide film. This film, which depending on composition,can be much harder than the pure metal surface, is one of the main factors that reduce erosion(<strong>and</strong> some forms of chemical corrosion).6-15
Presence of mist droplets in the stream can destroy the natural or added inhibitor barriers <strong>and</strong> rapidlyincrease corrosion. Actual abrasive induced failures of the pipe depend on the entrained droplets orsolids in the gas as well as the density of the gas. Estimates of the densities <strong>and</strong> good design velocitiesare contained in Figure 6.6. For further information, refer to the “<strong>Oil</strong> Field Corrosion Detection <strong>and</strong>Control H<strong>and</strong>book,” by Endean, available from Champion Chemicals Inc., Houston.Figure 6.6:(Endeam, 1989, Champion Chem.)Empirically derived curve of suitable design velocitiesfor flow of liquid <strong>and</strong> gas in tubing in vertical wells.The API RP-14E equation is a quasi-rigorous attempt to determine critical velocity for general purposeprojects. Craig 68 proposed flow ranges for a modification of the RP-14E equation, proposed by Griffith<strong>and</strong> Rabinowicx (1985), where the C factor was calculated. The calculated value of C was basedon actual well conditions. The equation was only very slightly different:vc = Cp3’7,but the C was dependent on flowing fluid <strong>and</strong> pipe metallurgy, rather than a range of operating constants.When using chemical resistant alloys such as stainless <strong>and</strong> some nickel based materials(especially those containing Chromium), the stable range of the C factor in the equation would be inthe range of 160 to 300. The 160 to 300 range for CRA tubulars is well proven infield performance forlong lived projects.The ultimate value of C is then dependent on alloy composition, oxide or sulfide layer composition,<strong>and</strong> flowing fluid composition (H2S, CO2, etc.). The layer composition <strong>and</strong> fluid resistance would alsochange with temperature <strong>and</strong> impact resistance. Craig proposed a further modification of the equationto allow input of the oxide hardness layer:6-16
where P is the measured hardness of the oxide layer in kg/mm2 <strong>and</strong> p is fluid density in Ib/ft3. The useof such an equation for calculations is limited at the present time by available data on hardness, P.Craig offers the following explanation: “for Ti alloys, using a hardness of 1,000 kglmm2 for titaniumdioxide (Ti02) film formed on the alloy, the C factor would be 189. However, if aluminum oxide (aI2O3)were incorporated into the oxide of any alloy so it was the predominate film, then P E 200 kg/mm2 <strong>and</strong>C = 255. Conversely, if a SS or Ni-based alloy containing Cr is exposed to a high H2S environment,then the film could be predominately Cr2S3, with P - 480 kg/mm2 <strong>and</strong> C would drop to 138l (with datafrom A.A. Ivan’ko - H<strong>and</strong>book of Hardness),Impingement of particle laden fluids on a screen, casing wall, choke, or other surface in the well willresult in some erosion, regardless of the velocity flow. Erosion is usually only severe however, whenthe fluid flow velocity is high enough to impact the solid particles on the surface with enough force toabrade the metal or the natural or man-made coating on the metal surface.Well completion decisions in wells with solids erosion problems may take one or more of three routines:(1) decrease the flowing liquid velocity with larger perforations, larger wellbores <strong>and</strong> larger tubing,(2) use hardened blast joints to slow the rate of erosion, <strong>and</strong> (3) control the solids with gravelpacks <strong>and</strong> screens.If the erosion problem is slight, blast joints represent the cheapest methods of control. If erosion issevere, the producing pays are usually gravel packed.The erosion rate of any surface exposed to fluids that contain solids depends on the size, roundness,<strong>and</strong> composition of the solids, the amount of solids in the flow stream, the velocity of the flowing fluid,the shape of the flow path <strong>and</strong> the hardness of the metal layer exposed to the fluid. The worst erosionconditions are created when s<strong>and</strong> grain sized (0.01 to O.l”), particles of high density materials rapidlystrike the metal surface at angles of about 45” to 95”. If the energy of the impact is sufficient to dislodgeor break the oxide layer, then erosion <strong>and</strong> some forms of corrosion will be accelerated.Corrosion <strong>References</strong>1. Uhlig, H. H.: Corrosion H<strong>and</strong>book2. Endean, H. J.: “<strong>Oil</strong>field Corrosion Detection <strong>and</strong> Control,” Champion Chemicals, Houston, 1989.3. Tuttle, R. N.: “Corrosion in <strong>Oil</strong> <strong>and</strong> <strong>Gas</strong> Production,” Journal of <strong>Petroleum</strong> Technology (July1987), pp. 756-762.4. Cron, C. J. <strong>and</strong> G. A. Marsh: “Overview of Economic <strong>and</strong> <strong>Engineering</strong> Aspects of Corrosion in <strong>Oil</strong><strong>and</strong> <strong>Gas</strong> Production,” Journal of <strong>Petroleum</strong> Technology (June 1983), pp. 1033-1 041.5. Patton, C. C.: Applied Water Technology, Book, Campbell <strong>Petroleum</strong> Services, Norman, OK,1986.6. Peabody, A. W.: Control of Pipeline Corrosion, Nat. Assoc. of Corrosion Eng., Houston, TX,(1967).7. Rice, P. W.: “Selecting Metallic Materials For Downhole Service,” World <strong>Oil</strong>, (Nov. 1989), pp. 70-76.8. Comments from Jack Smart, Welchem.6-17
9.Smart, J. S. Ill: “A Review of Erosion Control in <strong>Oil</strong> <strong>and</strong> <strong>Gas</strong> Production,” NACE Paper for presentationat the 1990 Annual Meeting, Las Vegas.10.11.12.13.14.15.16.Hamby, T. W.: “Development of High-pressure Sour <strong>Gas</strong> Technology,” Journal of <strong>Petroleum</strong>Technology (May 1 981 ), pp. 792-798.Currie, D. M.: “The Use of Corrosion Resistant Alloys in Sour <strong>Gas</strong> Surface Production Facilities,”Paper OCT 61 11 presented at the 21 st Annual OTC in Houston, May 1-4, 1989, pp. 583-588.Corbett, R. A. <strong>and</strong> W. S. Morrison: “Comparative Corrosion Resistance of Some High-Nickel,Chromium-Molybdenum Alloys,” Materials Performance (February 1989), pp. 56-59.Bradley, W. B. <strong>and</strong> J. E. Fontenot: “The Prediction <strong>and</strong> Control of Casing Wear,” Journal of<strong>Petroleum</strong> Technology, (February 1975), pp. 233-237.Jasinski, R.: “Corrosion of N80-Type Steel by C02/Water Mixtures,” Corrosion-NACE, Vol. 43,No. 4, April 1987, pp. 214-218.Bowman, R. W.; A. K. Duniop <strong>and</strong> J. P. Tralmer: “CO/CO2 Cracking in Inert <strong>Gas</strong> - Miscible Flooding,”Materials Performance (April 1977), pp. 28-32.Storey, W. D.: “Hydrogen Sulfide Corrosion of Metals,” <strong>Oil</strong>week, May 20, 1963, pp. 721-724.17. Littmann, E. S.: “Control of Microbiologically Influenced Corrosion in <strong>Oil</strong>field Production Equipment,”Paper Spe 16909 presented at the 62nd Annual Technical Conference <strong>and</strong> Exhibition ofthe Society of <strong>Petroleum</strong> Engineers, Dallas, September 27-30, 1987.18.19.20.21.22.23.24.Berkowitz, B. J., Horowitz, H.. H.: “The Roles Of H2S in the Corrosion <strong>and</strong> Hydrogen Embrittle-ment of Steel” J. Electrochem. Soc., (March 1982), 468-73.Wilhelm, S. M. <strong>and</strong> R. D. Kane: “Selection of Materials for Sour Service in <strong>Petroleum</strong> Production,”Journal of <strong>Petroleum</strong> Technology (October 1986), pp. 1051-1 061.Merrick, R. D.: “An Overview of Hydrogen Damage to Steels at Low Temperatures,” MaterialsPerformance (February 1989), pp. 53-55.Kane, R. D.: “Special Tubulars Find Exp<strong>and</strong>ing Role,” <strong>Petroleum</strong> Engineer (March 1988), pp. 43-46.Parkins, R. N.; A. Alex<strong>and</strong>ridou <strong>and</strong> P. Majumdar: “Stress corrosion cracking of C-Mn steels inenvironments containing carbon dioxide,” Materials Performance (October 1986), pp. 20-27.Ogundele, G. I. <strong>and</strong> W. E. White: “Some Observations on the Corrosion of Carbon Steel in Sour<strong>Gas</strong> Environments - Effects of H2S <strong>and</strong> H2/CO2/CH4/C~H8 Mixtures,” Corrosion - NACE, Vol. 42,NO. 7, July 1986, pp. 398-408.Crolet, J.: “Acid Corrosion in Wells (CO2, H2S) - Metallurgical Aspects,” Journal of <strong>Petroleum</strong>Technology (August 1983), pp. 1553-1 558.25.Craig, 6.: “How to Determine Erosion-Corrosion Resistance of Chromium Steels,” <strong>Petroleum</strong>Engineer (March 1989), pp. 24-27.6-18
26. Videm, K. <strong>and</strong> A. Dugstad: “Corrosion of Carbon Steel in an Aqueous Carbon Dioxide Environment;Part 1 : Solution Effects,” Materials Performance (March 1989), pp. 63-67.27. Videm, K. <strong>and</strong> A. Dugstad: “Corrosion of Carbon Steel in an Aqueous Carbon Dioxide Environment;Part 2: Film Formation,” Materials Performance (April 1989), pp. 46-50.28. Roche, M. <strong>and</strong> J. P. Samaran: “Pipeline Coatings Performance Field Experience of an Operating<strong>Petroleum</strong> Company,” Paper NACE 28 presented at the Corrosion 87 Conference, San Francisco,March 9-1 3.29. Bellassai, S. J.: “Coating Fundamentals,” Materials Performance (December 1972), pp. 55-58.30. Banach, J. L.: “Pipeline Coatings - Evaluation, Repair, <strong>and</strong> Impact on Corrosion ProtectionDesign <strong>and</strong> Cost,” Paper Nace 29 presented at the Corrosion 87 Conference, San Francisco,March 9-13.31. Burton, S. A. <strong>and</strong> R. Ross: “Corrosion Protection with Elastomers; An investigation of cathodicprotection effects on elastomeric coated pipelines <strong>and</strong> risers,” Corrosion Prevention & Control(April 1987), pp. 45-50.32. Evans, S.: “Cost Effective Treatment Looks at Entire Production System,” World <strong>Oil</strong>, (Jan 1990),pp. 105-107.33. Ann<strong>and</strong>, R. R.; H. M. Hilliard <strong>and</strong> W. S. Tait: “Factors in the Corrosivity of Seawater Used forSecondary <strong>Petroleum</strong> Recovery,” <strong>Oil</strong> Field Subsurface Injection of Water, pp 41 -53.34. Weeter, R. F.: “Conditioning of Water by Removal of Corrosive <strong>Gas</strong>es,” Journal of <strong>Petroleum</strong>Technology (February 1972), pp. 181 -1 84.35. Alex<strong>and</strong>er, R. A.: “Environmental Method Controls CorrosionlCracking in Mobile Bay,” J. <strong>Petroleum</strong>Technology, (Jan. go), pp. 62-66.36. Simmons, E. J.: “Cathodic Protection of <strong>Oil</strong> Well Casings,” SPESC, 1968, pp. 245-255.37. Smith, H. M.; M. F. Bird <strong>and</strong> R. H. Penna: “Factors Affecting the Cathodic Disbonding of PipeCoatings,” Materials Performance (Noamber 1988), pp. 19-23.38. Houghton, C. J. <strong>and</strong> R. V. Westermark: “North Sea Downhole Corrosion - Identifying the Problem;Implementing the Solutions,” J. of Pet. Tech., (January 1983), pp. 239-246.i39. Frank, W. J.: “Here’s how to deal with corrosion problems in rod-pumped wells,” <strong>Oil</strong> <strong>and</strong> <strong>Gas</strong>Journal, May 31, 1976, pp. 63-72.40. Reinhardt, J. R.: “Phase diagrams can locate gas-condensate-well corrosion,” <strong>Oil</strong> <strong>and</strong> <strong>Gas</strong> Journal,April 4, 1988, pp. 41-47.41. Akrarn, N. F., Butler, J. C.: ’‘Corrosion in Sajaa Field,” Proceedings of the 4th Middle East CorrosionConference, Bahrain Society of Engineers, Bahrain, January 1988, pp. 535-550.42. “Material Requirements, Sulfide Stress Cracking Resistant Metallic materials for <strong>Oil</strong> Field Equipment,”National Association of Corrosion Engineers St<strong>and</strong>ard MR-01-75.43. Hilliard, H. M.: “Corrosion Control in Cotton Valley Production,” Paper Spe 9062 presented at theSPE Cotton Valley Symposium, Tyler, May 21, 1980.6-19
44. Carbon, H. A.: “Corrosion in Natural <strong>Gas</strong> - Condensate Wells,” industrial <strong>and</strong> <strong>Engineering</strong>Chemistry, March 1949, pp. 644-645.45. Bradburn, J. B., Kalra, S. K.: “Corrosion Mitigation - A Critical Facet of Well Completion Design,”J. Pet. Tech., (Sept. 1983), pp. 1617-1623.46. Garber, J. D. <strong>and</strong> M. Kantour: “How High-Alloy Tubulars React in Acidizing Environments,”<strong>Petroleum</strong> Engineer (July 1984), pp. 60-68.47. Burke, P. A.; J. L. Dawson; G. Bailey <strong>and</strong> R. C. Woollam: “Corrosion of Chromium Steels inInhibited Acids,” Paper NACE 41 presented at the Corrosion 87 Conference, San Francisco,March 9-13.48. Jasinski, R.; W. W. Frenier, <strong>and</strong> S. Grannan: “Inhibiting HCI Corrosion of High Chrome TubularSteels,” Paper NACE 188 presented at the Corrosion 88 Conference, St. Louis, March 21-25.49. Walker, M. L. <strong>and</strong> T. H. McCoy: “Inhibition of High Alloy Tubulars I1 - Effect of Fluoride Ion <strong>and</strong>Acid Strength,” Paper Nace 189 presented at the Corrosion 88 Conference, St. Louis, March 21-25.50. Walker, M. L. <strong>and</strong> T. H. McCoy: “Effect <strong>and</strong> Inhibition of Stimulation Acids on Corrosion ResistantAlloys,” Paper Nace 154 presented at the Corrosion 86 Conference, Houston, March 17-21.51 Spriggs, D.: “Equipment Selection Critical to EOR Operations” Pet. Eng. Intl., (Nov. 1987), 28-30.52. Moore, N. B.; J. Hellums <strong>and</strong> R. T. S. Chang: “0-Ring Seal Failure Mechanisms,’’ Paper OTC6131 presented at the 21st Annual Offshore Technology Conference, Houston, May 1-4, 1989,pp. 83-94.53. Haeberle, T. <strong>and</strong> P. J. Kovach: “Material Considerations for High-Deformation Sealing Systemsin H2S <strong>and</strong> Chloride Environments,” Paper OTC 6084 presented at the 21st Annual OffshoreTechnology Conference, Houston, May 1-4, 1989, pp. 403-41 0.54. Chen, E. Y. <strong>and</strong> R. B. Chen: “Monitoring Microbial Corrosion in Large <strong>Oil</strong>field Water Systems,”Journal of <strong>Petroleum</strong> Tech. (July 1984), pp. 11 71-11 76.55. Walker, C. K. <strong>and</strong> G. C. Maddux: “Corrosion-Monitoring Techniques <strong>and</strong> Applications,” MaterialsPerformance (May 1989), pp. 64-70.56. Stephens, R. M. <strong>and</strong> M. F. Mohamed: “Corrosion Monitoring <strong>and</strong> Inhibition in Khuff <strong>Gas</strong> Wells,”Journal of <strong>Petroleum</strong> Technology (October 1985), pp. 1861 -1 866,57. Myers, R. D.; G. R. Cameron <strong>and</strong> D. B. Lebsack: “An Evaluation of Corrosion Monitoring Techniquesfor Measuring Corrosion Inhibitor Performance in Sour <strong>Gas</strong> Gathering Systems,” PaperCIM 88-39-1 16 presented at the 39th Annual Technical Meeting of the <strong>Petroleum</strong> Society of CIMheld in Calgary, June 12-1 6, 1988.58. Iliyan, I. S.; W. J. Cotton <strong>and</strong> G. A. Brown: “Test Results of a Corrosion Logging Technique UsingElectromagnetic Thickness <strong>and</strong> Pipe Analysis Logging Tools,” Journal of <strong>Petroleum</strong> Technology(April 1983), pp. 801 -808.59. Moyer, M. C. <strong>and</strong> B. A. Dale: “Methods for Evaluating the Quality of <strong>Oil</strong>field Tubular Inspections,”Journal of <strong>Petroleum</strong> Technology (January 1986), pp. 88-96.6-20
60. Kiefner, J. F.; R. W. Hyatt <strong>and</strong> R. J. Eiber: “Metal-loss, crack-detection tools targeted,” Technology,April 24, 1989, pp. 69-71.61. Salama, M. M., Venkatesh, E. S.: “Evaluation of API-RP-14E Erosional Velocity Limitations forOffshore <strong>Gas</strong> Wells,” Offshore Tech. Conf., Paper 4485, Houston, 1983.62. Jones, L. W.: Corrosion <strong>and</strong> Water Technology, <strong>Oil</strong> <strong>and</strong> <strong>Gas</strong> Consultants International, Inc.,Tulsa, 1988.63. “API Recommended Practice for Design <strong>and</strong> Installation of Offshore Production Platform PipingSystems,” API RP-14E.64. Altunbay, M., Kalra, S. K.: “Nomograph Helps Predict Erosional Control,” World <strong>Oil</strong>, (March1988), pp. 43-45.65. Oney, C. L. “Fiberglass Line Pipe Requires Special Care,” Pet. Eng. Intl., (Nov. 1987), 34-36.66. Oney, C. L. “Special Considerations Needed for Fiberglass Tubing,” Pet. Eng. Intl., (Dec. 1987),29, 30.67. Kane, R. D., Greer, J. B.: “Sulfide Stress Cracking of High-Strength Steels in Laboratory <strong>and</strong> <strong>Oil</strong>fieldEnvironment,” J. Pet. Tech., November 1977, pp. 1483-1 488.68. Craig, B. D.: “Predicting Critical Erosion-Corrosion Limits of Alloys for <strong>Oil</strong> <strong>and</strong> <strong>Gas</strong> Production,”Material Performance, pp. 59-60, September, 1998.69. Craig, B. D.: “Critical Velocity Examined for Effects of Erosion-Corrosion,’’ <strong>Oil</strong> <strong>and</strong> <strong>Gas</strong> J., pp. 99,Vol. 5, No. 27, 1985.70. Craig, B. D.: “Equation Clarifies Critical Velocity Calculation,” Pet. Eng. Int., pp. 42, Oct. 1990.71. Smart, J.: “The Meaning of the API RP14E Formula for Erosion Corrosion in <strong>Oil</strong> <strong>and</strong> <strong>Gas</strong> Production,”Corrosion/91, paper 85, Houston, NACE, 1991.36-21
Appendix 6.AVelocity limits for clean liquid erosion in tubulars can be described with an equation from API RP 14E:"@C= 0'/2(6.11)where:V, = maximum allowable velocity, Wsec, above which erosion would be expected to occurfor a clean, solids free fluid.C = a constant, typically 100 to 125. 100 recommended for continuous flow, 125 recommendedfor intermittent flow.p = density of fluid at flowing pressure <strong>and</strong> temperature, Ib/fL3From this equation, it is seen that erosion for clean liquids would be unlikely at normal flow rates.Presence of gas <strong>and</strong> solids can quickly change the erosion attack <strong>and</strong> damage may occur at muchlower flow rates. When gas in the produced fluid is responsible for erosion, the solution is usually areduction in rate or the use of larger id tubulars. With tubing strings that are single sized, the velocityat the top of the string is a maximum for the well. Tapered strings, with smaller diameter tubing nearthe bottom of the well may have the maximum velocity downhole. This velocity may be estimated bycalculating an estimate of the flow rate of the gas <strong>and</strong> then dividing by the tubing area.where:QRZPF,= gas flow rate mcf/d= absolute temperature, OF + 460"= compressibility factorZ estimates: Z = 1 if P c 1000 psi, Z = 0.9 if P > 1000 psi= operating pressure at the depth of interest in psi= gas flow rate, cfsThe gas velocity, V; in feet per second is then the rate divided by the area of tubing id.6V= tubing inside area in ft2If the pressure is not known, it can be estimated by subtracting the gradient of the gas from the surfacepressure to the proper depth. This process, as detailed in Figure 8.8 is not highly accurate sinceit uses the shut in wellhead pressure <strong>and</strong> a static gradient instead of a flowing wellhead pressure <strong>and</strong>a flowing fluid gradient. It will only work for dry gas. Much better estimates are available from multiphaseflow programs.6.A-22
Chapter 7: in fio w Performance, Tubing Selection,<strong>and</strong> Artificial LiftMaximizing production from a well depends on reducing unneeded pressure drop all along the flowpath; from the heart of the reservoir to the pipeline. Completion design should focus on the areas ofmost common pressure drop, in this case, the tubular flow path. The objective is to design a flow paththat will a) transport both gas <strong>and</strong> liquids (without allowing liquid dropout) <strong>and</strong>; b) will minimize pressuredrop. Since small tubulars are better to transport liquids with available gas flow <strong>and</strong> large tubularsare more efficient at reducing pressure drop, there is often a compromise needed or an alternatelife mechanism required. Complicating the problem is the expansion of gas, resulting in a dynamicallychanging flow path from top to bottom. To satisfy both requirements, many strings are designed astapered strings; small ID on bottom <strong>and</strong> large on topThe performance of a producing well <strong>and</strong> the correct tubing size depends on three sets of fluid behaviorconditions. There is one set of conditions controlling fluid entry into the well, a different set controllingflow of mixtures from bottom to top <strong>and</strong> another set describing flow through back pressure devicesat the surface.’ The first is inflow performance, the second is vertical lift performance, <strong>and</strong> the third isback pressure response from the choke. Often the parameters set for one of the three performanceareas will directly affect the execution of the others. A large bottom hole pressure, for example, willassist in vertical flow but will act as backpressure to reduce inflow.Effective use of available pressure is the key to an optimum completion. Pressure drops are necessaryfor well operation. For any steady-state flow, the sum of: the drawdown, the pressure drop frombottom to top in the tubing, <strong>and</strong> the pressure drop across the choke is equal to the difference betweenthe flowing pressure of the well <strong>and</strong> the surface flow line pressure. Modeling the various pressuredrops to determine optimum production rates is normally done with a nodal analysis simulator. Severalruns on the simulator will generally pinpoint problem areas <strong>and</strong> the best operation procedures.Inflow PerformanceThe inflow performance of a well describes the flow capacity of a well vs. the drawdown pressure at acertain time for given set of conditions. The data for an inflow performance relationship curve, IPR, isgathered by producing the well at various drawdown <strong>and</strong> measuring the fluids production rate. Normally,the liquid rates are plotted separately <strong>and</strong> as total production. The curve, Figure 7.1, ideallywould be straight line as in this example plot from VogeI.* The productivity index, PI (or J), is:where:PI = Productivity Index, barrels oil per day per psi(9J = oil flow rate, bpd= maximum potential flow, bpdPr = reservoir pressure, psiPd = bottomhole well flowing pressure, psiThe PI is the inverse of the slope of the line shown in Figure 7.1. Inflow data, however, are rarelystraight since two phase liquid flow <strong>and</strong> gas flow are often combined. Under these conditions, the dataforms a curve similar to the general curve in Figure 7.2. When curvature exists in the inflow data, asingle PI does not exist because the value of the PIvaries continuously with the inverse of the slope.*7-1
The plotted curve is the inflow performance relationship of a well. Although the straight line approximationhas limitations, especially when applied to two-phase flow, it is still used because of the difficultyin calculating solutions.2 The process has been programmed for computer analysis <strong>and</strong> thesesolutions represent the best solutions to the design equipments. GLRs, depletion <strong>and</strong> water cutchange the shape of the curves. Back pressure on the well <strong>and</strong> the other factors influencing inflow,vertical flow, <strong>and</strong> back pressure also have large effects.. Drawdown Pr - hf\ Rate,Max. PrcdFroducing RateFigure 7.1:Straight line inflow performance relationship.Figure 7.2:MMfQ LIZL (m)(Buhidma)Inflow performance relationship for a well producingbelow the bubble point.Tubing DesignIf there is sufficient pressure, flowing is undoubtedly the simplest <strong>and</strong> cheapest method of operation.In some cases, it may also result in production rates higher than can be achieved by many lift methods<strong>and</strong> certainly less expensive. Vertical flow in the tubing may move in a variety of flow regimes. In mostflowing wells, the fluids move with some type of two-phase flow. For a well with oil above the bubblepoint<strong>and</strong> a high solution GOR, the regimes of flow will vary greatly. At the bottom of the well, the oilmoves as a single phase with no free gas. As the vertical rise is initiated, some gas starts to break outof solution, initiating foam flow. With decreasing depth, the bubbles form larger gas pockets, decreas-7-2
ing oil density <strong>and</strong> pushing liquid ahead of it in slug flow. With continued gas expansion (<strong>and</strong> highergas velocity), the oil is a film moving along the walls of the pipe. At the surface, the gas velocity isgreat enough to pick the oil up <strong>and</strong> carry it as a mist.’ This type of natural gas lift is the most commonform of flow in flowing wells.The keys to the vertical movement of liquids are pressure, fluid densities <strong>and</strong> the factors influencingflow velocity in the tubing. Any selected combination of liquid flow rate <strong>and</strong> tubular size will result in acertain velocity. The larger the tube id, the slower the velocity. As tube size increases, the velocitymay decrease to a point where gas breaks away from the liquids, creating unstable flow behavior, followedby liquid loading. When enough liquid accumulates, the well dies (ceases flowing). Selection oftubular size is based on preserving enough velocity to produce the well without holding a backpressureon the formation. The right tubing size for a high pressure gas well with no water production, willnot be the right tubing size a few years later when pressures <strong>and</strong> gas flow rates have declined <strong>and</strong>water is increasing.697 The best compromise is to run a large string when the well is new <strong>and</strong> toreplace the string with smaller tubulars later when the well has to be worked over, Figure 7.3. Smallerstrings, including coiled tubing, can be run inside the larger strings without pulling the larger string, ifrig cost factors make a workover economically unattractive. In high pressure, deep wells where thelifting effects of gas are poor near the bottom of the well, multiple sizes of tubing may be run on onestring. A ‘Yapered string may use 2-3/8 in. tubing at the bottom, 2-7/8 in. tubing in the middle of thestring <strong>and</strong> 3-1/2 in. tubing near the top. The purpose of the tapered string is to maintain similar velocitiesover the entire tubing string.01 1 I 1 I 1 10 so0 -1Ooo Is00 2ao PO0 3OooFigure 7.3:DWs(Kimmel)Effect of tubing size on the early <strong>and</strong> late years inproduction of a well. Note that the larger size tubingaccounts for more production early when ratesare high (less frictional backpressure) but thesmaller tubing can be unloaded easier (resistsheading) as pressure drops.Figure 7.4 (Patton <strong>and</strong> Abbott) shows the tubing performance curve, TPC, <strong>and</strong> IPR curve matches forseveral different wells. In these cases, the tubing size was varied using 1-1/2 in., 2-3/8 in., 2-7/8 in.<strong>and</strong> 3-1/2 in. nominal tubing sizes (OD). The tubing length, wellhead pressure, <strong>and</strong> GOR were heldconstant. In the plot, which shows three wells with different IPR curves, the best well, A, has the best7-3
IPR despite lower reservoir pressure. The well should flow at the following flow rates with the varioussizes of tubing in the well.1-1/22-3182-718TubingI#1 #2 #3Well A Well B Well CFlow Rate (BPD) Flow Rate (BPD) Flow Rate (BPD)L/ 1 122 244944 1211 4001355 .~1466 3773-1 12 I 2222 I 1756 I 420‘HaFigure 7.4:(Patton & Abott, 1981)Effect of tubing size on the performance of several wellswith different IPR curves.Well No. 2, with a higher reservoir pressure but a lower IPR, also has increasing flow rates for the varioustubing sizes. Well No. 3 is an unusual case of a well with a high flowing wellhead pressure but arelatively low flow rate. This is often the case in lower permeability formations. In this particularinstance, the smaller tubing will provide nearly the same flow rate as the larger tubing <strong>and</strong> will makemore efficient use of the reservoir gas for lifting the fluid production, especially over the entire life ofthe well. Increasing water cut, wellbore impairment, or an increase in the back pressure on the wellmay also cause severe reductions.The use of pressure gradient curves for flowing wells is advantageous because for any flow rate at setwell conditions of tubing size, water cut, GLR, <strong>and</strong> fluid characteristics, one curve can be used todescribe all the points in the pressure-depth relationship. If two of the variable set; P~ Pwh, depth, areknown, the other can be obtained from the graph. The curves are available from Brown.8 Use of thegradient curves is described by Patton & Abbotg In their example, the well has a PWh = 620 psi, tub-7-4
ing length of 91 60 ft, <strong>and</strong> GLR of 1000. Refer to Figure 7.5 for an example gradient curve for the followingsequence of steps.T Actuallengthtublng1Figure 7.5:Pressurero(Patton & Abott, 1981)Gradient curve for selecting tubing size.1.2.3.4.Select the family of GLR curves corresponding to the correct tubing size, liquid characteristics,<strong>and</strong> producing rate.Find the GLR curve on that set of curves which corresponds to the GLR of the well.Enter the graph from the top on the X-axis with the wellhead pressure <strong>and</strong> move down to wherethe pressure line intersects the proper GLR curve. The wellhead pressure in these graphs is theflowing wellhead pressure. The depth of the intercept (Y-axis) is the equivalent length of tubingthat will produce a pressure drop equal to the given flowing tubing pressure (-7220 ft).From the intercept at the Y-axis, drop down the scale an equivalent depth corresponding to theactual tubing length (9160 + 7220 = 16,380).5.At the corrected depth (the tubing length equivalent), move right until the proper GLR curve isintercepted. From this intercept, the reading on the pressure scale gives the bottomhole pressurerequired under the initial conditions (2720 psi).If the bottomhole flowing pressure is known, the steps can be reversed to establish a PWh for a certainflow rate. These curves should be verified early in the life of the well while it will still flow.After a set of gradient curves has been constructed or checked, pressures at various rates can beobtained by plotting the flowing, downhole tubing pressure on a pressure vs. rate graph <strong>and</strong> connectingthe points with a best fit curve. This construction is called the tubing performance curve, TPC. ATPC gives the pressure required for any selected rate according to a given set of well performanceparameters of GLR, WOR, Pwh, <strong>and</strong> tubing ID <strong>and</strong> length. Since the flowing tubing pressure <strong>and</strong> rateare dependent, if there is no intersection with an overplot of the IPR curve, the well cannot flow. This7-5
is an easy first check of the need for a lift system for initial flow (optimizing production is a little different).Use of the tubing performance curves is as follows (from Patton <strong>and</strong> Abbott):1. Draw the inflow performance curve for the total fluid production. If necessary, also drawn anuphole IPR curve (if the pump is set high).2. Estimate the produced fluid parameters such as water cut <strong>and</strong> GOR.3. Draw a tubing performance curve from the gradient curve that matches the produced fluidparameters.4. Plot the tubing performance curve <strong>and</strong> the inflow performance curve on the same graph. TheTPC <strong>and</strong> the IPR will have a variety of possible intersections.5. Curves that do not intersect, Figure 7.6, where the TPC is above IPR, indicates that the well willnot flow under the given conditions <strong>and</strong> artificial lift is required. For most well completions, thiswill be the st<strong>and</strong>ard check before an artificial lift method is determined.Figure 7.6:QP(Patton & Abott)IPR Curve - no intersection; lift required.a. Curves that do not intersect on the graph but have the TPC below the IPR, Figure 7.7, indicatethat flow will occur <strong>and</strong> a choke will be required to control production. The flow rates willactually intersect if the curve is extended.UoholeI\II \IIFigure 7.7:(Patton & Abott)IPR Curve - intersection at far right. A choke isrequired to control flow.7-6
.Curves that intersect at a low rate <strong>and</strong> have the TPC below the uphole IPR show the stablerate at which the well will flow under the given conditions, Figure 7.8. The rate in this casewill be limited by pressure <strong>and</strong> artificial lift may be capable of improving production.CFigure 7.8:a(Patton & Abott)IPR Curve - intersection shows that liftcould significantly increase productionfrom well.IC.Curves that intersect twice, once at low <strong>and</strong> once at high rate, Figure 7.9, with TPC belowthe IPR indicate an area of unstable flow at the low intersection <strong>and</strong> stable flow rate in thehigh intersection. If the well is not kicked off <strong>and</strong> flowing at the higher rate, it may drop to thelow rate <strong>and</strong> head (load up with liquid) <strong>and</strong> die. These wells are often gas lifted until a stableflow rate is achieved <strong>and</strong> then gas injection may be reduced or stopped.IIa 0mFigure 7.9:(Patton 8. Abbott)IPR Curve - intersections at two points indicatesthat the well could heat at the lowerintersection.6. The final step allows estimation of the effect of water cut on production rate. This requires developmentsof a TPC curve with varying water cuts for the tubing size, depth, <strong>and</strong> GOR that is givenfor the well. The uphole IPR is overlayed to determine the producing rates for various water cuts.The IPR is then adjusted for the change in flowing gradient between midformation <strong>and</strong> the end ofthe tubing that accompanies the change. The IPR curve should also be adjusted for changingreservoir pressure that accompanies the reservoir changes. Once these adjustments are made,the TPC <strong>and</strong> IPRs must be replotted <strong>and</strong> step 5 initiated again to find the pressure differentialsrequired in the future. As one might expect, most of these functions are available as a computerprogram or as part of a nodal analysis program for well optimization. In the nodal analysis programs,the entire system may be analyzed, piece-by-piece without losing sight of how one componentaffects the other.7-7
As the reservoir pressure declines in any situation, the IPR curve of any well will tend to shift towardthe origin as shown in Figure 7.10. If the effect of water cut is added to the decline in reservoir pressure,which can happen when water flows in from a separate low pressure zone, the region of stableflow in any particular IPR curve is driven toward the left. The well may become unstable <strong>and</strong> will notcontinue to flow at high rates. If water can be excluded from the production, the well will continue toflow even when the reservoir pressure has dropped very low. If the water cut is allowed to rise even afew percentage points, the well may die.Figure7.10:(Patton & Abbott)An example of declining IPR curve withincreasing production.The IPR <strong>and</strong> TPC curves can be used for predicting the performance of wells. Using predictions generatedin this manner, it is possible to economically justify workovers to shut off water or field pressuremaintenance in some situations.Selection of the size of tubing in a well is extremely important from an economic benefit as well as alift benefit for the well. In many cases, a larger ID tubular than is commonly employed in deep gaswells can increase productivity ~ubstantially.~HeadingMost naturally flowing oil wells that are not on either natural or artificial pressure maintenance, reacha stage in depletion when both gas <strong>and</strong> liquid flowing velocities are low. A heading well is characterizedby large pressure fluctuations at every point along the tubing string.'' It produces alternatelylarge liquid slugs with relatively small amounts of gas <strong>and</strong> a small amount of liquid with a large amountof gas. This type of inefficient use of the reservoir gas energy will ultimately lead to liquid buildupwithin the wellbore causing the well to be killed by the hydrostatic gradient of its own produced liquid.If heading is not determined as a problem in a well, expensive artificial lift equipment may be installedtoo early <strong>and</strong> money wasted. Wells without packers are often c<strong>and</strong>idates for heading.Three types of heading are described in the literature: casing, formation <strong>and</strong> tubing. Casing <strong>and</strong> formationheading are very similar in their nature <strong>and</strong> occur by almost the same process. Both problemsexhibit large pressure <strong>and</strong> flow rate fluctuations <strong>and</strong> both require a relatively large space or volumewhere the gas is allowed to separate from the liquid <strong>and</strong> accumulate. In the example of casing heading,this space is provided by the annulus, while in the formation, very large formations with high verticalpermeability may achieve the same separation. Where the well has been completed with a packer<strong>and</strong> tailpipe, only tubing heading may result since, with use of a proper depth tailpipe, the gas will usuallybreak around the pipe <strong>and</strong> help lift the liquid.7-8
Tubing DesignThree items are usually considered when designing a tubular configuration for a well: burst, collapse<strong>and</strong> tension. Burst <strong>and</strong> collapse calculations are h<strong>and</strong>led in the same way in tubing design as they arein casing design. Tension calculations, however, should be designed differently for the tubing string.Casing is normally designed in tension, with a safety factor of 1.6, where the tensile strength isrequired only during running of the casing. Tubing should be designed with consideration given to pulling.The design of the tension forces on the tubing string should allow for the constant overpullmethod. The amount of pull over the weight of the tubing up to the yield strength of the pipe at the topof each section (of a given weight <strong>and</strong> diameter) is used as a maximum tensile force. If the tubingbecomes stuck on a trip, attempts can be made to free it without jeopardizing the pipe.Artificial LiftSelection of the tubing size in a flowing well or the tubing <strong>and</strong> artificial lift system in a lower pressurewell is one of the most important design segments in well completion. Design of the lift system affectsthe economics of most projects.Selection of artificial lift must account for two main considerations; the inflow performance of the well<strong>and</strong> the capacity <strong>and</strong> operation of the lift system. The inflow performance is a function of the reservoir<strong>and</strong> various production characteristics <strong>and</strong> the efficiency of the stimulation.11-16 Ideally, each well in afield would be drilled <strong>and</strong> tested prior to lift system selection. Because of the unproductive timeinvolved in this method, an estimate of flow is usually made from the first well tests. For most fielddevelopment wells, the lift system is on location, ready to be installed when the well is completed.From the initial production appraisal, an inflow performance curve or set of curves is prepared as isdescribed in the section on inflow performance. To select the best lift system, a set of tubing intakecurves for each lift system should be made. The graphical solution for rate determination is taken atthe depth of the completion interval. The intersection of the tubing intake curve with the inflow performancerelationship, IPR, curve is the flow rate expected for a particular method, Figure 12.1 .11~15*16Other factors such as high GLRs <strong>and</strong> large volumes of water may alter the selection criteria. The firstintake curve for any well should be prepared assuming that the well will flow naturally. If the tubingintake curve lies completely above the IPR curve, then the well will not flow, as seen previously inFigure 7.6.Preparation of the tubing intake curve must take into account all the restrictions from the bottom of thetubing to surface facilities up to <strong>and</strong> including the separator. All losses are additive <strong>and</strong> the pressureloss analysis begins at the separator <strong>and</strong> works down the well. In order to generate the tubing intakecurves for a flowing pressure vs. flow rate diagram, it is necessary to estimate flow rates to calculatethe intake pressures. Analysis of the system usually is centered at a solution point or node (hence;nodal analysis). Solutions can then be made for optimization of the system by isolation of components:Figure 7.1 1. The nodal analysis of the lift components of a well can be done by h<strong>and</strong>, but ismuch faster when a computer is used.Rod pumping accounts for about 84% of U.S. wells on artificial lift, while 12% are on gas lift, 2% useESPs <strong>and</strong> the remaining methods (hydraulic piston, jet, plunger <strong>and</strong> others) combined account forabout 2Y0.l~ Worldwide, the type of lift system varies with region <strong>and</strong> type of well. <strong>Gas</strong> lift <strong>and</strong> flowingwells are more common in new, high production rate areas while various artificial lift systems are inuse elsewhere. Each of the systems has relative advantages <strong>and</strong> disadvantages as recorded by S. G.Gibbs17 <strong>and</strong> modified <strong>and</strong> reported by Brown in Figures 7.12 <strong>and</strong> 7.13. Each of the common lift systemswill be described in the following paragraphs. Basic design information is reported for the purposeof providing familiarization with the equipment.The lift system response can be plotted against the IPR curve to help select the optimum unit for thecompletion, Figure 7.14. This technique is usually a final comparison before economics are considered.7-9
Figure 7.11:(Brown & Lea)Pressure drops possible in the total completion.Rod Pumprun.,(Brown)Figure 7.14: Tubing intake curves for various lift systems.The basic design of a rod pump system described here is just slightly modified from that of a classicdescription by Gipson <strong>and</strong> Swaim.18 Operation of a rod pumped well encompasses several designloads on the beam, rods, tubing, pump <strong>and</strong> gearbox, which must be understood before a design canbe ~ompleted.'~-~~ Balanced design in a rod pumping system is very important. If a part of a balancedrod pumped system is strengthened, weakened, or made unnecessarily large, it may result in weakeninga part elsewhere in the system.The rod pump is a plunger with a two valve arrangement as shown in Figure 7.1 5.31 The st<strong>and</strong>ingvalve is a one-way valve at the bottom of the pump (allows flow from the wellbore to the pump but7-10
Rod PumpingRelatively simplesystem design.Jnits easily:hanged to otherNells with minimum:ost.Efficient, simple<strong>and</strong> easy for fieldDeople to operate.Applicable to slimholes <strong>and</strong> multiplemmpletions.Can pump a welldown to very lowpressure (depth<strong>and</strong> rate dependent).System usually isnaturally vented forgas separation <strong>and</strong>fluid level soundings.Flexible - canmatch displacementrate to wellcapability as well asdeclines.Analyzable.Can lift high temperature<strong>and</strong> viscousoils.Can use gas orelectricity as powersource.Corrosion <strong>and</strong>scale treatmentseasy to perform.Applicable to pumpoff control if electrified.Availability of differentsizes.Adjustable gear boxfor Triplex offersmore flexibility.Mixing power fluidwith waxy or viscouscrudes can reduceviscosity.Hydraulic PistonPumping'Not so depth limited- can lift large volumesfrom greatdepths (500 BOD(79.49 m3/d) from15,000 ft) (4572 m).Have been installedto 18,000 ft(5486.4 m).Crooked holespresent minimalproblem.Unobtrusive in urbanlocations.Power source canbe remotely located.Analyzable.Flexible - can usuallymatch displacementto well'scapability as well asdeclines.Can use gas or electricityas powersource.Downhole pumpscan be circulated outin free systems.Can pump a welldown to fairly lowpressure.Applicable to multiplecompletions.Closed system willcombat corrosion.Easy to pump incycles by time clock.Hollow sucker rodsare available for slimhole completions<strong>and</strong> ease of inhibitortreatment.Have pumps withdouble valving thatpump on bothupstroke <strong>and</strong> downstroke.ElectricSubmersiblePumpingCan litt extremelyhigh volumes(20,000 BPO +(1 9,078.48 m3/d) inshallow wells withlarge casing. Currentlylifting120,000 B/D fromwater supply wellsin Middle East with600 HP units.720 HP available.1000 HP underdevelopment.Unobtrusive inurban locations.Simple to operate.Easy to installdownhole pressuresensor for telemetering pressure tosurface via cable.Crooked holespresent no problems.Applicable offshore.Corrosion <strong>and</strong>scale treatmenteasy to perform.Availability in differentsize.Lifting cost for highvolumes generallyvery IOW.<strong>Gas</strong> LiftCan h<strong>and</strong>le largevolume of solidswith minor problems.H<strong>and</strong>les large volumein high P.I.wells (continuouslift) (50,000 BLPD) +(7949.37 m31d).Fairly flexible - convertiblefrom continuousto intermittentto chamber orplunger lift as welldeclines.Unobtrusive inurban locations.Power source canbe remotely located.Easy to obtaindownhole pressures<strong>and</strong> gradients.Lifting gassy wells isno problem.Sometimes serviceablewith wirelineunit.Crooked holespresent no problem.Corrosion is notusually adverse.Applicable offshore.Hydraulic JetPumpketrievable withoutpulling tubing.Very inexpensiveinstallation.Automaticallykeeps tubing cleanof paraffin, scale.Applicable for highgas oil ratio wells.Can be used in conjunctionwith intermittentgas lift.Can be used tounload liquid fromgas wells.Plunger Liftketrievable withoutpulling tubing.Has no movingparts.No problem in deviatedor crookedholes.Unobtrusive inurban locations.Applicable offshore.Can use water as apower source.Power fluid doesnot have to be soclean as for hydraulicpiston pumping.Corrosion scale <strong>and</strong>emulsion treatmenteasy to perform.Power source canbe remotely located<strong>and</strong> can h<strong>and</strong>le highvolumes to30,000 B/D(4769.62 m3/d).Figure 7.12: Relative Advantages of Artificial Lift SystemsS. G. Gibbs (with Modifications by Brown)stops reverse flow) <strong>and</strong> the traveling valve is another one way valve that is attached to the rod string.As the plunger is lifted by the rods on the upstroke, the traveling valve is closed, forming a low pressurearea beneath the plunger <strong>and</strong> drawing in wellbore fluid through the st<strong>and</strong>ing valve into the pumpchamber. At the end of the upstroke, the downstroke begins. When the bottom of the plunger (whichcontains the traveling valve) hits the surface of the liquid that has flowed into the pump, the travelingvalve is forced open as the valve moves through the liquid <strong>and</strong> the st<strong>and</strong>ing valve is closed. Thedownstroke of the plunger forces the liquid in the pump up through the traveling valve, adding it to the7-1 1
Rod PumpingCrooked holes preservea friction problem.High solids productionis troublesome.<strong>Gas</strong>sy wells usuallylower volumetric efficiency.Is depth limited, primarilydue to rodcapability.Obtrusive in urbanlocations.Heavy <strong>and</strong> bulky inoffshore operations.Susceptible to paraffinproblems.Tubing cannot beinternally coated forcorrosion.H2S limits depth atwhich a large volumepump can beset.Limitations of downholepump design insmall diameter cas-HydraulicPumpingPower 011 systemsare fire hazard.Large oil inventoryrequired in poweroil system whichdetracts from profitability.High solids productionis troublesome.Operating costs aresometimes higher.Unusually susceptibleto gas interference- usually notvented.Vented installationsare moreexpensivebecause of extratubing required.Treating for Scalebelow packer is difficult.Not easy for fieldpersonnel to troubleshoot.Difficult to obtainvalid well tests inlow volume wells.Requires twostrings of tubing forsome installations.Problems in treatingpower waterwhere used.Safety problem forhigh surface pressurepower oil.Loss of power oilin surface equipment failures.ElectricSubmersiblePumplng'Not applicable tomultiple completions.Only applicable withelectric power.High voltages(1 WO V ) are necmry.impractical in shallowlow volumewells.Expensive tochange equipmentto match decliningwell capability.Cable causes problemsin h<strong>and</strong>lingtubulars.Cablesdeteriorate inhigh temperatures.System is depth limited(10,000 ft )(3048.0 m) due tocable cost <strong>and</strong>inability to installenough powerdownhole.(Depends on casingsize.)<strong>Gas</strong> <strong>and</strong> solids productionare troublesome.Not easily analyzableunless goodengineering "knowhow".Lack of productionrate flexibility.Casing size limitation.Cannot be setbelow fluid entrywithout a shroud toroute fluid by themotor.More downtimewhen problems areencountered due toentire unit beingdownhole.<strong>Gas</strong> Llftut gas IS notalways available.Not efficient in liftingsmall fields or onewellleases.Difficult to lift emulsions<strong>and</strong> viscouscrudes.Not efficient forsmall fields or onewell leases if compressionequipment is required.<strong>Gas</strong> freezing <strong>and</strong>hydrate problems.Problems with dirtysurface lines.Some difficulty inanalyzing properlywithout engineeringsupervision.Cannot effectivelyproduce deep wellsto ab<strong>and</strong>onment.Requires make-upgas in rotative systems.Casing must withst<strong>and</strong>lift pressure.Safety problemwith high pressuregas.Hydraulic JetPumpinglift methdd.Requires at least20% submergenceto approach best liftefficiency.Design of system ismore complex.Pump may cavitateunder certain conditions.Very sensitive to anychange in back pressure.The producing offree gas through thepump causes reductionin ability to h<strong>and</strong>leliquids.Power oil systemsare fire hazard.High surface powerfluid pressures arerequired.Plunger LiftMay not take wellto depletion, henceeventually requiringanother lift method.Good for low ratewellsonly (normallyless than 200 B/D)(31.8 m/d).Requires moreengineering supervisionto adjustproperly.Danger exists inplunger reachingtoo high a velocity<strong>and</strong> causing surfacedamage.Communicationbetween tubing <strong>and</strong>casing required forgood operationunless used in conjunctionwith gaslift.Figure 7.13: Relative Disadvantages of Artificial Lift SystemsS. G. Gibbs (with Modifications by Brown)tubing. The new fluid pushes all the other liquid in the tubing up by the volume of liquid in the pump.The amount of distance between the top of the pump chamber <strong>and</strong> the surface of the liquid is voidspace. All pumps will have some void space, but too much can lead to equipment damage. The impactof the plunger on the liquid is described as fluid pound. The void area may result from gas breakout atthe reduced operating pressure of the pump, but the void may be large ifthe plunger goes up significantlyfaster than liquids can flow into the pump. Free gas is vented up the annulus. In a well with adequatereservoir liquid inflow to keep the liquid level above the pump at all times, filling the pump is7-12
dictated by oil viscosity, pump size <strong>and</strong> speed, restrictions in the equipment surrounding the pump,<strong>and</strong> gas in the fluids. On wells producing viscous fluids, large diameter valves, less restrictive pumpopenings <strong>and</strong> slow pump speeds are useful in more completely filling the pump <strong>and</strong> reducing fluidpound. For normal viscosity fluids, pump operating speed, pump length, <strong>and</strong> gas content are mostimportant. Under extreme cases of gassy fluids, the pump can be completely filled with gas (gas lock).When a pump is gas locked, it is almost impossible to tell the response from a parted rod string orfrom the well being pumped off (empty wellbore) since there is no fluid being pumped <strong>and</strong> no fluidpound.Start of upstrokeTraveling valve closesSt<strong>and</strong>ing valve opensFluid begins moving into pumpFluid above pump moves up the tubingp3 > p2P2> P1 at dynamic (pump filling)P2 - P1 at static (pump filled)Start of downstrokeTraveling valve opensSt<strong>and</strong>ing valve closesFluid in pump begins moving into tubingp2 > p1P2 7 Pg at dynamic (pump emptying)P2 = Pg at static (pump empty)Figure 7.15: Schematic of rod pump operation showing valveaction <strong>and</strong> pressure responses.iThe action of the values in the pump follow well defined operating patterns of opening <strong>and</strong> closing atcertain points in the cycle of rod string movement. It is the stretching <strong>and</strong> contraction of the sucker rodstring that complicates the description of pump operation. A test instrument called the dynamometer,which measures forces on the rod string caused by pumping, is used to optimize the operation of thepump <strong>and</strong> string.27 The dynamometer is attached to the polish rod. The polish rod is the uppermostrod in the string, passing through the stuffing box <strong>and</strong> attaching by a clamp <strong>and</strong> cable arrangement tothe head of the beam pumping unit. the stuffing box is a seal assembly that wipes the oil from the polishrod <strong>and</strong> forms a seal against the polish rod, maintaining the well pressure. The produced fluids arediverted into a surface pipe at a 'T' connection just below the stuffing box. The dynamometer measuresloads in the rod string by deflection of strain gauges. The gauges record stretch <strong>and</strong> recoil of therod string.7-13
The most common recording on a dynamometer is one full pump cycle. An example dynamometercard is shown in Figure 7.1 6.'' The cycle begins with pump running in steady-state operation <strong>and</strong> thepolish rod at lowest position (head of the beam lift fully down). This is the start of the upstroke. At thebeginning of the polish rod upstroke, the traveling valve in the pump is still open <strong>and</strong> the st<strong>and</strong>ingvalve is closed. As the polish rod starts traveling up, the pump plunger at the bottom of the well is stilltraveling down because of the effects of rod stretch. The pump plunger reaches the bottom of itsstroke soon after the polish rod upstroke has started. As the pump plunger starts upward, the travelingvalve closes <strong>and</strong> the st<strong>and</strong>ing valve opens. The upward movement of the plunger creates a low pressurearea that opens the st<strong>and</strong>ing valve <strong>and</strong> allows entry of the wellbore fluid. The fluid above the travelingvalve is lifted by the length of the plunger travel. At the beginning of the polish rod downstroke,the pump is still traveling upward with the st<strong>and</strong>ing valve open <strong>and</strong> the traveling valve closed. This tagtime between the movement of the polished rod <strong>and</strong> the plunger is brief. The deeper the well, themore tag time exists between the uppermost position of the polish rod <strong>and</strong> end of upward pumpplunger travel. As the pump plunger reaches the end of its upstroke, the polish rod is accelerating onthe downstroke. As the pump plunger starts downward, it will be accelerated by the weight of the rods<strong>and</strong> opposed by liquid in the working barrel. The traveling valve remains closed on the plunger downstrokeuntil the plunger contacts the surface of the liquid that has flowed into the barrel. At this point,the st<strong>and</strong>ing valve closes <strong>and</strong> the traveling valve opens. As the plunger continues its downstroke, thefluid in the barrel is displaced through the traveling valve. A 100% efficient pump (liquid filling <strong>and</strong>emptying the entire pump) would lift the liquid in the tubing by the pump stroke length. If the pump isnot completely full, the liquid in the tubing falls back by the height of the void space in the pump.PEAK LOADCompressionof RodsEnd ofDowns trokeElongationof RodsTV ClosinRod RecoiMinimumEnd ofUpstroke/Compress ionFigure7.16:Operation sequence of a rod pump <strong>and</strong> string labeled on adynomometer card.A sequence of dynamometer charts are shown in Figure 7.17.32 The first chart set is a dynamometercard from a correctly functioning pump, the second chart set shows the start of fluid pound caused bypumping off the well <strong>and</strong> the third set is developed fluid pound. Fluid pound should be minimized inany well to prevent damage to the rods, tubing, <strong>and</strong> pump.To minimize problems with rod pumped wells, a few basic considerations <strong>and</strong> support equipment arenecessary.'' A rathole below the perforations will be useful in allowing solids dropout <strong>and</strong> gas separation.A tension tubing anchor 100 to 200 ft above the pump will diminish rod <strong>and</strong> tubing wear by keepingthe tubing straight during the pump cycle. Unanchored tubing twists (corkscrews) every time thetraveling valve closes <strong>and</strong> the st<strong>and</strong>ing valve opens. Tubing stretch on each pump downstroke willcause the tubing collars to rub against the casing. A gas anchor (gas separator) helps separateentrained gas from the liquid to minimize gas locks in pumps. The covering over the pump is called themud anchor. This device has numerous slots which strain the fluids of potentially damaging solids, italso prevents damage to the pump if the tubing is run into the bottom of the hole.7-14
Dynamometer Cards Showing Full Liquid FillageDynamometer Cards with Wqm Tmveling Valve or PlungerQ(Full Liquid Fillage)Surfake CardPump CardADynamometer Cards Showin Unanchored Tubing(Full Uquid dage)Surface Card-c>-I/--?-/ Tubing MovementPump CardDDynamometer Cards with Worn St<strong>and</strong>ing Valve(Full Liquid Fillage)Surface CardPump CardDynamometer Cards Showing Fluid PoundDynamometer Cards Showing Pump Hitting Down <strong>and</strong>/or Up(Full Liquid Fillage)Pump CardIA. JD‘Loads ike showingpump kng down.(Kristiansen, Amoco, 1989)Figure 7.17: Surface <strong>and</strong> downhole dynomometer cards for various liftconditions.ISelection of rod strings is dependent upon depth <strong>and</strong> the buckling loads exerted on the rods on thedownstroke. Increasing depth places larger tensile loads on the rod strings <strong>and</strong> requires larger rods.The sucker rods above the pump can be buckled if the force required to drive the plunger downexceeds 21 Ib for 5/8 in. rods <strong>and</strong> 41 Ib for 3/4 in. rods.18 Buckling of the rods causes metal fatigue inthe rods <strong>and</strong> rod coupling-on-tubing wear that often leads to “split tubing.” To reduce rod coupling <strong>and</strong>tubing abrasion, stiffer rods above the pump, sinker bars, <strong>and</strong>/or rod guides are recommended. Toreduce pump wear, Gipson <strong>and</strong> Swaim recommend at least one full-bore, fluted, rod centralizer shouldbe run above the pump.18Pumps <strong>and</strong> plungers are sized by computer programs that consider a number of variables. The wellinflow performance, fluid viscosity, well depth, <strong>and</strong> water cut are all considered. Plunger lengthincreases with depth. Plunger lengths range from 3 ft in wells of 3000 ft to lengths of 6 ft in wells of6000 ft or deeper. Shorter plungers can be used when lifting very viscous oil. Leakage between theplunger <strong>and</strong> the working barrel (slippage) is inversely proportional to plunger length, <strong>and</strong> proportional7-15
to clearance in thous<strong>and</strong>ths of an inch cubed. Cutting the plunger length in half will double the slippage.Increasing the clearance from 0.001 to 0.002 in. will increase slippage by a factor of eight.Beam pumping units are described in API Std 11 E, “API Specifications for Pumping Units.” The bulletincovers beam design <strong>and</strong> torque ratings of parts.33 Designing the power system <strong>and</strong> optimizingpower usage are also discussed in the literature.34B5<strong>Gas</strong> LiftThe preparation of tubing intake curves become more complex for gas lift wells because the injectiongadliquid ratio is an additional unknown. Brown advises that the solution point is normally taken ateither the top or bottom of the well. The tubing intake curve is affected by the entire piping system. Atthe surface, the piping system has been isolated. In a detailed design, both solutions are advisable.Most liquids can be lifted by injecting gas into the liquid stream in the tubing near the bottom of thewell. As the gas rises the bubbles exp<strong>and</strong>, increasing the velocity of the fluid <strong>and</strong> decreasing its density.The amount of gas needed for lift depends on tubing diameter, liquid volume, liquid density, depth<strong>and</strong> bottom hole pressure. <strong>Gas</strong> injection may be needed only at the bottom in shallow wells or theinjection points may be spaced out along the tubing string in deeper<strong>Gas</strong> lift valves are spring loaded or pressure balanced release valves. The valves are set to open at acertain gas pressure. They feed a small amount of the gas from the annulus into the tubing. Thevalves are placed in gas lift m<strong>and</strong>rels: a special section in the tubing that receives the valve <strong>and</strong> givesit a port or opening to the gas in the annulus. The gas lift m<strong>and</strong>rels are spaced out in the tubing stringaccording to the design. Extra m<strong>and</strong>rels are usually added to allow for pressure decline during depletionor to meet the dem<strong>and</strong> of larger fluid lifting requirements when water influx starts. When extra gaslift m<strong>and</strong>rels are used, dummy gas lift valves are inserted when the string is run to stop unnecessarygas loss. The dummy valves can be replaced with operating valves by a slick line unit without pullingthe well. Because the valves can be easily replaced at low expense, gas lift systems are usually economical.The major operational expense is obtaining gas <strong>and</strong> the cost of gas compression. <strong>Gas</strong> lift islimited by the availability of injection gas, the available gas pressure, <strong>and</strong> the depth <strong>and</strong> pressure ofthe well to be lifted. <strong>Gas</strong> lift is very useful in producing silt <strong>and</strong> solids-laden fluids since there are fewmoving parts where the solids could cause blockages or abrasion.Electrical Submersible PumpElectric Submersible Pumps, ESPs, are downhole pump units that are capable of lifting very largequantities of fluids.2213740 The units, Figure 7.18, are composed of motor, pump, <strong>and</strong> various supportcomponent^.^^ The motor is electric <strong>and</strong> is fed through armor shielded cable attached to the outside ofthe tubing.41 The units operate at a design capacity Figure 7.19, <strong>and</strong> efficiency falls off rapidly if theoperation is moved out of the recommended range. ESP applications are increasing because of theireconomic fluid h<strong>and</strong>ling capacity. They are limited by high well temperature, solids, gas, <strong>and</strong> smallcasingESPs cannot h<strong>and</strong>le solids laden fluids in most cases <strong>and</strong> particularly when operationis intermittent. <strong>Gas</strong> must be vented to maintain pump efficiencies.Other SystemsSpecial lift equipment has been developed for specific applications. Jet pumps, Figure 7.20,40p48149hydraulic lift, progressive cavity,50 plunger pump <strong>and</strong> other systems all have applications where operatingconditions <strong>and</strong> economics will favor their use.Lift SelectionBrown lists six economic factors involved in selection of an artificial lift system: Initial Capital Investment,Operating Expenses, Equipment Operating Life, Number of Wells, Availability, Well Life. The7-16
IIFigure7.19:(Jambs, SPE, 1989)An example of an ESP performance curveshowing optimum range.impact of fluid type, solids content, gas <strong>and</strong> liquid viscosities on the operating expense <strong>and</strong> equipmentlife usually dictate the types of lift systems that can be considered.Although a complete h<strong>and</strong>ling of artificial lift design will not be covered here, examples from Brown, inAppendix 7.A, will illustrate some of the considerations <strong>and</strong> choices for lift design.13Reservoir Fluid ClassificationHydrocarbon classification is divided into liquid <strong>and</strong> gas with sub-classification to fit the needs of thesituation. Liquids are usually black oils or volatile oils <strong>and</strong> gas wells are gas or gas-condensate. Thedifference between volatile oils <strong>and</strong> gas-condensate is defined by the relative amounts of liquids <strong>and</strong>gases.7-17
(Jacobs, SPE, 1989)Figure 7.20: Schematic of jet pump operation.Gilchrist <strong>and</strong> Adams refer to black oils as having gas-oil-ratios (GORs) of less than 2000 scf/bbl, APIgravities of 45” or less <strong>and</strong> formation volume factors (FVF) of less than 2 bbl/bbl. Volatile oils haveGORs from 2000 to 3000, gravities of 40” or higher (note the overlap) <strong>and</strong> FVF above 2 bbl/bbl. Thedifference between the volatile oils <strong>and</strong> the gas-condensate can be seen on the phase diagram. Theterm “near-critical” is applied to oils between the established phase areas.(Gilchrist 8. Adams, PEI, July 1993)Figure 7.21: A phase diagram of a liquid gas composition. The fluidsin the middle are near critical oil that are very close tobeing gas-condensates.<strong>Gas</strong>es may be retrograde or gas-condensate, wet gas or dry gas. Retrograde refers to a gas (at reservoirconditions) that releases liquids as it drops below critical conditions due to production effects. If7-18
the liquids drop out in pore space that only contained gas or gas <strong>and</strong> water, then the hydrocarbon liquidbecomes a third phase, reducing permeability to gas. <strong>Gas</strong>-condensates have GORs from 3000 to150,000 scf/bbl <strong>and</strong> API liquid gravities from 40” to 60”. The difference in wet-gas <strong>and</strong> gas-condensateis where they drop the liquids: wet gas drops liquids at the surface; dry gas does not drop liquids.Sampling wells for pressure-volume-temperature (PVT) tests is essential for proper well classification.The producing GOR must be stable <strong>and</strong> the sample should be taken as close as possible to the minimumGOR.The information available from the PVT test includes bubble point (gas breakout in an undersaturatedoil), dew point (liquid dropout from a gas), gas composition at various pressures (important in depletion),formation volume factor, condensed liquid rates, retrograde information <strong>and</strong> several other piecesof information.<strong>References</strong>1, Gilbert, W. E.: “Flowing <strong>and</strong> <strong>Gas</strong> Lift Well Performance,” API, Pacific Coast Meeting, Los Angeles,(May 1954).2. Vogel, J. V.: “Inflow Performance Relationships for Solution-<strong>Gas</strong> Drive Wells,” JPT, (Jan. 1968),pp. 83-92.3. Buhidma, I . M.: “Inflow Performance Relationship Prediction,” Southwest <strong>Petroleum</strong> ShortCourse, Lubbock, April 1989.4. Kimmel, J. W.: “Larger ID Tubulars Boost Deep <strong>Gas</strong> Well Production,” Pet. Eng. Prod. Eng.,1978.5. Patton, L. D., Abbott, W. A.: “Well Performance: The Effect of Inflow <strong>and</strong> Outflow PerformanceFactors,” Pet. Eng. Intl., (April 1981), pp. 58, 62, 64, 67, 70.6. Duggan, J. 0.: “Estimating Flow Rate Required to Keep <strong>Gas</strong> Wells Unloaded,” J. Pet. Tech.,(Dec. 1961), p. 1173.7. Turner, R. G., Hubbard, M. G., Duckler, A. E.: “Analysis <strong>and</strong> Prediction of Minimum Flow Rate forContinuous Removal of Liquids from <strong>Gas</strong> Wells,” J. Pet. Tech., (Nov. 1969), p. 1175.8. Brown, K. E.: “The Technology of Artificial Lift Methods,” PennWelI Books, (1980), 3A & 3B.9. Patton, L. D., Abbott, W. A.: “The Well Outflow System: Tubing Performance,” Pet. Eng. Int.,(March 1981), pp. 96, 96, 103, 106, 11 2.10. Torre, A. J., Schmidt, Z., Blais, R. N., Doty, D. R., Brill, J. P.: “Casing Heading in Flowing <strong>Oil</strong>Wells,” SPE Prod. Eng., (Nov. 1987), pp. 297-304.11. Brown, Kermit E. <strong>and</strong> Lea, James F.: “Nodal Systems Analysis of <strong>Oil</strong> <strong>and</strong> <strong>Gas</strong> Wells,” Journal of<strong>Petroleum</strong> Technology, (October 1985), pp. 1751 -1 763.12. Brown, K. E.: “The Technology of Artificial Lift Methods,” Vol. 1-3, PennWell Books, Tulsa, OK,1979.13. Brown, K. E.: “Overview of Artificial Lift Systems,” SPE 9979, Int. Pet. Exhib. <strong>and</strong> Tech. Symp.,Beijing, March 18-26, 1982.7-19
14.Brown, K. E., et al.: “The Technology of Artificial Lift Methods,” Vol. 11-B, PenWell Books, Tulsa,OK, 1979.15.16.17.18.19.20.21.22.23.24.25.26.27.28.29.30.31.Greene, William R.: “Analyzing the Performance of <strong>Gas</strong> Wells,” Journal of <strong>Petroleum</strong> Technology,(July 1983), pp. 1378-1384.Vogel, J. M.: “Inflow Performance Relationships for Solution <strong>Gas</strong> Drive Reservoirs,” J. Pet.Tech., (Jan. 68), p. 83.Gibbs, S. G.: “A Review of Methods for Design <strong>and</strong> Analysis of Rod Pumping Installations,” J.Pet. Tech, (Dec. 1982) 2931-39.Gipson, F. W. <strong>and</strong> Swaim, H. W.: “The Beam Pumping Design Chain,” Southwestern <strong>Petroleum</strong>Short Course, (1984), pp. 296-376.Neely, A. Buford <strong>and</strong> Tolbert, H. 0.: “Experience With Pumpoff Control in the Permian Basin,”Journal of <strong>Petroleum</strong> Technology, (May 1988), pp. 645-650.Schmidt, Z. <strong>and</strong> Doty, D. R.: “System Analysis for Sucker-Rod Pumping,” SPE Production <strong>Engineering</strong>,(May 1989), pp. 125-1 30.Gibbs, S. G.: “Computing Gearbox Torque <strong>and</strong> Motor Loading For Beam Pumping Units WithConsideration of Inertia Effects,” Journal of <strong>Petroleum</strong> Technology, (September 1975), pp. 11 53-1159.Clegg, Joe Dunn: “High-Rate Artificial Lift,” Journal of <strong>Petroleum</strong> Technology, (March 1988),pp. 277-282.Pellegrino, V. L. <strong>and</strong> Scott, G. T.: “<strong>Oil</strong>field Power: Technology <strong>and</strong> Cost Control,” Journal of<strong>Petroleum</strong> Technology, (April 1989), pp. 389-394.Kelley, Howard L.: “<strong>Engineering</strong> Artificial Lift Equipment to Produce <strong>Gas</strong>eous Fluids,” pp. 143-152.Stein, N., Elfrink, E. B., Wiener, L. D. <strong>and</strong> S<strong>and</strong>berg, C. R.: “The Slip Velocity of <strong>Gas</strong>es RisingThrough Liquid Columns,” <strong>Petroleum</strong> Transactions, AIME, Vol. 195, (1 952), pp. 233-236.Clegg, Joe D.: “Reducing <strong>Gas</strong> Interference in Rod Pumped Wells,” World <strong>Oil</strong>, (June 1979),pp. 125-129.Nolen, K. B. <strong>and</strong> Gibbs, S. G.: “Quantitative Determination of Rod Pump Leakage Using DynamometerTechniques,” SPE 181 85, (1 988), pp. 45-55.Gault, Robert H.: “Designing a Sucker-Rod Pumping System for Maximum Efficiency,” SPE Production<strong>Engineering</strong>, (November 1987), pp. 284-296.Clegg, J. D.: “Underst<strong>and</strong>ing <strong>and</strong> Combating <strong>Gas</strong> Interference in Pumping Wells,” World <strong>Oil</strong>,(May 1963), pp. 107-112.Pickford, K. H. <strong>and</strong> Morris, B. J.: “Hydraulic Rod Pumping Units in Offshore Artificial Lift Applications,”SPE 16922, (1987), pp. 431-436.Svinos, J. G.: “Use of Downhole Pulsation Dampener to Eliminate the Effect of Fluid Inertia on aRod Pump System,” SPE 18779, Calif. Regional Mtg., Bakersfield, April 5-7, 1989.7-20
32. Neeley <strong>and</strong> Tolbert33. API Spec. 11 AX: “API Specifications for Subsurface Sucker Rod Pumps <strong>and</strong> Fittings, SeventhEdition, June 1979.34. Coltharp, E. D.: “Subsurface Electrical Centrifugal Pumps,” J. Pet. Tech. (April 1984), 645-652.35. Gault, R. H.: “Designing a Sucker-Rod Pumping System for Maximum Efficiency,” SPE Prod.Eng. (Nov. 1987), 284-296.36. Cameron, M. Liang: “<strong>Gas</strong>-Lift Design <strong>and</strong> Production Optimization Offshore Trinidad,” SPE Production<strong>Engineering</strong>, (May 1989), pp. 135-1 42.37. Hoestenbach, R. D.: “Large-Volume, High-Horsepower Submersible Pumping Problems in WaterSource Wells,” J. Pet. Tech., (Oct 1982), pp. 2397-2402.38. Wilson, Brown L.: “Program Sizes Electrical Submersible Pumps,” <strong>Oil</strong> <strong>and</strong> <strong>Gas</strong> Journal, (August1989), pp. 68-70.39. Nolen, K. B. <strong>and</strong> Gibbs, S. G.: “Analysis of Electric-Submersible- Pumping Systems,” SPE Production<strong>Engineering</strong>, (May 1989), pp. 121-124.40. Jacobs, E. G.: “Artificial Lift in the Montrose Field, North Sea,” SPE Production <strong>Engineering</strong>,(August 1989), pp. 31 3-320.41. Neuroth, D. H.: “Design Features of Improved Electric-Submersible-Pump Cable To Withst<strong>and</strong>Installation <strong>and</strong> Service Conditions,” SPE Production <strong>Engineering</strong>, (February 1989), pp. 83-92.42. Lea, James F. <strong>and</strong> Bearden, J. L.: “Effect of <strong>Gas</strong>eous Fluids on Submersible Pump Performance,”Journal of <strong>Petroleum</strong> Technology, (1 982), pp. 2922-2930.43. Lea, James F. <strong>and</strong> Bearden, John L.: “<strong>Gas</strong> Separator Performance for Submersible Pump Operation,”Journal of <strong>Petroleum</strong> Technology, (1982), pp. 1327-1 333.44. Jacobs, Gary H.: “ESP/Rotary <strong>Gas</strong> Separator Duo Found to Optimize Production,” World <strong>Oil</strong>,(November 1986), pp. 55-58.45. Neely, A. B. <strong>and</strong> Patterson, M. M.: “Soft Start of Submersible Pumped <strong>Oil</strong> Wells,” Journal of<strong>Petroleum</strong> Technology, (1984), pp. 653 & 656.46. O’Toole, W. P. <strong>and</strong> O’Brien, J. B.: “Testing New Submersible Pumps for Proper Sizing <strong>and</strong>Reduced Costs,” Journal of <strong>Petroleum</strong> Technology, (February 1989), pp. 159-1 64.47. Bailey, Martin C. <strong>and</strong> Bearden, John: “ESP - The Electrical Submersible Pump,” Part 2 - OperatingRanges <strong>and</strong> Limits of the ESP System, <strong>Petroleum</strong> Engineer International, (September 1982),pp. 128-132.48. Grupping, A. W., Coppes, J. L. R. <strong>and</strong> Groot, J. G.: “Fundamentals of <strong>Oil</strong>well Jet Pumping,” SPEProduction <strong>Engineering</strong>, (February 1988), pp. 9-1 4.49. Christ, F. C. <strong>and</strong> Petrie, H. L.: “Obtaining Low Bottomhole Pressures in Deep Wells With HydraulicJet Pumps,” SPE Production <strong>Engineering</strong>, (August 1989), pp. 290-294.7-21
50. Saveth, K. J., Klein, S. T. <strong>and</strong> Fisher, K. B.: “A Comparative Analysis of Efficiency <strong>and</strong> HorsepowerBetween Progressing Cavity Pumps <strong>and</strong> Plunger Pumps,” SPE 161 94, (1987), pp. 87-92.51. Gilchrist, R.E., Adams, J. E.: “How to Best Utilize PVT Reports,” P.E.I., July 1993, pp. 38-41.7-22
Appendix 7.A (from Brown)Given Data:Depth8000 ft (2438.40 m)G/OWater ProductionRateAPITubing size(All power sources available)P = 2300 psia (15.86 MPa)PI = 3 (0.07 m3/d-KPa) until reaching Pb = 1600 psi (11.03 MPa)Pwh = 100 psia (0.69 MPa) (Wellhead flowing pressure)Casing Size= 7 in. (17.79 cm)For the above problem, the best type lift is to be selected. The information in the general problem isused <strong>and</strong> changes are made in each example to alter the possible lift choice with all else remainingconstant.KmolGiL 3000 SCF/B ( 22.553 PI = 0.01'm(2.31 'E-04 dd-KPa)1.qL = 20 b/d (3.10 m3/d)The first choice should be intermittent gas lift or plunger lift. Beam pumping or hydraulic pumping maybe considered if proper gas venting can be accomplished. Sufficient gas is available to run a plunger.2.Depth 12000 ft (3657.6 m)P/ = 0.1 (2.31 E-03 m3/d-Kpa)qL = 200b/d (31.80 rn3/d)m3/d-KPaThe hydraulic piston with venting should be considered due to great depth.Rate = 6OOOB/D( 953.92$)PI = 10 (0.23 m3/d-KP)3. Tubing 4 in. (10.16 cm)The choice would be continuous flow gas lift or electrical pump. Since 6000 B/D (953.92 m3/d) with aPI of 10 (0.23 m3/d-KPa) only requires a flowing pressure of 1700 psi (1 1.72 MPa), it is still above thebubble point <strong>and</strong> no free gas is pumped if the pump is set on bottom. Setting the pump higher up inthe hole would induce gas liberation <strong>and</strong> a means of venting would be required. Jet pumping may alsobe considered. After a few considerations:4. Severe H2S problem: <strong>Gas</strong> lift is the only lift method where the well fluids do not pass through thelift mechanism. Electrical submersible <strong>and</strong> hydraulic may be considered.7.A-23
Depth 3000 ft (914.40 m)Rate - 400 b/d (63.59 m3d)PR = 1200 psia (8.27 MPa)5. PI = 1.0 (2.306 m3/d-KPa)This is a good choice for beam pumping due to shallow depth <strong>and</strong> a rate of 400 B/D (63.59 m3/d)6. No engineering supervision available: Beam pumping is the most understood method by mostfield operators, with continuous flow gas lift also a good choice.7. Well produces s<strong>and</strong>: With bad s<strong>and</strong> production, the choice would be continuous flow gas lift.8. Bad paraffin problems: All methods can be considered but paraffin removal must be kept inmind. Rod pumping is probably the best choice.Depth = 6000 ft (1828.8 m)Rate - 10, 000 b/d (1589.98 m3/d)2-7/8 X 7" annular flow (7.30 - 17.78 cm)9. PI = 25 (0.58 m3/d-KPa)Continuous gas flow lift is a good choice with electrical submersibl<strong>and</strong> jet pump as alternateRate = 25, 000 b/d (3.974.68 m3 )9-5/8" casing - 4" tubing (24.45 cm casing)10. PI = 25 (0.58 m3/d-KPa)Continuous gas flow lift or electrical submersible pump.PR drops to 300 psi (2.07 MPa)PI = 0.02 (4.61 E-04 m3/d-KPa)11. Rate = maximum possibleBeam pumping or hydraulic pumping.100% oilG/O = 4OOO Scfibl(30.07 Kmol/m3 )PR = 500 psia (3.45 MPa)PI = 0.02 (4.61 E-04 m3/d-KPa)12. Rate = maximum possible7.A-24
Plunger lift due to the high <strong>Gas</strong> <strong>Oil</strong> ratio or beam pumping with adequate venting.Long 300 ft (9 1.44 m) perforated intervalPR = 500 psia (3.45 Wa)1 3.PI = 2 (0.05 m3/d-KPa)Rate = maximum possibleThis is a good c<strong>and</strong>idate for chamber intermittent gas lift.Open hole completion (400 ft) (121.92 m)?'R = 700 psia (4.83 Mpa)PI = 1.0 (2.306 m3/d-KPa)14. Rate = maximum possibleThis is a good c<strong>and</strong>idate for an insert chamber type intermittent gas lift.Example #21. Offshore Well8000 ft (2438.40 m) high productivity, high static pressure, low solution. GOR (1 50 scf/B)(1.13 Kmol/m3) with bubble point at 350 psi (2.41 MPa). Desired rate of 10,000 B/D (1589.87 m3/d)can be obtained with a flowing pressure of 1500 psi (1 0.34 MPa).Selection ChoiceElectrical submersible pump since no free gas will be pumped <strong>and</strong> a rate 3 m of 10,000 B/D3(1589.87 ) can only be obtained with either continuous flow gas lift or electrical pump. The very'dlow GOR of 150 ScWB (1.13 Kmol/m3) makes the electrical pump more attractive. <strong>Gas</strong> lift runs a closefirst choice due to better retrievable reliability.(b) Same well as Example (a) except a GOR of 800 ScflB (6.01 Kmol/m3) exists with a bubble point of1500 psi (1 0.34 MPa).Selection ChoiceContinuous flow gas lift is a better choice since free gas exists at the required flowing bottomholepressure. Being an offshore well, the retrievable equipment is again very attractive <strong>and</strong> the fact thatthe electrical pump will need to h<strong>and</strong>le some gas reduces its liquid h<strong>and</strong>ling capability.Example #32. L<strong>and</strong> WellDepth= 8000 ft (2438.40 m)\1.A-25
Static pressure= 1920 (13.24 MPa)PI = 5 (0.12 m3/d-KPa)Bubble point pressure= 1500 pis (10.34 MPa)<strong>Gas</strong> <strong>Oil</strong> ratio= 400 ScWB (3.01 Kmol/m3)Well produces 50% water2-7/8" O.D. x 2.441" I.D. tubing x 7'' casing.(7.30 cm O.D. x 6.20 cm I.D. tubing x 17.78 cm casing).This well was analyzed for rates possible <strong>and</strong> found to produce as follows:1. Electrical submersible pump - 4500 BID (715.44 m3/d).(Assumes no pump inefficiency due to h<strong>and</strong>ling some free gas).2. Continuous flow gas lift with a surface injection pressure of 1500 psi (10.34 MPa), 1750 B/D(278.23 m3/d).3. Beam pumping with a 640 unit - 1750 B/D (278.23 m3/d).4. Hydraulic pumping with a large pump - 1750 B/D (278.23 m3/d).5. Jet pumping with the assumption of h<strong>and</strong>ling no free gas - 2750 B/D (437.22 m3/d).It was also noted that approximately 4000 BID (635.95 m3/d) could be made by continuous flow gaslift if a change was made to 4-1/2" (1 1.43 cm) O.D. tubing. Lower increases were noted for all pumpingsystems although less horsepower is required for the larger tubing size. Final selection would dependupon the objective flow rate (whether maximum or less) <strong>and</strong> economics.Example #4 (see Reference 2)Pr = 1500 psi (10.34 MPa)Depth = 7600 ft (2316.48 m)Bubble point pressure = 1500 psi (1 0.34 MPa)Maximum flow rate for zero flowing bottomhole pressure is 215 B/D (34.18 m3/d)GOR = Scf/BThis well was analyzed for rate with the following results:1. Beam pumping - 200 B/D (31.80 m3/d)2. Hydraulic pumping - 200 B/D (31.80 m3/d)3. Jet pumping - 165 B/D (26.23 m3/d)4. Continuous Flow <strong>Gas</strong> Lift - 165 B/D (26.23 m3/d).5. Intermittent Flow <strong>Gas</strong> Lift with a chamber installation - 190 B/D (30.21 m3/d).6. Electrical Submersible Pumping - 200 B/D (31.80 m3/d).7.A-26
The logical choice on this well is beam pumping or hydraulic pumping if adequate venting can beaccomplished. The electrical pump requires too many stages to h<strong>and</strong>le the gas <strong>and</strong> loses efficiency.If gas venting cannot be properly h<strong>and</strong>led, then a chamber intermittent gas lift installation would be agood selection. The option of running a plunger in conjunction with a chamber would be anotherchoice, but should increase efficiency.7.A-27
Chapter 8: Special Completions (Deviated, ThermalMultiples, <strong>and</strong> Multi-Laterals)Deviated CompletionsCompletions in deviated wellbores were traditionally viewed as necessary in many cases where thesurface area for locating wellheads was expensive or the terrain would not allow a vertical well. Inmost cases, this occurs in mountainous country, offshore platforms, or environmentally sensitiveareas. The primary objective was the increased area of the reservoir available from a single location.In the past several years, however, the objective has shifted to a renewed interest in using highly deviated<strong>and</strong> even horizontal holes to augment production in specific reservoirs over that which is availablefrom a vertical well. The horizontal holes or drain holes, as they were referred to during the1940's, 50's <strong>and</strong> 603, were of interest as early as 1930, although only a few highly deviated experimentalattempts were made until the 1970's. The original work on highly deviated <strong>and</strong> horizontal holesis in dispute, but it appears that many engineers from Russia, the U.S., Canada <strong>and</strong> France providedsignificant parts of the early work. The horizontal well concept has evolved considerably in design <strong>and</strong>application over the early ideas to a technique that offers benefits in many applications. Change in theindustry's acceptance of the horizontal hole is the result of numerous improvements in the drilling <strong>and</strong>completionDescriptionsHorizontal well^*^^ may be established with normally used drilling equipment <strong>and</strong> results in eithera single stage step out to form a short radius (Figure 8.1) or a two-stage step out which may result ina highly deviated portion <strong>and</strong> a long horizontal portion, of 4000 ft or more.'* The short radius lateraldrilling technique is usually attained with a whipstock <strong>and</strong> builds hole angle at the rate of 1.5" to 3" perfoot. The long reach, conventional directional drilling builds hole angle at a maximum of about 0.1 O perfoot.1E. 2-80c 3-Ik 4-w0 5-TYPICAL WELLBOREPROFlLESTwo-Build Profile$2 6-82 7-3E *-9-Single Build Rofile ForShort Departure WellsFigure 8.1:0 1 2 3 4 5 6DEPARTURE (1000 FT)(Reiley, SPE 16682)Examples of drilling angles commonlyused for horizontal wells.8-1
Horizontal Well C<strong>and</strong>idate SelectionMany of the “problems” encountered in horizontal wells are the result of normal reservoir performance.Not every formation is a c<strong>and</strong>idate for a horizontal well. The first consideration in planning a horizontalwell <strong>and</strong> the first determination in trying to make a horizontal well flow better are the same: check thevertical permeability <strong>and</strong> see if it is an impediment to flow. The following few paragraphs may seemlike extremely simple reservoir engineering; they are. Unfortunately, they are frequently ignored asengineers rush ahead to get involved with the “romance” of a horizontal well.Permeability in a formation can vary widely with the direction of flow. The permeability is influenced byfactors including the depositional environment, sediment size <strong>and</strong> sorting, bedding planes, fractures,geochemical reactions, <strong>and</strong> sediment reworking. The major permeability directions, shown inFigure 8.2, are vertical, horizontal (usually at a maximum) <strong>and</strong> horizontal perm at 90” to the maximumhorizontal perm.Figure 8.2The flow patterns in a well are controlled by how it intersects the three functional permeabilities. Permeabilityin an unfractured formation is usually highest along a horizontal direction <strong>and</strong> usually variesvery little at 90” to the maximum. These two horizontal flow values control fluid entry into a verticalwell as shown in Figure 8.3.KVKubso.1 1ntKVHorizontal WellboretKHgg.Vertical WellboreFigure 8.3The vertical permeability has little influence in continuous formations intersected by vertical wellbores<strong>and</strong> completed over the whole interval. However, in a horizontal wellbore, only 60% to 80% of the wellboreis connected to horizontal permeability. The top <strong>and</strong> bottom of the well (in a formation without significantinclination) are fed in some part by the vertical permeability. Vertical permeabilities may rangefrom being more or the same as horizontal permeability in very rare cases to values as small as 10%8-2
or less of horizontal perm in more typical formations containing pronounced bedding planes. Theworst comparisons are encountered in laminated formations. Regardless of the cause, if vertical permeabilityis low, the formation is not a good c<strong>and</strong>idate for a horizontal well with a natural completion.Horizontal wells may still be used in these cases, but stimulation is required to improve vertical contact.Although the contact of the wellbore with vertical permeability can appear to influence flow, it is theformation drainage patterns created by the permeability difference or anisotropy that may create seriousproblems. By relating the vertical <strong>and</strong> horizontal permeabilities in a ratio, the drainage patternsbegin to become clear. In Figure 8.4, the drainage area is sketched for three examples; Kv/KH = 0.1,KV/KH = 1 <strong>and</strong> Kv/KH = 2.Figure 8.4The Kv/KH of 0.1 (horizontal perm ten times vertical) is typical for many formations. As shown in theschematic, this type of drainage would only account for less than one-half of what might be expectedif Kv/KH = 1. Confirmation of this simple analysis can be obtained by drainage plots in the literature(Figure 8.5)..z 4 -z' - 1 I 1-1R.s.rv011 helphi . loo 11 (00.48mI- . n.,itm-i draiwss areavarlleal rdl dralnage nIem. 00 .C.S tlr.l4rormq0 -a -f -l-I I I I ' 1 I I I I I0'o loo zoo aoo 400 so0 moo 100 moo BOO 1000 1100 (zooIFigure 8.5(SPE 15375 -Joshi)The purpose of this excursion into basic reservoir engineering is simple; a horizontal well, like a verticalwell, is confined by its own set of reservoir factors.Horizontal Completions BackgroundThe horizontal well has an immense amount of potential <strong>and</strong> a number of significant problems whichhave been addressed in a variety of interesting ways. Fluid entry control, fluid exit control, <strong>and</strong> the sta-8-3
ility of the wellbore as a system have all been challenged by the various reservoir properties. Thereare no horizontal wellbore problems that are significantly different from those in vertical wellbores.However, the orientation of the wellbore often makes h<strong>and</strong>ling of even minor problems considerablymore difficult. These areas are highlighted in the following general topics.One of the first problems encountered when turning the well horizontal as a recompletion or as a newwell was sealing off the upper zones in the bend area where milling <strong>and</strong> angle drilling were prevalent.Many early horizontal wells were plagued by gas <strong>and</strong> less often water leaking through poor primarycement jobs from upper zones. Since the wellbore turned horizontal, it became a collection point, <strong>and</strong>this fluid migration down the annulus interfered with fluid feed-in <strong>and</strong> with operation of pumps or otherequipment. The accepted prevention quickly became the external casing packers, ECP, cementsqueezes <strong>and</strong> in some cases, a decision to simply live with the problem. As diagnostic techniqueshave been applied <strong>and</strong> the sources of water were determined, routine gel squeezes or polymersqueezes have become more common. The introduction of the isolation packer on coiled tubing hashelped this treatment tremendously. With these devices, the source of water can often be located aswell as a remedial treatment pumped back in an attempt to shut off the water or gas. It is feasible thatin severe cases, mechanical repair using scab liners of the same type used in vertical wells may alsobe beneficial. Because of the clearance <strong>and</strong> the bend in the location, liner design will be a challenge.The shape of the hole through this turnout area is a problem for more than just setting liners. Horizontalholes may be drilled in a number of ways from ultrashort radius to long radius. The hole shapeproblems in the turnout area are more common with short <strong>and</strong> ultrashort turnout where a horizontalwell has been recompleted from an older vertical well. In this operation, a window is generally milledor a section is milled out. After setting a whip stock, drilling commences, an angle is built through thearea with typical ultrashort radiuses of 6 to 20 ft <strong>and</strong> short radiuses of 50 or 60 ft. Smooth departuresfrom holes are needed in order to insert too! strings or simple equipment. When the departure areacontains a dogleg from a missed drilling run or a combination angle which turns down <strong>and</strong> sideways atthe same time, tool passage becomes very difficult. There have been few workable methods to try toaccomplish completions in these particular wells. Better drilling practices were suggested in futurewells <strong>and</strong> in wells that already have deviation or shape problems in the departure area. Logging toolswith knuckle joints are being constructed. These tools with universal joints or flexible joints in the middleare targeted first at the ultrashort radius turnouts such as those developed by Amoco on their wigglyjoint drilling technology.The next challenge in the near wellbore area is a loss of hole drilling mud to natural fracture systems.Horizontal wells depend on vertical permeability through the matrix or through natural fracture systemsto effectively drain the reservoir. The problems with crossing these natural fractures is the loss ofmud in conventional drilling. In many cases, mud losses to the natural fracture systems have been sosevere that the well has never produced as expected after completion. The accepted st<strong>and</strong>ard mudloss control has been the typical lost circulation materials, LCM. These materials have few solvents<strong>and</strong> are extremely difficult to remove from the formation. In most cases, they should be avoided. In afew places, companies have experimented with drilling underbalanced or drilling with no returns. Inthe Piersal Chalk Field, one company continues to drill without returns or while the well is flowingusing a diverter system to divert all fluids away from the rig at the surface. The technique is tricky atbest, <strong>and</strong> some companies have lost rigs due to fires. One success story in the chalk involved a wellproducing over 20,000 barrels of crude oil during the drilling phase. In this unusual case, the well waspaid for before drilling was completed.Other ways of achieving mudcake breakup <strong>and</strong> removal has centered on solvents <strong>and</strong> surfactant(soap) systems. Use of explosives <strong>and</strong> openhole perforating are seen as a method of bypassing theformation damage. Fluid damage bypass is possible if the damage in the crack does not extend toofar. However, connection with the natural fracture system is usually m<strong>and</strong>atory in these wells. Solventsfor muds depend on the mud composition. <strong>Oil</strong>-based muds have been effectively removed witheither xylene or cosolvent washes <strong>and</strong> a few surfactant packages. The problems with surfactant packagesare that they are very mud specific <strong>and</strong> may not be effective over a wide range of mud types.Xylene or cosolvents are more expensive or more difficult to use but apply over a wider range of materials.Water based muds are typically removed by soaps, acids or nitrified washes. The problem isremoving deep formation damage.8-4
Bypassing the damage with explosives or openhole perforating depends on how shallow the formationdamage occurs. Explosives which have been used for both damage bypass <strong>and</strong> initial stimulation maybe effective if the explosive stimulation is designed to utilize the benefit of a crack driving gas generatoras opposed to a shattering force from a high explosive. Openhole perforating has been used in afew places to try to bypass very shallow damage. The 6 to 10 in. penetration which is typical from aperforating charge is usually not adequate to bypass deep mud filtrate damage.Cuttings <strong>and</strong> fill collection continues to be a problem, although significant headway has been made incleaning horizontal holes. When holes are not cleaned, the cuttings <strong>and</strong> formation drilling mud contributesto plugs in liners <strong>and</strong> screens. It limits the cement contact <strong>and</strong> provides small particles that mayinduce emulsions. The accepted practice in this area has been to sweep with viscous fluids <strong>and</strong>flushes. However, reverse circulating on tubing or using a liner with removable aluminum plugs <strong>and</strong>reverse circulating it into place may be advantageous for removing large amounts of these cuttings.Filtrate leakoff is found in all wells. The only thing it requires is a liquid, pressure toward the formation<strong>and</strong> permeability. Even in a well formulated drilling mud, to form a filtercake, you must have fluid invasion.The potential to cause clay damage, water blocks, emulsions or other problems from the drillingfluid filtrate is related to the sensitivity of the formation to the particular drilling fluid <strong>and</strong> to the amountof the drilling fluid. Removal attempts for filtrate <strong>and</strong> the associated mud cake in vertical wells has typicallybeen by backflow or small acid washes. In horizontal wells, the problems involved are lowerdrawdown unit of area, longer mud exposure time <strong>and</strong> typically, less acid volume for cleanup. Thisforces the operator to look at fluids with very low fluid loss <strong>and</strong> those materials that can come off theformation much easier. Mechanical methods such as water blasting or solvent washing are also beingevaluated.Many horizontal wells have suffered poorer than anticipated production at least partly due to the presenceof a fluid column between the horizontal extension <strong>and</strong> the bottom of the pump (Figure 8.6). Thehydrostatic gradient from such a fluid level is rarely severe, ranging from 0.46 to 0.36 psi backpressurefor every foot of st<strong>and</strong>ing fluid, but it adds to the resistance to flow. The worst influence of thest<strong>and</strong>ing fluid column is in gas wells. Because gas has low viscosity, it does not serve as a good displacementfluid at low flow rates. This means that the gas will often slug through the wellbore or tricklethrough the water in the pores, never completely unloading the pore <strong>and</strong> driving the water saturationlow enough to raise the permeability to gas. In the final analysis, the pores remain flooded with water<strong>and</strong> hydrocarbon production that suffer.8Figure 8.6Any time water is st<strong>and</strong>ing in the well, heading can be a serious problem. Heading occurs when thegas flow velocity in a particular tubular or wellbore size is too low to carry the entrained liquids. Theliquid accumulates in the lowest point, holding a backpressure on the formation corresponding to liquiddensity <strong>and</strong> height of the liquid column above the formation. <strong>Gas</strong> movement through the wateroccurs in slugs as (1) the pressure builds up; (2) the gas unloads, often driving a slug of water aheadof it; (3) the pressure falls rapidly as gas escapes <strong>and</strong> most of the water drains back. The cyclic natureof the heading causes fluctuations of 50 to 300 psi or more in some wells. Since most lift systems aredesigned for continuous, steady operations, the slugging causes load imbalances or instabilities thatsharply lower lift efficiencies.8-5
Reducing the liquid buildup is usually accomplished by running tailpipe to a lower part of the well orusing smaller diameter tubulars in wells where the liquid dropout is occurring in the tubing. In nonflowingwells, the problem becomes more difficult since the lift system needs to be spotted at a low pointfor liquid unloading. The success of velocity strings or siphon strings, small tubing that more effectivelyuses gas energy to lift liquids, may be lower in highly deviated wells than in vertical wells. <strong>Gas</strong>flow along the top of the deviated tailpipe reduces lift efficiency.Methods to minimize the column buildup have centered on approaches that maximize drainage. Inshort radius turnout wells, the lift system can often be spotted in the old vertical hole below the turnoutor in a pilot hole, Figure 8.7. This reduces liquid buildup, but, because of the turnout radius, it does noteliminate the liquid in the horizontal wellbore. It is better suited to short radius wells.Figure 8.7The problem of a static fluid layer in the horizontal is a problem even in flowing wells. Anytime the flowrate from the well is not sufficient to create turbulence across the whole wellbore, liquids <strong>and</strong> solidsdrop out quickly <strong>and</strong> flow may only move in a portion of the wellbore, Figure 8.8, that is dependent onrate. The effect of the static liquid on the formation is dependent on liquid invasion of the formation,relative permeability <strong>and</strong> alternate flow paths. There is one clear conclusion, however: it cannot helpthe flow of gas. At minimum, the formation pores at the wellbore contact remain wetted with a high Sw<strong>and</strong> lower relative permeability to gas.A special case of problems in flow caused by liquids, <strong>and</strong> perhaps even gas, are illustrated inFigure 8.9.Figure 8.98-6
In this undulating lateral, a common design in several horizontal well paths, low places may act astraps for liquids or solids, holding backpressures. High points may even act as simple gas locks, addingseveral tens of psi backpressure. This type of wellpath cannot be kept adequately unloaded unlessthe flow rate is sufficient to remove all static liquids.Path of the Horizontal SectionSeveral industry horizontals have been drilled more as excursions <strong>and</strong> exploring attempts through thepay zone, resulting in the difficult-to-produce scenarios of Figure 8.9. Even in true horizontals, theproblem of solids <strong>and</strong> liquid entrapment can be severe. A vertical drop of only a few inches in slowmoving fluid in a horizontal wellbore is all that is needed to stratify the wellbore materials.In this description, proven out by testing in Dresser’s inclinable clear plastic flow loop in Houston, thefluids separate in the wellbore at any flow rate below full turbulence. The fastest moving <strong>and</strong> lightestfluids flow along the top of the wellbore. At the bend area, much of the liquids drop out or reflux backinto the horizontal. Solids, of course, quickly drop to the bottom of the hole. Solids buildup <strong>and</strong> cleaningin the horizontal has been the subject of many studies in the field of drilling. Cleaning solids fromthe well is difficult. Attempts have been made with viscous sweeps <strong>and</strong> even turbulent flow; all withonly minor success. In a set of experiments in a clear plastic horizontal well model, solids movementwas studied as part of work on horizontal well gravel packing. The gravel dropped out <strong>and</strong> built a runningdune as the solid/liquid slurry entered the horizontal section, filling the wellbore to a height controlledby the flow velocity of the carrier liquid. At low flow rates (low velocity), the open spacebetween the top of the dune <strong>and</strong> the top-inside of the casing was very small. The opening was largerwhen the flow velocity was higher. Increasing rate of liquid velocity would decrease the height of thedune (increase opening): the open area was a function of the flowing fluid velocity. In formations thatproduce significant solids, wellbore fill will build to a height controlled by the flow rate <strong>and</strong> hole size.As the solids level covers perforations on the bottom <strong>and</strong> sides of the hole, production may be lost orrestricted by flow through the solids.Attempts to combat the liquid unloading problem are focusing on better lift <strong>and</strong> forced drainage. Outlinedin the next several paragraphs are methods that have been tried to proposed to help drainage.Note that several of these methods are suitable only for a specific set of conditions.One approach is to use an “over horizontal’’ well of about 92O, Figure 8.1 0. The over horizontal wellboreinclination maximizes liquid draindown from the toe of the horizontal toward the heel. The problemof liquid cleanout from the heel is still there, but hopefully, improvements in lift may assist in thisarea; but if the gathered liquid in the heel cannot be produced, the liquid accumulation may accelerateheading problems.Figure 8.10Reversing the angle to 85 to 88” reverses the liquid collection point <strong>and</strong> may help minimize headingbut does nothing to assist fluid blockage removal or backpressure unless a lift system can be set intothe toe of the well.8-7
Another very unusual concept is in the planning stages as two operators in a West Texas field withhigh well density consider drilling an inclined wellbore from one existing well to the openhole pay zonesection of another well, Figure 8.11.Figure 8.11The pump could be spotted in the section of the target well below the intersection point to achieve liquidunloading. Hitting the target well will require the same gyro surveys used in drilling relief wells toblowouts.Artificial Lift OptionsThe following is a short description of several artificial lift methods that have been attempted or consideredfor horizontal wells. The aim is to present an overview only, more specialized help is necessaryfor optimum design <strong>and</strong> selection of a lift system.1. Beam Lift - Although popular for many low <strong>and</strong> moderate rate liquid production wells, beam lift islimited for horizontal wells since rod wear <strong>and</strong> load transfer restricts pump placement to the verticalsection of the well.2. ESP - Electrical Submersible Pumps will operate in any position, even fully horizontal, but solidsin the liquid can quickly burn out an ESP if they accumulate in the pump clearances. <strong>Gas</strong> separationmay also cause serious problems in ESPs set in the small clearance of a horizontal wellbore.3. <strong>Gas</strong> Lift - <strong>Gas</strong> lift, long a favorite lift mechanism for vertical wells with solids production, willoperate in any position but gas channeling will create same problems in a gas lift as it does innormal horizontal flow with the gas channeling along the top of the wellbore or tubing. Supplyinggas to the valves requires either dual strings or isolation in the wellbore.4. Jet Pump - The jet pump is one of the highest probability artificial lift mechanisms for horizontalwells; but like gas lift, jet pumps require a separate string for supply of power fluid. Installation ofa single string into the horizontal is often difficult, especially in an open hole. Installation of twoseparate strings is even more of a risk. One possible advance that may help is a jet pump on adouble string (concentric) coiled tubing. This is under test.5. Tail Pipe Extension - In some instances, extending the production tubing into the low spot in thehorizontal may improve liquid unloading. The correct sizing of tubing <strong>and</strong> selection of l<strong>and</strong>ingpoints is critical for some flowing horizontal wells.8-8
Solids Control TechniquesThe control of solids from any formation may require one of several available methods; each with itsown set of advantages <strong>and</strong> disadvantages. Methods of solids control are discussed here for the purposeof highlighting potential problems.1.2.3.4.Slotted Liners - Liners with slots from 0.020 in. (0.5 mm) to over 0.25 in. (6.4 mm) have beenused for both formation solids control <strong>and</strong> wellbore stability control. Sizing a slotted liner for formationparticle control is usually a very poor control method, useful in only a h<strong>and</strong>ful of formationswith large, consistent s<strong>and</strong> grain size (prevalent in California oilfields in the U.S.). Thescreen slot size is useful only if it is sized small enough to stop the s<strong>and</strong>. In most formations, thisrequired slot width would be much smaller than the 0.020 in. (0.5 rnm) slot size that is possible tocut with st<strong>and</strong>ard milling equipment. Slotted liners plug easily when the slot width is larger thanthe smallest formation particle. Wellbore stability control is usually involved with keeping a flowpathopen when operating in a formation that may spall large pieces of rock into the wellbore.For these applications, slots of 0.25 in. (6.4 mm) are usually adequate. Besides the formationparticle plugging problems, slotted liners have two other drawbacks; high friction losses fromflow through the slots <strong>and</strong> weakening of the pipe section. The friction loss depends on flow rate,fluid viscosity <strong>and</strong> amount of open slot area. Problems have been encountered with slot pluggingfrom asphaltene <strong>and</strong> paraffin in heavy (viscous) oil completions. The pipe strength reductionproblem was first documented in a series of tests that showed a loss of up to 50% of crushstrength when the pipe is rotated. The amount of loss depends on the slotting pattern.Perforated Liners - Liners drilled with up to 100 holes per foot (328 holes per meter) are morecommon than slotted liners. The perforated or predrilled liners have no potential for formationparticle control, but may be useful in cases of borehole stability where the fill is large particles.The rotational strength is good <strong>and</strong> lateral crush strength is usually very close to undrilled pipe(within 15%) if the liner separation (in the same longitudinal plane) of the holes is at least 3 in.(76 mm) between centers for 3/8 in. (9.5 mm) to 1/2 in. (12.7 mm) drilled holes. Specialty linerswith predrilled holes filled with acid dissolvable soft aluminum plugs are available when circulationis required during setting of the liners.Wirewrapped Screens - These screens are made by wrapping a keystone shaped wire aroundthe base pipe. The wrap design allows better control of formation s<strong>and</strong>s with available openingsdown to 0.002 in. Like most slotted or perforated pipe, the flexibility of screens to go through thebend area is very good, with little or no deformation in tests in a short radius horizontal well atthe Catoosa Test Facility. Rotational strength is not usually a problem since the perforated basepipe is relatively strong but the outside, wound screen can be damaged by impact or scraping.Prepacked Screens <strong>and</strong> Resin Coated S<strong>and</strong> Liners - These are specialty devices that aredesigned to stop formation particles. The resin coated s<strong>and</strong> (usually -40+60 mesh) that coversthe screen or is immediately behind the screen is an added barrier. Screen installation may bedone in any well, but is only practical where:a. the wellbore diameter can be preserved by gravel packing, orb. the formation permeability is more than about 1 darcy.The importance of having a high permeability layer (either gravel or a high permeability formations<strong>and</strong>) is apparent only when friction pressures <strong>and</strong> flow into a very small wellbore is comparedto that in a larger wellbore.I5.Gravel Packs - Screen <strong>and</strong> gravel packs are capable of efficiently producing even high rate formations.The main drawbacks to gravel packed completions are cost, difficulty of placement <strong>and</strong>partial obstruction of the wellbore.6.Resin consolidation is usually not a strong option in horizontal wells because of difficulties inapplying the process evenly over long sections.8-9
Gravel packs in deviated wellbores need very special design <strong>and</strong> equipment considerations toapproach complete fill up of the wellbore <strong>and</strong> coverage of the screen. Wellbore angle has a very dramaticeffect upon the placement of gravel. The normal mode of gravel placement in deviated wellboresare described by a number of authors <strong>and</strong> consists of the gravel forming a dune at the point ofentry into the wellbore with steady dune growth along the length of the assembly toward the bottom ofthe well. As fluid flows over the dune, the dune builds until it fills a sufficient amount of the wellbore sothat the remaining channel at the top of the wellbore is only large enough to channel the fluid flowwithout allowing gravel dropout or further dune building, Figure 8.21. If excessive leakoff occurs intothe screen through the gravel pack, bridges of gravel will form in the open channel, <strong>and</strong> the resultingblockage will stop the flow of the slurry.Most operators at the current time are packing deviated wellbores with water rather than gelled fluids.Model runs have highlighted leakoff as critical to insure movement of gravel to any area. Leakoff intothe formation <strong>and</strong> into the screen help in transport <strong>and</strong> packing.The mechanics of flow over the dune of gravel created in the inclined wellbore is a result of a state ofdynamic equilibrium between deposition <strong>and</strong> suspension of the gravel particles. The equilibrium velocityis the average slurry velocity required to transport the particles along the top of the equilibriumbank. This velocity is sufficient to prevent concentration of the gravel particles on the face of the dunebut does not direct gravel from the surface of the dune to the inside top surface of the pipe. In simplewords, the dune height (<strong>and</strong> the remaining distance to the upper pipe wall) depends on the velocity ofthe fluid: the faster the liquid moves, the more clearance is created between the top of the dune <strong>and</strong>the pipe. Higher injection rates create a short dune <strong>and</strong> a large open flow path <strong>and</strong> lower rates createa higher dune height.If a dune has been created <strong>and</strong> is at equilibrium with the flow rate, an increase in the flow rate will createa decrease in the height of the dune, <strong>and</strong> a new equilibrium will be established.When this pattern of flow is interrupted by losing fluid movement, the gravel is carried toward the lastavailable fluid loss area. As the liquid exits the wellbore at the leakoff area, the gravel that was beingcarried is str<strong>and</strong>ed at the surface (of the screen or the formation) <strong>and</strong> the gravel builds up, creating ablockage or a “bridge.” As soon as a bridge is created at any place in the wellbore, the liquid can travelno further than that bridge <strong>and</strong> the channel at the top of the screen begins filling back toward the “top”of the screen. After the gravel has filled the channel to the last place that liquid can leak off, the pressurewill rise dramatically because all liquid flow is being forced into linear darcy flow through thegravel in the wellbore toward the leakoff sites. The pressure rise is so severe that the job cannot usuallycontinue.Gravel coverage of the screen is necessary for the gravel pack to work correctly. At the point ofscreenout in vertical wells (different gravel transport than in deviated wells), the gravel remaining inthe pipe above the screen will fall by gravity onto the top of the gravel pack, adding to the total graveldepth over the screen. Even in wellbores of 45-75”, if sufficient gravel reserve exists above thescreen, the drop or slump of particles may be sufficient to fill up channels left at the top of the dune. Inwellbores over 75”, however, if the channels were not packed during the job, the channels will not befilled by falling gravel.FracturingThe considerations involved with horizontal hole stability <strong>and</strong> initiating a fracture in the deviated wellare closely related. In the deviated well, the well bore is not usually aligned with the plane of the fracture(assumed vertical). Even at deviations of a few degrees, the plane of a vertical fracture will crossthe axis of the hole on a slant <strong>and</strong> only a few perforations may be in contact with the fracture. This lackof fracture-to-well bore contact can create areas of restricted fluid entry <strong>and</strong> lead to stresses placedon the formation, by the high drawdown across a thin section of formation.Fracturing of the horizontal wellbores can improve the productivity over that claimed for the unfracturedwell, especially if long extensions of the horizontal well are used in massive productive sections.8-10
The productivity improvement available from fracturing the horizontal well will depend upon the orientationof the horizontal hole section in relation to the fracture direction in the reservoir. If the fractureorientation is along the same path as the horizontal hole, the improvement from fracturing will be smallexcept where vertical permeability is low or barriers are present. When the path of the horizontal holecrosses the plane of the fracture at some angle, more substantial productivities are sometimes available.The productivities increase as the angle of the intersection approaches 90".The occurrence <strong>and</strong> the direction of natural fractures in the formation may make be a critical differencein the decision of where to place the wellbore. For best hydraulic fracture separation <strong>and</strong> drainageon a non-naturally fractured formation, the fractures should be at 90" to the wellbore; thus thehole should be drilled in the direction of omjn because the hydraulic fractures would align in the directionof amin. However, in a naturally fractured formation, one of the biggest advantages of a horizontalwell is that it can be drilled across the plane of natural fractures, which are usually aligned alongomax. The hydraulic fractures, being also aligned along omm, may not intercept many natural fractures.In the unlikely event of natural fractures not being aligned along Q, the problem disappears.In cases where the natural fracture system is extensive <strong>and</strong> permeable, it is better to drain the naturalfracture system with the wellbore. Where the natural fracture system is small or of similar permeabilityto the matrix, a hole placement to favor the hydraulic fracture would be beneficial.Since an individual fracture at an angle of other than 0" cuts across the wellbore at only one locationin the horizontal example, the flow within the fracture near the wellbore is radial (Figure 8.19) <strong>and</strong>exhibits the converging flow associated with formation flow towards an unfractured vertical well. Thistype of restriction may appear as damage on very high rate wells. The restriction may be aggravatedby the bending of the fracture near the wellbore. Addition of perforations or slots (from abrasive methods)in the area of the fracture intersection may be beneficial but may not completely solve the problemwhen high flow rates are experienced. Multiple vertical fractures at regular spacing from ahorizontal well are envisioned as a method of dramatically increasing the processing of certain formationssuch as low pressure or high viscosity crude reservoirs. In one such example, Strubhar, etnote the placement <strong>and</strong> isolation testing of four fractures with 45 ft horizontal separation at the wellborefrom a 52" inclined hole drilled through the pay in a direction perpendicular to the known fractureorientation plane. In this test, vertical fractures were successfully placed in individual stimulationsthrough four separate groups of perforations. Pressure interference tests with special equipment wereused to show that no communication existed between the fractures in the propped areas. Proppedlength <strong>and</strong> height were estimated to be 200 ft <strong>and</strong> 100 ft, respectively. Operational problems of thefracture treatment were reported to be minor. Fracturing in highly-deviated or horizontal holes is predictedto be difficult owing to problems of hole cleaning, vertical proppant transport <strong>and</strong> accuratelyestimating pad <strong>and</strong> flush location.The connection of the hydraulic fracture from a horizontal well can be a problem. Fracture orientationmay be at some angle to the wellbore. When this occurs, the linear flow down the fracture is forced toturn radial to enter the formation. With this inward radial flow, pinch points <strong>and</strong> flow restrictions occur.Visually it would be better to intersect the wellbore along the wellbore length for a few feet at leastbefore the fracture turned <strong>and</strong> oriented into the plane of preference in the formation. Earlier workallowed perforation in a short interval with high density, however, later experiments seem to be focusingon perforating along the wellbore for several meters to maximize contact <strong>and</strong> breakdown of thefracture in the plane of perforations. This would increase wellbore contact even though it is known thatthe fracture will turn <strong>and</strong> follow a plane perpendicular to that of least principle stress as it leaves thehigh energy wellbore.Fracturing has been viewed as somewhere between the savior of failed horizontal wells <strong>and</strong> a necessaryevil in a few more. The elements of fracturing design that change when a well goes from verticalto horizontal are very few. Typically, problems involved with displacement or channeling of fluid alongthe horizontal wellbore dictate that a proppant transport fluid be used rather than a proppant dropoutfluid. If a carrier fluid is used that allows proppant to drop out of suspension, the proppant will builddunes along the pipe, reducing the amount of prop that can be placed in the fracture <strong>and</strong> creating awellbore cleanout problem. Also, because vertical flow from the fracture comes directly into the well-8-1 1
ore, proppant flowback can be even more severe, especially with the restrictions <strong>and</strong> high differentialpressures that are experienced during inward radial flow. In acid fracturing, there are concerns of theaffect of acid on the wall strength of the formation in the near wellbore area, particularly in chalks.Wellbore isolation is needed in a few horizontal holes. Many companies require the use of a slotted ordrilled liner in the wellbore. Although these liners may prevent catastrophic collapse of the formation,they prevent effective isolation of any section of the wellbore should water or other undesired fluidbreak through in a channel or high permeability streak. Because of the way that drilled or slotted linerslay along the bottom of the wellbore, flow along the top can often not be detected by conventional loggingtools <strong>and</strong> fluid entry points into the wellbore remain unknown. The flow behavior in Figure 8.12 is aresult of the flow pattern in the well <strong>and</strong> the isolating effects of the liner. Only where isolation has beenachieved, such as with external casing packers or in the event of wellbore collapse will low rate wells showlarge entrance of fluids into the perforated liner at points other than the heel of the well. When slotted ordrilled liners must be used, external casing packers, or ECPs, should be spaced at several points down thelength of the wellbore to allow fluid entry diagnostics <strong>and</strong> effective treating where required. ECPs are notfoolproof <strong>and</strong> sliding these rubber covered devices long distances may wear the outer cover. Integrity ofthe sealing point must also be examined closely. In most cases, open holes remain the best methods ofestablishing a low formation damage completion <strong>and</strong> allowing options for treatment of the well later on.Problems in Measuring Flow in a WellEquipped with a Perforated LinerFigure 8.12Water control in a horizontal well is an item that must be considered during the design phase.Although many horizontal wells were drilled to eliminate or control formation water, there are caseswhere high permeability zones or natural fractures will bring in tremendous amounts of water thatmust be controlled to maintain effective well production. If ECPs have been used in the design, thest<strong>and</strong>ard control methods of gels, cements, resins or other control devices can be used. If a slottedliner has been used, then destructive squeezes with cement are about the only option. In open holes,selective placement of inflatable plugs or even liners may be useful.Increasing Reservoir ContactThere are several reservoir conditions that can be effectively approached with horizontal wells <strong>and</strong> afew that require creative thinking. Vertical permeability barriers are often a limiting factor for horizontalwell development; but in the special case where thick zones are separated by barriers, stacked lateralshave found success. Advantages of this method include increased reservoir contact <strong>and</strong> evenmethods of crude isolation, Figure 8.13. With this type of liner isolation, plugs <strong>and</strong> selective perforatingare used to open or close each wellbore.The main drawbacks in openhole multilaterals is the difficulty in reentering the desired lateral. Most ofthe stacked laterals have been done in a single field in the Austin Chalk where thin barriers separatethick chalk lenses.The design of Figure 8.14 offers a few advantages over a single horizontal: minimization of contacttime with drilling mud <strong>and</strong> the ability to use the wellbores in different manners with potentially differentlife spans. Forked laterals in the same direction have been used to tap upper <strong>and</strong> lower members of aformation. Slanted laterals may be particularly attractive in sloping formations. Recompletions from8-12
RdParthl llncrIsolationFigure 8.13existing wells can be directed into the updip reservoir, adding reserves to an existing well. The loweror downdip lateral could be used in unusual cases to accelerate production.FIIW drllld Ymnl shut on for ratFigure 8.14Many of these topics are considered in the following pages.LoggingJust as a horizontal well is a vertical well turned on its side, the tools <strong>and</strong> techniques that weresuccessful in damage identification, removal or treating in vertical wells are not necessarily effectivetools in horizontal wells.Logging of extended highly deviated or horizontal holes is difficult <strong>and</strong> requires special procedures,none of which are entirely fool proof.13 The time to log a highly deviated well is increased dramaticallyas the hole section passes approximately 50"-55". Several early techniques involved running toolsslick <strong>and</strong> fast, counting on momentum to carry the tool all the way to the bottom. Success at this operationvaried depending upon operator experience <strong>and</strong> the deviation. Beyond approximately 55", successwas very rare. Other methods involving pump down tools were more accepted: however, onlyshort sections of the hole could be logged before removing a st<strong>and</strong> of pipe; this required tripping outthe logging tool prior to pipe removal. The basic technique for jointed tubing has been improved by theuse of a device called a side entry sub (Figure 8.15). This device allows the wireline to enter into thedrill pipe at some distance below the surface, allowing several st<strong>and</strong>s of pipe to be removed or addedin any operation, before the logging tool would have to be tripped from the hole.The specifics of the side entry sub involve placing the side entry sub several st<strong>and</strong>s of tubing downthe hole <strong>and</strong> feeding the wireline in through the annulus. The wireline enters the tubing at the sideentry <strong>and</strong> the tool is generally on the end of the tubing being run. The tubing is stopped usually in the8-13
Figure 8.15: The side entry sub for allowing wireline tooloperation in deviated wells with assistance oflimited tubing movement. The system requires awet connect of the wireline to the tool. The sideentry sub Is usually run a few joints below therig floor to a depth that matches the distance ofrequired horizontal movement.highly deviated section of the hole, <strong>and</strong> the logging tool may be pumped out the end of the tubingwhere it latches in place on the end joint. The location of the side entry sub is generally in the verticalsection of the hole where cable interference <strong>and</strong> damage is less likely. Placing the side entry sub inopen hole is not recommended.Coiled tubing with wireline is one of the best methods to convey light loads <strong>and</strong> small logging tools indeviated wells. The wireline equipped CT units are capable of quickly h<strong>and</strong>ling many of the jobs oncedone with the side entry sub. Additional data is available in Chapter 18.Production logging with either a radioactive tracer tool or a spinner tool may not be accurate in deviatedwells. Smolen reports that in the spinner test, the tools that did not capture <strong>and</strong> measure theentire casing cross section of fluids did not accurately measure the fluid <strong>and</strong> gas flowing along theupper side of the casing. In some wells, there was also counter flow in the same casing string at thesame time; the higher density gas free fluids would downflow on the lower side of the casing while thegas rich fluids would be flowing up on the upper side of the casing (Figure 8.16). A tool that waseccentered toward the low side by its weight would indicate predominate downflow, even in the casewhere most of the fluid was flowing up the pipe (Figure 8.1 7). The tracer logging tool could also behampered by the same flowing conditions <strong>and</strong> the tracers were also found to adhere to the walls of thepipe in some instances. Spinner tools with full opening baskets to direct the entire flow into a smallarea are an improvement but may not be completely optimum since the back pressure on the well ischanged slightly <strong>and</strong> because the baskets are not leak proof.Flow Zones In a Devlated WellSormmownunl --.c--Figure 8.168-14
ATool Position is Critical to What It MeasuresWellbore StabilityFigure 8.17Wellbore stability has been a hot item of discussion in almost all horizontal well considerations. Theprimary question is will the wellbore fail during drilling or during completion? Because of the use ofhorizontal wells in formations that do not lend themselves to vertical wells <strong>and</strong> fracturing, horizontalwells have penetrated a number of marginally consolidated formations. With the use of top drive rigs,which allow circulating during the trip, wellbore failure during drilling is becoming more rare. Duringproduction, however, wellbore failures are often not fully investigated because of the use of slotted ordrilled liners. These liners are often used many times by the drilling department as insurance withoutconsideration of the problems they cause in evaluating or isolating the wellbore. Where wellbore stabilityis a problem, several potential treatments exist. Where the permeability is very high (above1 darcy), many companies simply choose to complete openhole with a nondamaging mud system <strong>and</strong>then insert a large prepacked screen. Problems have been very common, however, in perforated completionswhen the perforations collapse or are filled with formation s<strong>and</strong>. In these cases, the pressuredifferential across the perforation becomes so high that the inflow is severely restricted. For theseapplications, underreaming or in some cases, gravel packing of the zone should be considered.The removal of rock by drilling the well disturbs the in situ forces that are in the formation. The redistributionof stresses around the borehole wall can produce unusual concentrations of stress that makethe borehole unstable. In a vertical well, the mud or kill fluid weight is often just enough to offset thepore pressure. Although in most formations this is an acceptable level, in some deviated wells morekill fluid weight is needed to support some of the load produced by the stress concentrations. Compressivefailures (spalling) of formations at the borehole wall, are a major cause of many hole problemssuch as tight spots, formation flow <strong>and</strong> stuck pipe (not differential sticking). The studies of Fuh,et al.,’4 indicate that the borehole failures were progressive (time dependent) <strong>and</strong> originate in a majorpart from the lack of hydrostatic support from the mud <strong>and</strong> the increased load caused by drilling. Theborehole collapse pressure gradient increases with hole angle while the fracture gradient remains thesame. As a result, the working range between the two gradients is much closer in highly deviatedwells. This makes control of mud density <strong>and</strong> data gathering a much more critical step in the horizontalcompletions. In a model based on drilling experience, Fuh, et al., compared mud weights, boreholecollapse pressure gradient, <strong>and</strong> formation fracture gradient. The in situ stresses <strong>and</strong> rock strengthsmentioned in their paper were estimated from leakoff data.Wellbore stability in the deviated well can be an extreme problem because of a variation of stressesproduced by the formations that are exerted at the wellbore. Stress-induced borehole failures can begrouped into three classes, as described by Bradley,15 Figure 8.1 8.1. Hole size reduction caused by plastic flow of the formation into the wellbore. This is characteristicof flowing shale, salt <strong>and</strong> some chalks. Formations affected by this clastic flow usually exhibitreduced diameter, requiring reaming of the section or, if unattended, causing sticking of the pipein some cases.2. Wellbore enlargement caused by formation failing in a brittle manner <strong>and</strong> falling into the wellbore.This includes sloughing shale <strong>and</strong> other types of rock spalling. These problems are usuallyseen in wellbores which have exhibited fill between trips, poor directional control, <strong>and</strong> poorcementing due to “washouts.”8-15
97-84.:-*.... . . .
with hole collapse in the pay formation were reported at these pressures. When hole stability was aproblem, the zone of instability was in the shale above the pay zone. Successful h<strong>and</strong>ling wasapproached on minimizing time of exposure (8 days in the US Gulf Coast) rather than increasing mudweight.Low water loss cement is needed to prevent thickened cement masses that may block flow. Additives<strong>and</strong> technology to prevent the occurrence of free water that would lead to channels along the top ofthe horizontal section, are also required. When designing a cement slurry for cementing a highly deviatedwell, the free water <strong>and</strong> settling ought to be measured at an angle equal to the maximum welldeviation angle. Both free water <strong>and</strong> settling are dependent upon the deviation angle, but, as noted byParcevaux, in a totally horizontal cylinder, free water is difficult to collect since it may be consumed bychemical contraction. The only way to measure the free water may be by measuring the bulk volumechange. Water losses of less than 50 cc/30 min are desired.PerforatingPerforating in a horizontal well may not seem different at first glance from the same process in a verticalwell. The attributes of the horizontal well which make it extremely attractive for fluid recovery <strong>and</strong>reservoir management can be controlled or enhanced only to a small amount by the selection of perforatingequipment. However, after consideration of the impact of perforating on the other phases of horizontalcompletion, a clearer picture is formed of the importance <strong>and</strong> the differences of the perforatingtreatment.Although perforating may be used in open holes as a stimulation or damage bypass technique, it isrequired for cased holes to establish fluid entry. The use of casing is less common than open hole orslotted liner completions, but has advantages in some unstable formations or where zone isolation inthe horizontal section is critical to the success of the well.The basics of perforating are altered somewhat by the decentralization of both the casing <strong>and</strong> the perforatinggun in the horizontal wellbore. The use of a phased perforating gun for the obvious flowenhancement benefits, highlights the problem of clearance distance on the performance of the perforatingcharge. A more complete explanation is available in the chapter on perforating. Gun clearance,that distance from the outside of the perforating gun to the inside wall of the casing, affects both theperforation entrance hole diameter <strong>and</strong> the penetration. Since the gun is forcibly decentralized in anywellbore with even a few degrees inclination, clearance distances must be considered. The effect ofincreased clearances on performance of charges results in smaller diameter <strong>and</strong> shallower holes. Ifhole size <strong>and</strong> penetration are important, then the effects decentralization of the gun must be part ofthe design. In most cases, the largest gun that can be fished is recommended. The effects of casingcentralization in the borehole may also be a factor, especially where enlarged holes are encountered.Perforating design in these sections must consider penetration through the thicker cement sheath thatinvariably surrounds the top surface of any part of the pipe in a deviated h01e.l~Positioning perforating guns in the horizontal well is a challenge on two fronts; gun conveyance <strong>and</strong>depth control. Wireline is very troublesome past about 55" of hole deviation. Tubing conveyed perforating(TCP) <strong>and</strong> coiled tubing are presently being used in horizontal wells to move guns. Tubing conveyedsystems are expensive but have the advantages of strength <strong>and</strong> almost unlimited gun choices,while coiled tubing offers cost <strong>and</strong> time advantages, but only with smaller, lighter gun systems.Depth control or gun positioning in the horizontal section is complicated because the gamma ray log,the traditional depth control device, may show less formation character variation in some wells as thehole turns horizontal. The problems of wireline conveyance of perforating guns also applies to otherlogging tools such as the collar locator or the porosity logging tools, that might be used for positioningin the horizontal section. For the horizontal hole, either accurate tubing length measurements in theTCP string or other logging conveyance systems are needed. The importance of depth or positionaccuracy will depend upon the homogeneity of the formation <strong>and</strong> the emphasis on accuracy in placingperforations for gravel packing or fracturing. TCP completions where depth control is necessary, MWDtechnology or wet connect <strong>and</strong> sidedoor tools'3 are necessary to log the position of the gun. With the8-17
coiled tubing placement technique, tubing is available with logging line inserted through the tubing. Inhorizontal wells, especially where depth control is critical, the use of a short joint or pup joint in thecasing string is a requirement to mark the start of the pay zone. Locating the pup joint does require acollar locator.Perforating the horizontal well requires special equipment or methods in two primary areas; gravelpacking <strong>and</strong> fracturing completions. Gravel packing requires selection of whether an upper bank ofholes (pointing straight up) can be effectively filled with gravel. Although one line of thought <strong>and</strong> testssays that the upper bank of perforation tunnels can be filled with gravel,18 most of the literature liststhe upper hole packing as difficult at best.’9120 Many operators have elected to eliminate the upperbank of holes. The problem of gun orientation to properly align the downward patterns has beenapproached through the use of swivels,21 <strong>and</strong> positive locator devices to release torque built up in thestring. Failure to release this stored torque may result in a twisted gun body <strong>and</strong> holes in a r<strong>and</strong>omorder.The second problem, that of perforating before fracturing in the horizontal hole, is dependent upon theexpected fracture direction <strong>and</strong> its relationship to the plane of the wellbore. The two fracture/wellboreorientations of Figure 8.19. illustrate this problem. If the horizontal wellbore is placed parallel to theplane of fracture direction (perpendicular to the plane of least principle stress), the fracture may liealong the wellbore for a large part of its length. In this case, a normal perforation density of 4 to 8shots per foot is adequate to establish communication with the wellbore without a large pressure dropat the wellbore. If, however, the plane of the fracture <strong>and</strong> the plane of the wellbore differ by even a fewdegrees, the resultant contact of the wellbore <strong>and</strong> the fracture will be a “pinch” point of a few inches oftotal contact area. This limited fracture/wellbore contact area may result in large pressure drops <strong>and</strong>the indication of damage from a buildup test. To partially relieve the contact problem <strong>and</strong> the resultantpressure drop, a high density perforating effort at the fracture exit point should be considered. Thistype of perforating dictates that the fracture contact point be selected <strong>and</strong> only that zone be perforatedbefore the frac. For multiple fracture completions from the same wellboreZ only the point to be fracturedshould be perforated prior to each fracturing treatment. Wellbore isolation between the targetzone <strong>and</strong> the fractured is also needed.Figure 8.19:Two of several possible fracture intersections with thewellbore. At maximum contact (above) the fracture flowinto the wellbore is linear but drains the same pattern asthe wellbore. The minimum contact (bottom) drains adifferent area but offers a pinch point of radial flow forfluid entry into the wellbore.Corrosion/ErosionSome corrosion problems may be more severe highly deviated wells. In a corrosion study of wells inthe North Sea, it was found that in all cases of deviation more than 20°, a preferential erosion or corrosion/erosionattack occurred as troughs of 1 in. or more width, Figure 8.20, always on the low sideof the hole.23 Production of solids increased the rate of erosion.8-18
Figure 8.20:Corrosion or abrasion on the low side of tubing.The causes of abrasion are rod guide orcoupling wear. Corrosion patterns are causedby water running along the low side.Figure 8.21:Dune formation during gravel packing in a horizontal wellbore. Theupper drawing shows the gravel being swept along <strong>and</strong> dropping overthe edge of the dune (alpha wave or dune). The open area above thegravel is a function of the Injection rate. The lower drawing shows thechannel filling with gravel as the flow dehydrates (leakoff) during thefinal stages (beta wave or dune).Gravel PacksGravel packing a horizontal, although not always necessary, is possible <strong>and</strong> has been done on numerousoccasions in pays in the Congo, Trinidad <strong>and</strong> the US Gulf Coast. The packing proceeds as a duneformation, Figure 8.21 , first packing the lower part of the wellbore as gravel drops out of the carrierfluid <strong>and</strong> then rapidly back packing the upper section as the gravel slurry dehydrates due to leakoff.Leakoff to the formation <strong>and</strong> through the screen is required for a tight pack.Coning Control<strong>Gas</strong> <strong>and</strong> water coning control with horizontal wells is possible <strong>and</strong> most of the early horizontal wellswere drilled with coning control as a major consideration. Gige$4v25 theorizes that the coning controlin the horizontal well is better because a lower drawdown is required for a given rate <strong>and</strong> the pressuregradient is nearly linear, almost to the boundaries of the drainage area. Addington supplied gas coningcorrelations for coring in Prudhoe Bay.57 The following equation estimates production from a verticalwell without gas coning.26278-19
Qmax =1.535(p0-Pg)k0[h- (h- D)2]where:h = reservoir height, ftD = distance between the gas-oil interface <strong>and</strong> the top of perfs, ftQ, = oil production rate without coning, bbl/Dpo = oil density, gm/ccpg = gas density, gm/cck = perm, darcyTo calculate Q, for a horizontal well, substitute the effective wellbore radius, rWaeff for r, Joshi submitsthe following equation for a comparison of maximum flow rates in horizontal <strong>and</strong> vertical wells.[h2- (h- D1)2]/nQmaxl h DIQmax] v'e[h2- (h- D)2] In 7(' w, eff)where f? represents the distance between the horizontal well <strong>and</strong> the gas-oil interface, Figure 8.22. Ahorizontal well can theoretically produce oil at a higher rate than a vertical well without coning or thehorizontal interface can be closer to the problem zone than perfs in a vertical well <strong>and</strong> produce at thesame rate.25 Sherrard., et show the comparison of critical coning rates for horizontal <strong>and</strong> verticalwells as a ratio plotted against horizontal well length for various ratios of vertical-to-horizontal permeability,Figure 8.23. It is this vertical permeability that is critical for the success or failure of a horizontalwell. If the vertical permeability is high, the horizontal well can drain the formations, but is the verticalpermeability is low, less than 50% of the horizontal permeability, the horizontal well may need to befractured to be comparable to the performance of a fractured vertical well. Reservoir modeling isneeded in these cased to predict well performance.bIoilFigure 8.22:r * .....- - .... r ~ r h .... r(Joshi, SPE 15375)<strong>Gas</strong> coning schematic illustrating distance to the gas zonefor a vertical <strong>and</strong> a horizontal well.8-20
QW'QcVKv 1%I#)a.750, = Horizontal Well Critical Coning Rate 0OCv = Vertlcal Well Critical Coning Rate25<strong>Oil</strong> Column Thickness = 200 FeetPenetration Ratio = 0.15 .1065432 500 600 700 800 900 1000 HOa 1200 1300 1400 1500ORAINHOLE LENGTH (ft)(Shenard, et al.)Figure 8.23: Comparison of critical coning rates for various values ofvertical <strong>and</strong> horizontal permeability.Heading ProblemsOne of the more serious problem areas in horizontal well completions is heading. A heading problemis an intermittent slug of liquid propelled by a gas pressure rather than moving evenly up the tubing.The liquid accumulates in a low area such as an undulating wellbore or at a low point <strong>and</strong> is regularlypropelled out as a slug when gas pressure builds up to a sufficient point to push the liquids into thenext section of the hole. When a slug of liquid enters the bottom of the tubing, the pressure at surfacemay react wildly. This type of flow is not continuous <strong>and</strong> does not optimize production. It may alsodamage lift equipment <strong>and</strong> surface equipment.Multi-lateral CompletionsA multi-lateral completion is any well with two or more lateral departure wells drilled from a commontrunk. The laterals may be vertical, deviated or horizontal <strong>and</strong> in the same or different planes. Bothcased <strong>and</strong> openhole laterals have been completed.Multi-lateral wells are usually required where the reservoir has natural compartments that inhibit fluiddrainage. Spotting these compartments can often be accomplished from logs, DSTs, <strong>and</strong> P/Z versuscumulative production plots as shown.Decline Curve (PE v.. Gum. Q) for Homogeneous <strong>and</strong> Comparbnentalized Reservoirwith Limited Connection to the Main Re8snolr <strong>and</strong> WellboreI I I I II8-21
Once the compartment has been identified, it must be located (deposition data, geology, <strong>and</strong> well testing)<strong>and</strong> a multiple wellbore design created to fit the reservoir needs.Multi-laterals or any multi-legged well, may be also used to solve other problems. Some uses are:where surface area or platform drilling slots are limited; where upper hole conditions make drilling difficultor expensive (Le., there is an economic need to use the existing wellbore; where multiple reservoirsexist as stacked or separated horizons; or where enhanced recovery operations can benefit.The technical challenges presented by multi-laterals include: the location of the junction, the requirementsfor a pressure seal, the need to re-enter the wellbore <strong>and</strong> the need to commingle or separateflow. Once each of these needs have been evaluated, the multi-lateral design process can start.Multi-lateral technology encompasses both multiple wellbores <strong>and</strong> the methods to isolate <strong>and</strong> re-enterthe wellbores if required. The isolation <strong>and</strong> re-entry needs were considered by an industry focus group(Tarnil) <strong>and</strong> numeric levels were assigned to help with description. Those designations, shown in thefollowing data are simple, but adequately describe most multi-lateral needs.Lateral Technology LevelsLevel 1 - Open/Unsupported JunctionLevel 2 - Mother Bore Cased & Cemented, Lateral OpenLevel 3 - Mother Bore Cased & Cemented, Lateral Cased but not CementedLevel 4 - Mother Bore & Lateral Cased & CementedLevel 5 - Pressure Integrity at Junction (not cement)Level 6 - Pressure Integrity at Junction achieved with casingLevel 6s - Downhole SplitterThe decision of what type of multi-lateral well may be best suited for a particular environment can bestbe made after examining the local well specifics, plus a general c<strong>and</strong>idate list of relationships.First, it is useful to examine the basic types of multi-lateral wells.The stacked multi-lateral, Figure 1 , is used to complete reservoirs that have a one or two major barriersto vertical flow.Figure 1: A stacked multi-lateral well.Sealing at the lateral departures is necessary only when there are:1. pressure variances between the zone that prevent commingling of fluids.2. fluid compatibility problems such as scale or organic deposits that prevent mixing of fluids.Since sealing of the lateral departure is both difficult <strong>and</strong> very expensive, it is only recommendedwhere absolutely necessary.The opposed multi-lateral wells, Figure 2A are used in a number of environments where extendedreach from a central wellbore is necessary or where extremely high rate liquid wells cause sever pressuredrops along a single long horizontal or highly deviated wellbore. Using two 1500 ft lateralsinstead of one 3000 ft lateral cuts the backpressure felt at the toe of the lateral by limiting the frictionpressure8-22
Figure 2A:An opposed multi-lateral.In a special case of the opposed multi-lateral, designs have been proposed that go up-dip <strong>and</strong> downdip,Figure 2B, in a formation with sloping beds. The upward lateral may be useful to recover reservesabove the water-oil contact in an active water drive formation.Figure2B:An opposed lateral in a dippingformation.Combinations of stacked <strong>and</strong> opposed laterals, Figure 3, have been drilled, however, in the complexityof the numerous kickoff points there is always a potential for loosing the well during drilling or aworkover. Relatively few of these wells have been drilled <strong>and</strong> none are known to have successfullybeen reentered for a workover in each leg.Figure 3: A stacked <strong>and</strong> opposed multilateral.In a branched, forked or bird’s foot multilateral, Figure 4, there are two or more laterals in the sameplane. This is among the simplest of the multilateral wells, but more than two laterals may cause productioninterference. Reservoir modeling is necessary to determine number <strong>and</strong> position of the lateralsin this type of arrangement.Multiplanar multilaterals, Figure 5, are becoming more common as a simple method of draining wells,that have barriers. These wells offer the advantages of fewer wellbore entry points, a definite advantagethat lowers risk of entering the wrong lateral or of loosing the wellbore entirely (when multipleentries are considered).8-23
Figure 4A:A forked multilateral in the sameplane.Figure 4B:A branched multilateral reachingtwo separate structures.C<strong>and</strong>idate List/ / / / / / I / / / /Figure 5: A multiplanar multilateral.The c<strong>and</strong>idate list for design is still forming but has the following considerations:1. If workovers or reentries are expected, drill a path that can be completed as needed are workedover as dictated by the well.2. No pressure isolations devices or techniques are normally used unless there is a demonstratedneed.3. No screens or liners (slotted or perforated) are used unless these are a demonstrated need.4. Limit the number of wellbore kickoffs to a minimum. This protects the well <strong>and</strong> makes reentryeasier.5. The well specifics <strong>and</strong> number of barriers (small <strong>and</strong> large) that limit vertical flow sets the lateralplacement <strong>and</strong> the rest of the design.a. For numerous barriers <strong>and</strong> where water coning is not a problem, a slightly slopping wellboreis considered.b. For few barriers <strong>and</strong> relatively thin zones, multiplanar wells are considered, particularlywhere reentry will be a possibility. If reentry is not important, <strong>and</strong> barriers are hundreds offeet thick, stacked multilaterals are a possibility. In any multiplanar well, lift must beaddressed.8-24
Figure 8.26: A forked or “bird’s foot” multi-lateral well usually has all the laterals in the same horizontalplane. It is often used to develop flank reserves or fault-bounded blocks of a reservoir.c. When friction pressure along the lateral in high rate oil wells keep the toe from producing,opposed multilateral are needed.d. Branched, forked or bird’s foot multilateral are used in single zones, (without barriers toenhance production in a single zone), to reach flank areas or reach multiple structures.Thermal CompletionsWhen steam or combustion is planned, special completions are needed. Heat reduces crude oil viscosity.This is necessary when there is little or no driving energy to propel a low gravity oil toward thewellbore. Heat loss wide temperature extremes, stimulation, gravel packs, <strong>and</strong> increased corrosionare problems that involve well completions engineers.Steam ProjectsAlthough there are instances of steam use for well flow improvement as far back as the 1930’s, thecontrolled application of steam was not implemented until 1959.30 Since that time, both steam drive<strong>and</strong> cyclic steam injection have been tried with varying success. The type of steam drive will make adifference as to how the well is completed. Cyclic steam injections or huff <strong>and</strong> puff operations utilizeinjections of steam over a period of time followed by a flow period where the heated oil flows into the~ellbore.~~ In this operation, the cyclic changes of temperature in the well will produce stress forces inthe casing <strong>and</strong> tubing in a cemented well <strong>and</strong> pipe movement in an uncemented well. Attempts to controlthese forces include use of sliding sleeves or other tools that permit expansion <strong>and</strong> contraction ofpipe, allowing the casing to exp<strong>and</strong> out of the ground, <strong>and</strong> prestressing the casing to compensate forthe forces created in the cyclic heat pattern. Special sliding seal assemblies <strong>and</strong> slip joints are typicalin tubing strings in thermal completions. These tools act as an expansion joint to permit free movementof the tubing <strong>and</strong> relieve the compressive or tensile loading. The sliding sleeve assemblies areseldom used in casing operations since failed joints would be difficult to replace.Steam drive projects use a pattern of injectors <strong>and</strong> producers <strong>and</strong> may significantly raise the temperatureof a large section of the field.75 The temperatures experienced by the tubing strings in a steamdrive are more constant than in a cyclic operation. Temperatures of 240°C (464°F) have beenrep~rted.~’8-25
Combustion ProjectsIn-situ combustion projects may offer the most severe test of temperature induced changes in a well.The in-situ combustion principles were first field tested in 1 958?*B3 The injection/ignition wells areusually completed open hole to facilitate the large volume of injected air <strong>and</strong> to prevent severe casingdamage. Producers may also be completed open hole if the formation is competent <strong>and</strong> if the afterburnformation has sufficient strength to allow safe plugging of the well. Gravel packing operationsmay be used on either producers or injectors but the solubility of silica in hot water or steam can makethe pack short lived.The operating period of a combustion well may be divided into a cool period <strong>and</strong> a hot period. Duringearly stages, while the front is advancing away from an injector <strong>and</strong> towards a producer, the well operatesnormally <strong>and</strong> is in the cool mode. As the combustion front nears <strong>and</strong> distillates breakthrough tothe producer, the temperature will climb <strong>and</strong> excess gas may lock pumps <strong>and</strong> create emulsions. Afterthe front arrives, the well can often be operated as a flowing well. Water is often injected at the surfaceinto the annulus to control bottomhole temperature (annulus open at the bottom).Placement of the wells in an in-situ combustion is also a critical factor. The best results have beenreported with up-dip injectors that allow a top to bottom b ~ r n Pattern . ~ ~ spacing ~ ~ must be sufficient togive the heated gasses time to transfer heat to the oil. Monitor wells are often used to track the temperature<strong>and</strong> thus the combustion front of the fireflood. Completion of these wells is usually made withheat resistant casing top set on the formation <strong>and</strong> completed open hole. It is not uncommon in firefloods to destroy the integrity of the casing in monitor wells as the fire flood front passes. Peak temperaturesmay exceed 1600°F (870°C).36Wet combustion is a modification of in-situ combustion. In this technique, also called a combinationthermal drive, CTD,% a heat pad is first established with dry in-situ combustion. After the heat-up,water is injected <strong>and</strong> in-situ steam is created. Whether the combustion is allowed to continue burningor air injection is stopped defines the difference between the CTD <strong>and</strong> COFCAW (quenched) processe~.~~Alternate Heating MethodsApplication of heat at the wellbore from direct fired heaters is one method of locally applying heat tosolve paraffin or heavy crude problems at the ~ ellbore.~~~~~Heat loss in the tubing is eliminated withdownhole burners, but the total energy that can be applied with the tool is also less. Whether thesetools are meant to supply heat from the burning process or steam from a downhole steam generator,the local heat can be quite high, causing tubular expansion/contraction <strong>and</strong> localized corrosion by byproductsin the exhaust gas.Downhole electrical resistance heaters have also been mentioned although electrical power lossesthrough the supply cables are usually prohibitive for most applications involving large heat requirements.At least one method uses the casing as a electrical conductor.StimulationFracturing may occur as the result of steam injection, both accidental <strong>and</strong> as a stimulation mechanism.Subsurface <strong>and</strong> surface heaving caused by steam has been traced by the use of tilt meter^.^'The fractures are often useful to facilitate heat transfer to a larger section of the reservoir.40 Fracturingstimulation design or application does not radically change for steam completions, but the fracturelength is dictated by needs of heat transfer rather than economics of inflow. One of the most seriousproblem faced in stimulating thermal wells is the thermal decomposition of the proppant. The proppantor gravel decomposition is caused by reaction of silica with the basic steam condensate.8-26
Many of the feed waters used to produce steam contain naturally occurring bicarbonate ion, HCO-3.During steam generation, thermal degradation of HCO-3 ions in the feed water produces CO2 <strong>and</strong> OH-. The OH- ions remains dissolved in the aqueous phase in those operations that produce less than100% steam. Water with the OH- ions is highly alkaline <strong>and</strong> will dissolve (<strong>and</strong> possibly reprecipitate) alarge amount of silica. The source of silica may be from either the formation or the proppant pack froma gravel pack. Solubility of silica goes up rapidly for increasing temperature, Figure 8.27.41*42 Use ofsintered bauxite <strong>and</strong> alumina pellets have also been proposed since the materials are stable in dry,high temperature environment^.^' In wet conditions, these materials are also influenced by high pH,Figure 8.28, although not nearly to the extent of the silica (s<strong>and</strong>) solution.In longer term, high temperature tests with highly concentrated brines at high temperatures, more dissolutionhas been reported. To control the disintegration of the proppant, the HCO-3 ions should beremoved before steam is created or the pH should be balanced. The problem is made even more criticalin low strength formations where the effects of dissolution of silica in the formation can be verynoticeable . 42Other types of fracturing such as explosive stimulation have been attempted in the hot environmentswithout much success.43Corrosion <strong>and</strong> ScaleTEMPERATURE (‘F)(Underdown & Dias)Figure 8.28: The solubility of quartz increases rapidly inany type of water as temperature increases.Scale formation is a common byproduct of many high temperature completions. Cooling of the wellboreduring the production phase of a huff <strong>and</strong> puff operation may deposit scale, paraffin, or asphalticmaterials at some point of the tubulars. This deposition is usually more severe in certain stages of theproduction, typically toward the last of the production cycle when the temperature of the fluid beingproduced has fallen significantly from the start of the cycle. Additives to the steam during steam injectionor a macaroni string down the outside of the tubing are common treatments. Solvents are used forparaffin <strong>and</strong> asphaltenes removal, usually during the initial phase of steam injection in the next cycle.Steam can alter surfactant adsorption <strong>and</strong> efficiency.8-27
SampleSintered bauxite20/40 US meshTemp Time pH Weight LossStjO to 600 (2 hrs / 0. /560 to 600 72 hrs 9 1.3560 to 600 72 hrs 11 3.5High-alumina beads20/40 US mesh560 to 600 72 hrs 7 2.3560 to 600 72 hrs 9 2.4560 to 600 72 hrs 11 3.7Figure 8.27: Weight Loss of Bauxitic Material in SteamData on corrosion is difficult to correlate in thermal projects because of the independent nature ofmost thermal completions <strong>and</strong> the variability of corrosion itself. Holes in the production tubing are usuallynoted by a sudden increase in the gadoil ratio. Failures in the casing as usually accompanied bya change in the WOR or WGR ratio if no packer is set or a back pressure change. A string check maybe made by setting an inflatable packer or profile plug in the bottom of the string. Checks of individualsections are made possible by straddle packers or packer <strong>and</strong> plug sets on coil tubing. Impressionpackers <strong>and</strong> special corrosion surveys are also available.Acidizing in thermal operations can produce severe corrosion. Hydrochloric acid spends extremelyrapidly at higher temperatures <strong>and</strong> it is difficult to inhibit. Other forms of both mineral <strong>and</strong> organic acidare available <strong>and</strong> have much lower reaction rates towards steel <strong>and</strong> other commonly used metals thanthe mineral HCI. Acetic, a formic (organic acids) <strong>and</strong> phosphoric (an inorganic acid), are only effectivewhen the damage is acid soluble. The byproducts of the reactions such as phosphoric acid combiningwith calcium carbonate to produce the precipitate calcium phosphate must be considered before astimulation system is selected. A drawback of steam input is the in-situ generation of CO2 <strong>and</strong> H2S.These gases pose metallurgical problems that must be addressed in tubular selection.30InsulationBecause the heated fluid is expensive <strong>and</strong> the production tends to become viscous upon cooling, theuse of insulated tubulars are recommended whenever a thermal operation is c ~nsidered.~~~~~ Thesetubulars may cut heat loss from the tubing as much as 70-90% depending upon the type <strong>and</strong> thicknessof insulation <strong>and</strong> the depth <strong>and</strong> surroundings of the well.Tubular DesignTubular design43i46-50 <strong>and</strong> cementing considerations43949 are among the major well completion considerationsin thermal completions. Thermal cycling, fluctuating operating pressures, cement strength,<strong>and</strong> were from tubing movement are major casing concerns while thermal stress <strong>and</strong> increased corrosiondominate tubing <strong>and</strong> packer selection.Temperatures are more steady in continuous steam injection, <strong>and</strong> the tubular forces are usually onlyaccounted for during the startup <strong>and</strong> cool off period at the end of a project or during an interruption.Even in a continuous operation however, allowance must be made for shut downs due to mechanicalproblems.Cyclic steam injection imposes stress patterns that cause either buckling or threaded joint jumpout.After an extensive downhole TV camera study, H~lliday~~ concluded that most failures were actuallytension failures. The failures were most often seen at the joint <strong>and</strong> involved:1. Tensile failure in the last engaged pin thread.8-28
2. Tensile failure by pin end jump-out.3. Joint failure by closing of the coupling st<strong>and</strong>-off clearance.H~lliday~~ notes that the thermal well casing failures were tensile in nature. Casing was shown toplastically deform during the heating cycle <strong>and</strong> then develop tensile loads in excess of the jointstrength during cooling. Tensile failure could be avoided by limiting the total axial stress change to thesum of the elevated temperature yield strength <strong>and</strong> the allowable connection strength. The numberobtained is limited by the body tensile yield strength. This work has led to the prestressed casingdesign that is the most typical completion mechanisms. Since many thermal projects are often borderlineeconomic, casing failures in non critical areas of the string (where leaks, cross flow, <strong>and</strong> collapseare not problems) are often not repaired. In some cases, the casing immediately above the pay in acemented, low porosity <strong>and</strong> low permeability section, may even be notched by abrasively cutting outan entire section to allow some expansion <strong>and</strong> contraction of the casing.The failure of the string by tensile forces is usually in the form of joint pullout at a connection. The tensileforces produced in a string are at a maximum at the minimum temperature of a thermal cycle, asshown previously. The maximum temperature of the cycle influences the strength of the pipe, however,<strong>and</strong> may contribute to the tensile failure by yielding the string at the c~nnection.~~ Generally,casing strings that did not fail by joint pullout after the first thermal cycle will probably not fail at thejoint as long as the maximum temperature of the first cycle is not exceeded.51 The cycle is not endless;if the stress on the last engaged thread at the coupling approaches the minimum yield strength ofthe casing, the joint will eventually fail by cyclic fatigue after some number of cycles. Joint life is furtherreduced by corrosion, often cutting the number of cycles in half.51 One estimate of joint life, correctedfor estimated corrosion, is 10 to 20 cycles.51 The number of cycles can be increased by using apremium thread connection.As the well heats up, the casing exp<strong>and</strong>s <strong>and</strong> experiences a compressive load, up to the point of failuredictated by the yield strength or until it buckles. When the well cools, tension loads are developed.The simplest casing completions for shallow wells is to leave the top part of the pipe free to exp<strong>and</strong>above the cemented section isolating the pay. This allows the wellhead to move upward, sometimesas much as a few feet, during the hot cycle <strong>and</strong> to shrink back toward the ground during the coolcy c ~e .5*If the casing is fully cemented (or cemented at both ends) <strong>and</strong> is not allowed to exp<strong>and</strong>, the stress is:oorOwhere:= &(AT)= (6.9 X 10⁻⁶) (30 X 106) (AT) = 200 AToaATE= stress (psi)= coefficient of thermal expansion, 6.9 x 1 0-6 inches/in./"F for steel.= increase in temperature over the average formation temp., OF= Youngs modulus, 30 x 1 O6 psi for steel.Note that the stress induced by temperature change is independent of the tube length.The steam injection pressure will be one of the factors of selection for grade of tubing <strong>and</strong> casing. Theminimum temperatures for producing a yielding force in casing can be estimated from the casingstrength. Since each one degree Fahrenheit rise produces a compressive stress of 200 psi, the minimumtemperature increase that an N-80 string can tolerate without buckling is about 80,000/200 =400°F.51 Other estimates may produce slightly higher values.% As previously shown, yield <strong>and</strong> tensile8-29
strengths vary with initial temperat~re.~~ Suggested yield strength design curves for several grades ofcasing are given in Figure 8.29.50700900lW.310 124.650 761800 24,100 2125 76.2 27778.545 92.145 51,400 19200 21.5 77.3 277Figure 8.29: Elevated Temperature Tensile Properties of Various Grades of Seamless Casing <strong>and</strong>Tubing (after Youngstown)Compressive forces may buckle casing in long unsupported sections that are fixed on both ends.Figure 8.30 predicts temperature changes that will cause buckling by compressive loading.51 The uniformloading in the second column assumes full cement contact. A complete cement job can preventlateral casing movement only if the formation is competent. If the cement deteriorates because of heator other factor, buckling can result.51 Heating of the casing in slant hole sections may also produceuneven loading <strong>and</strong> accelerate buckling.Grade(spec)JNSMinimum YieldStress (psi)IAllowable Temperature Change53,000 23 I 2f580,000 346 40095,000 410 475ICementing ConsiderationsThermal completions can have a severe impact on the strength of cement as the temperatureincreases beyond about 250°F. Portl<strong>and</strong> cement for high temperature wells usually contains a stabilizingadditive such as silica flour. Other cements based on pozzolan, lime or other chemistries are alsoavailable.49r54 Slurry properties <strong>and</strong> set strengths of some of these mixtures are contained inFigure 8.31. The most stable of the mixtures is the calcium aluminate cement, a refractory cement, butit is also the one with the lowest strength.8-30
Completions(from Gain, et al.)Figure 8.31: Slurry properties <strong>and</strong> strengths of set high temperature cement.Three possibilities exist for improving casing life in steam injection?’1. Prestress the casing to prevent the string from exceeding the yield strength at the maximum casingtemperature.2. Reduce stress by anchoring the casing at the bottom <strong>and</strong> allowing the wellhead to rise <strong>and</strong> contractas needed.3. Increase the yield strength of the casing.4. Liner failure may be reduced by hanging the liner off bottom to allow for downward expansion.5. To minimize casing damage during well killing operations, the hot well should be killed by pumpingliquid into the casing rather than by venting gas off the casing.6. For design of thermal expansion forces, use the maximum extremes of temperature. Expansionjoints <strong>and</strong> seal bore assemblies are the best methods of h<strong>and</strong>ling tubing movement. The units dohave to be trimmed for thermal service <strong>and</strong> seal life is often short.437. Use of a thermal packer can reduce temperature of the casing <strong>and</strong> cement sheath by 120°F <strong>and</strong>thermal stresses by as much as 20,000 psi.53Prestressing casing requires careful selection of joint <strong>and</strong> coupling <strong>and</strong> a two-stage cement job. Theamount of prestress may also be limited by the collapse design. Loads on a 7 in. string, for example,8-3 1
that would see 500°F might require up to 300,000 Ibs. This would require the use of hydraulic jacks onthe string during setting.Coalbed Methane WellsProduction of methane gas from coal-bearing formations has been an active dream since the early1950’s <strong>and</strong> a reality since the 1980’~.~~-~~.Approximately 6,000 coalbed methane wells have beendrilled in the U.S. The majority of this work has been aimed at relatively shallow coal sections wherethe gas is adsorbed onto the surface of the coal. These coal wells have a number of unique propertiesthat must be considered during planning, drilling, completing, stimulating <strong>and</strong> production.Coal is a microporous formation possessing a rather large internal surface area but a rather small typicalporosity. The average porosity is approximately 1-1/2 to 3% <strong>and</strong> almost all of the permeable, connectedporosity is in the form of fractures within the coal. <strong>Gas</strong> is adsorbed onto the coal surfaces in acondensed or liquid-like phase.93 This is entirely different from a normal reservoir rock where the gasexists in a free state within the pores of the rock or in solution in one of the liquids that exists in thepores.There will be more than methane gas within the formation. Nitrogen, methane <strong>and</strong> CO2 are relativelycommon gases, <strong>and</strong> each sorbed within the rockOg3Face <strong>and</strong> butt (secondary) cleat or fracture systems are the primary <strong>and</strong> secondary natural fracturepermeability avenues in which gas <strong>and</strong> liquids flow through the coaLS4 The fracture systems are generallyperpendicular to bedding planes, <strong>and</strong> the shorter length butt cleats end against the longer lengthface cleats. The presence of cleats or fractures is required to make a coal productive. The amount ofcleats influences both the permeability <strong>and</strong>, to some extent, the available sites for methane storage.The primary drilling problems encountered while drilling coalbed methane (CBM) wells include largevolumewater flow, overpressured gas kicks, wellbore stability <strong>and</strong> formation damage from drilling,completion <strong>and</strong> production operation^.^^ Coal reservoirs are not homogeneous <strong>and</strong> may have widelydifferent reservoir <strong>and</strong> geologic characteristics within the same production area. Most coal reservoirsare not single coal seams but numerous thin coal sections interbedded with shale <strong>and</strong> other formations.The characteristics which influence the reservoir quality <strong>and</strong> reserves of a CBM well includefracture presence <strong>and</strong> extent or permeability, pressure, fluid saturations, gas type <strong>and</strong> amount, relativepermeability, <strong>and</strong> other geologic characteristics.Before the gas can be produced from a coalbed methane formation, the pressure generally has to bedrawn down sufficiently to allow the gas to desorb from the formati~n.~~ This operation generallyrequires a relatively long-term production of water from the well. Peak production may not occur forthree to four years after the start of production. Production of water usually requires the utilization ofsome form of artificial lift. The most popular lift mechanisms for coalbed methane wells include beampumping <strong>and</strong> progressive cavity pumps. A typical production profile for a coalbed methane well isseen in Figure 8.32. In this figure, water production starts at a relatively high rate <strong>and</strong> usuallydecreases with time as the water level in the reservoir is drawn down. Pressure is also decreasingduring this time, allowing the gas to desorb from the surface of the rock, increasing until it finallyreaches a stable production stage <strong>and</strong> then declining with depletion of the gas resource. Coalbedmethane wells can produce for very long periods of time <strong>and</strong> produce significant reserves. Loweringthe water saturation within the reservoir also increases the reservoir’s relative permeability to gaswhich increases the ability of desorbed gas to flow through the natural fracture system to the wellbore.For this reason, it is imperative that the wellbores be kept free of water to avoid creating a lower relativepermeability to gas around the immediate wellbore.The basic investigation tools for coalbed methane wells are the same ones that are used in other formations.The log responses in the following paragraphs are summaries from an article by Scholes <strong>and</strong>Johnston in an AAPG bulletin.95 In coals, the resistivity log readings will vary as a function of log type8-32
0UQUC0z UElPDecllnostaw'I I I I ,Time>Figure8.32: General time line of events in the life of a coal well(from AAPG #38).91<strong>and</strong> the mud or mud filtrate that invades the cleat system. If the cleats are narrow, only the mud filtratewill invade the cleat system, <strong>and</strong> the mudcake can be detected by a response on the microresistivitylogs. In this case, the shallower reading resistivity logs will read a lower value than the deep readingresistivity logs. This is due to mudcakes being lower resistivity than the coal. Clays may also causethe resistivity logs to read low. This is due to the presence of bound conductive water associated withthe clays.Gamma ray tools will usually read very low counts per second in the coal because of lack of naturalradioactive elements. Coals with significant amounts of clay will read much higher.95Acoustic <strong>and</strong> sonic logs may read much higher porosities in the coal. The amount of clay does not typicallyhave an effect on these logs within the coal seam because the apparent porosity of pure clay isin the same range as the apparent porosity of coal. Presence of fine-grained s<strong>and</strong> may reduce theapparent sonic logsg5Neutron logs may read high apparent porosities in coals. This is because they generally regard hydrogenas an indication of porosity <strong>and</strong> coal is high in hydrogen content. The clay content of coal does nothave a large effect on the neutron predicted porosity.95Density logs may read low density because of the high matrix density of coal. This may give a falsehigh apparent porosity. Ash content <strong>and</strong> fine-grained quartz s<strong>and</strong> can cause the density to go up substantially.A coal formation with significant amounts of ash or fine-grained s<strong>and</strong> shows a much lowerporosity (higher density) than is true for the coal sample. Photoelectric (Pe) curve associated with adensity log usually reads in the range of 0.1 7 to 0.2 in pure coals. Ash will cause a deflection fromthese values depending on the elemental makeup of the ash. Usually the Pe of ash minerals is tentimes the Pe ofNatural gamma ray spectroscopy logs convert the naturally occurring gamma radiation into the mostlikely elemental composition that would emit the gamma rays. The response depends upon the elementalmodel that is used for the particular logging tool. Since pure coal does not contain sizablequantities of most of these radioactive elements, the logs typically show low values. Presence of clay8-33
would increase the radioactive reading, <strong>and</strong> fine-grained s<strong>and</strong> might lower the reading unless thes<strong>and</strong> is an ash compound which has radioactive elements associated with it.95Induced gamma ray spectroscopy logs will generally respond with good accuracy to coal. These logsmay help identify coal from key element analysis of carbon, hydrogen, etc. A high ash component(including clay minerals) would have the effect of indicating more elements, or higher percentage ofthose elements, on the induced gamma ray spectroscopy logsg6Coalbed methane wells require stimulation or special completion techniques to effectively connect thewellbore to the reservoir. A variety of these completions <strong>and</strong> stimulations have been tried, <strong>and</strong> manyare significant only in a particular field or even an area of a particular field. In general, the completionmechanisms are (from Palmer et al.):1. Openhole cavity. These cavity completions may be very prolific producers of natural gas. Thecavity is generally formed by surging the well in inward flow, <strong>and</strong> cleaning the wellbore by highrate flow or a bit run. The cavity completions may extend several feet into the reservoir, <strong>and</strong> areone of the lowest damage completions available. They are good when the permeability of theformation is relatively high <strong>and</strong> the natural fracture system is extensive.2. Polymer fracture treatments. Fracturing stimulations have been conducted in a number of coalsusing relatively large mesh s<strong>and</strong> at concentrations of up to 10 Ib per gallon. There is a trade-off,however, between the polymer damage to the coal formation <strong>and</strong> the productivity increase generatedby a long propped fracture.3. Water fracture treatments. Because of polymer damage to the formation, water has replacedpolymer gels as the predominant fracture fluid in many cases. Large mesh s<strong>and</strong> can still beused, but the concentration of s<strong>and</strong> is limited to a few pounds per gallon. In some coal gas wells,gas production is greater with water fracs than with higher concentration s<strong>and</strong> polymer fracs.4. S<strong>and</strong>less water fracture treatments. In a few reservoirs, pumping water at frac rates withoutproppant has been successful in providing an open pathway to the wellbore. Wells completed inthis manner are generally lower rate than propped fractured wells but may be beneficial becauseof lower stimulation costs in some areas.The cavity completion. Openhole cavity completion techniques involve setting surface pipe in thesame manner as for a conventional cased hole completion, <strong>and</strong> then drilling through the coal or to apoint above the coal with air drilling fluids. In the most successful wells, the openhole section is usually200-300 ft in height with the total depth at the base of the lowest coal seam that is deemed producable.The well is then “blown down” by surging full formation pressure to the atmosphere, allowingwater, gas <strong>and</strong> coal to flow up the pipe <strong>and</strong> to the surface. The time for the blowdown will depend onthe formation <strong>and</strong> area, but is typically about 15 min in cycles. Sometimes compressed air, <strong>and</strong> evenwater, is injected into the reservoir before blowdown to encourage breakup or sloughing of the coalinto the wellbore. Cleanouts are usually necessary with a bit on tubing to circulate coal fines from thewellbore. The process may be repeated up to 50 times over an 8-1 0 day period until the cavity stabilizes<strong>and</strong> the wellbore remains free of debris after a blowdown cycle. The cavity completion is not usefulin every case. The usual attitude is that if a cavity can be created, then it will make the bestcompletion. But if it cannot be created, the well probably needs to be fractured.Design of fracturing treatments for coal wells must take into account probable damage to the coal bypolymers, the amount of fracture length needed for commercial operation, <strong>and</strong> the leakoff involvedduring the fracturing attempt. The same natural fracture system which is required for coalbed methaneproduction can also be the source of severe leakoff when the higher pressures of a fracturing treatmentopen the natural fractures of the coal to leakoff potential. This problem is further complicatedsince fluid loss control may produce severe formation damage. Coal fracturing is an accepted part <strong>and</strong>has been successful in many parts of the world.8-34
The design of surface production facilities for coal wells must take into account the anticipated flow,the likely production of coal fines, early production of large amounts of water, <strong>and</strong> disposal of thewater. The typical coalbed methane surface facility consists of production well, gathering lines, separators,compressors, dehydrators, flow measurement systems, <strong>and</strong> water-treating <strong>and</strong> disposal facilities.Multiple CompletionsIn some wells, the presence of two or more pay zones may require separate h<strong>and</strong>ling because ofwidely different zone pressures or incompatibilities of fluids. In shallow zones, a separate well may bedrilled <strong>and</strong> completed in each pay zone. In deeper plays, or in areas where drilling time or surfacespace is limited, the pays may be completed individually from the same well by using a multiple completion.55-62Multiple completions are made for the following reasons:1.2.3.4.5.6.Vastly different zone pressures.Widely separated zones.Fluid incompatibilities.Multiple well replacement.Different mineral royalty owners of different zones.Legal requirements.Multiples completions are often described as a nuisance because of the increased mechanical problemswith the equipment. These problems result from running two or more strings of pipe <strong>and</strong> settingtwo or more packers. The equipment for multiple completions is often very specialized <strong>and</strong> the completionmay be tailored for each well.Multiple completions may be either the conventional side-by-side tubing completions involving theequipment shown in Figure 8.33 or a concentric tubing completion as shown in Figure 8.34. The conventionaldual is the more common of the two approaches, although the concentric duals allow higherflow rates in some applications. The concentric completions require special running techniques tomake <strong>and</strong> break joints. The two strings in a conventional dual are the long string (deep zone) <strong>and</strong> theshort string (shallow zone).The packers involved in the multiple completions are frequently customized to the requirements of theindividual well. The packers (Figure 8.35) are usually hydraulic set. Because of the difficulty in rotatingside-by-side dual strings, the pressure set packers are the most popular. Mechanical set packers thatdo not require rotation are also used, especially as the top packer in the multiple packer series. Packersin multiple completions may be either permanent or retrievable. In high pressure or sour gas operations,the selection of a permanent packer is favored’ while in shallower or lower pressurecompletions the retrievables are often used.Sub surface safety valves may still be run <strong>and</strong> common flow control lines are common, Figure 8.36.The larger od of the SSSVs make tool offsets necessary.8-35
Figure 8.33: Conventional dual completionusing side-by side tubing.This approach requires a largecasing string <strong>and</strong> setting oftwo packers. Zones can betreated as Individual wells;however, wireline operationsin the upper zone are usuallylimited because of potentialwrap of the wireline aroundthe tubing string.Figure 8.34: A concentric dual tubingcompletion.Tubingless Completions8-36
SEALSCONESLIPSFlgure8.35: Schematic drawing of a dual completionmechanical packer. Set bycompression <strong>and</strong> released by pickingup the string.(Barn-, Snider, <strong>and</strong> Swafford, SPE, 1990)Figure8.36: SSSVs in a dual completion showing a commoncontrol line.A special case of multiple completions involve the use of so-called “tubingless” completion^.^^*^* Inthese completions, the tubing is cemented in place in the open hole <strong>and</strong> acts as tubing <strong>and</strong> casing.Tubingless completions are restricted to gas or flowing oil wells that do not require workovers on aregular basis. Completing these wells usually requires cementing through the long strings <strong>and</strong> returnof cement to surface. Since there is only one steel barrier, backup with cement must be a part of thedesign. Since both strings are cemented in place, a packer is not used. A device in the short string toorient perforating guns away from the long string is required. Serious problems may require a wellreplacement.Equipment in multiple completions include:8-37
1. Special BOP rams for work over^.^^2. “Y-block” connections allowing ESP use <strong>and</strong> wireline operation^.^^3. Shear release joints or collects on the tubing between the packers for pulling off when the lowerpacker4. Telescoping unions or sliding sleeves for minor adjustments in spacing out tubing during packersetting.5. Blast joints or heavy wall tubing over the tubing across from high velocity productive formationsto limit outside tubing erosion.56y656. Oriented perforating in the short string, to miss the long strings.7. Dual polish bore receptacles in deep wells.668. Special artificial lift as~emblies.~~Selection of a CompletionSelection of a multiple completion is usually made after a detailed examination of the wells deliverability,legal restrictions, operational requirements <strong>and</strong> field experience.’ Tubing <strong>and</strong> annular sizes areselected on the basis of acceptable pressure drops at expected flow rates. In concentric completionsfor example, 2-7/8 in. tubing may be used inside 5 in. tubing for dual strings in a 7 in. casing string.The size of the inner string is selected based upon whether the upper zone or the lower zone is themaximum producer.Conventional multiple completions may be lifted by rods, gas lift or slim hole ESPs, while the intervalsproducing through the annulus in concentric duals are limited to flowing wells that are not prone toheading, deep hydrate formation or deep paraffin deposition. Shallow deposition of hydrates or paraffinscan be controlled in some instances by hot water or hot oil circulation through a small diametertube down the inside or outside of the existing tubing.’ Multiple strings also limit the application ofwireline operations in all but the lower zone of concentric completions. Problems with wireline wrappingaround the pipe preclude its use in upper intervals.MonoboresA monobore completion is a basic, constant i.d. completion that may be well suited for gas completions.Historically, monobore completions are nothing new. Designs that meet one of the basic definitionsof monobores have been seen in the literature into the 1960s <strong>and</strong> a few articles on multiplecompletion strings from the 1950s spotlight use of “tubingless” completions (actually they are casingless)using smooth 2-7/8 in. or 2-3/8 in. tubing, cemented in place. These completions were economicalbut quickly lost favor because of the difficulty of working in these reduced ID wellbores. Theprimary problem in the 1950s was lack of reliable tools <strong>and</strong> methods for circulation, repair <strong>and</strong> plugback.Although technological advances have surmounted many of the problems, the problems ofworking in a small wellbore (friction, sticking, pressure control, miniature tools, etc.) still remain.There are a number of definitions for monobore completions throughout the industry. Monobore completionshave been around since the early 60s <strong>and</strong> maybe even before. The various definitions ofmonobores depend on their application, <strong>and</strong> often times, on the company involved in the work. From asearch of the literature, the following definitions of monobore <strong>and</strong> associated completions areadvanced as a starting point.8-38
True monobore - A true monobore is a well completion configuration in which the productionliner <strong>and</strong> the tubing are the same diameter. The purpose is to provide full bore access to allparts of the well.Decreasing bore monobore - Most monobore completions are decreasing monobore withsmaller bore liners below a larger upper liner. The problems in this type of completion are thevery small work areas <strong>and</strong> the increasing possibility of sticking strings, as wellbore diametersdecrease.Nippleless monobore - A nippleless monobore is a monobore completion without nipple profileswhich extend into the bore of the tubing. Some designers keep a monobore in nippleless formexcept for the nipple required for a wireline retrievable subsurface safety valve. Other designersgo with a tubing retrievable, subsurface safety valve to prevent even this nipple in the string.Slimhole monobore - The slimhole monobore is a hybrid utilizing the technology both of themonobore completion, <strong>and</strong> most generally, the reduced well size concept that uses tighter clearancesin the drilling <strong>and</strong> placement of tubular products. Slimholes can denote either small wellboresor small clearances between the drilled holes <strong>and</strong> the tubular.The primary features of a monobore completion are:1. Production tubing/liners are usually the same diameter throughout the well, or at least, have fullboreaccess to the lower most portions of the liner.2. A true monobore has no permanent diameter restrictions that will limit fullbore access to anypoint of the well.3. The tubular design in all monobores is extremely dependent upon the flowrate both of gas <strong>and</strong> ofliquids expected from the well.The monobore design, while excellent at maximizing rate particularly from gas <strong>and</strong> gas condensatewells, does create a few problems most notably with isolation necessary for intervention <strong>and</strong> somestimulations.Many well workover problems are caused by sticking a tool during workovers, stimulation or gatheringdata. The list of cased hole sticking locations is interesting:differential sticking at perforations (especially in depleted zones where kill fluid weight caused significantoverbalance,liner tops where damage, cement residue or other debris collected <strong>and</strong> caused problems,profiles, especially where wireline or tubing conveyed tools became stuck due to close clearances orto deposits (paraffins, asphaltenes, scales) in the profiles,end of tubing where lack of a tool reentry guide or where misshapen tools (perforating guns) stuck,crossover from one size of tubing to another in a tapered string.The nippleless true monobore eliminates or minimizes many of these problems. Monobores usingmore conventional tubular sizes (4-1/2 in., 5-1/2 in. <strong>and</strong> 7 in.) also can use conventional, provendownhole tools with which service people have more experience.8-39
Coiled Tubing CompletionsCoiled tubing (CT) completions are very similar to conventional completions but offer the advantagesof:1. more rapid deployment; often completed in a few hours,2. less need for a conventional rig - a major asset in offshore, remote, crowded or urban well sites,3. ability to run the entire completion string without killing the well - a major advantage for fluid sensitivewells,4. ability to pull the entire completion, quickly, even under pressure, without a rig.The disadvantages of the technique are ones of equipment cost <strong>and</strong> sizes; both objections aresteadily being reduced.The best c<strong>and</strong>idates for CT completions are those wells where:1. corrosion is minimal,2. lift requirements are within capabilities of the available equipment,3. where conventional rig cost is high,4. where pay zones are sensitive to killing fluids,5. where stimulations (fracturing) have already been done,6. solidsls<strong>and</strong> production to surface is absent.The c<strong>and</strong>idate list is neither complete, nor exclusive. Special conditions such as pressure, tubingmovement, stimulation needs <strong>and</strong> even gravel packing can be h<strong>and</strong>led with the right design.The CT completion string is spooled into the well, Figure 8.34, using mostly conventional CT equipment.The spooling may be stopped to weld in components or bolt on external gas lift valves, but previouslywelded equipment, already spooled reduces running time <strong>and</strong> the shop welding may improve the reliabilityof connections. When equipment must be added in the field, a “window” or entrance point isincluded in the surface rig up between the injector <strong>and</strong> the BOPs.When seal assemblies, Figure 8.35, are run, it is often advantageous to straighten the bottom 10 ft ofthe coil tubing to assist in stabbing the seal assembly.Lift for the CT completion may be by gas lift (internal or external valves), plunger jet pump or electricsubmersible pump (ESP). The plunger lift has been the most common system but the other lift systemshave found successful applications. For horizontal or highly deviated wells; gas lift, jet pumps<strong>and</strong> ESPs have the most promise.Corrosion in CT completions is an unknown. corrosion by CO2 over several years has been noted butreports on other forms of corrosion are not common. The mild steel of most CT strings is both anadvantage (resists cracking) <strong>and</strong> a disadvantage (low initial strength) in some cases. More corrosionresistant alloys are being developed, but cost will undoubtably be a factor in its use.8-40
WIDE ARCHINJECTOR HEADPACK-OFFLUBRICATORCOILED TUBINQ HANQERTUBINQ HANQER8AmY VALVEWITH FLAPPER OPEN(Camco, 1996)Figure 8.34: A typical coiled tubing completion (safety valve for offshore).One potentially sever limitation in an offshore CT completion string is powering the SSSV. The currentmethods of routing hydraulic fluid to a SSSV in a CT string are internal <strong>and</strong> external lines. The internallines can be delivered to the site already in the CT, while the external lines must be attached in thefield <strong>and</strong> run in carefully. There are difficulties in bringing either line through the well head <strong>and</strong> specialconnections are required, Figure 8.36. Designs are underway to use the existing SSSV profile (wherethe existing large tubing is left in the well) <strong>and</strong> spacing out the CT to the profile.<strong>References</strong>1. Laing, C. M., Ogier, M. J., Hennington, E. R.: “Everest <strong>and</strong> Lomond Completion Design InnovationsLower Completion <strong>and</strong> Workover Costs,” SPE 26743, Offshore European Conf., Amsterdam,Sept. 7-10, 1993.2. Hennington, E. R., Smith, lan, MacDougall, I. D., Fordyce, R. S.: “Logging <strong>and</strong> Perforating OperationsUtilizing Coild Tubing in a 25,000 ft MD, High-Angle Well,” SPE 27602, European Prod.Oper. Conf., Aberdeen, March 15-1 7, 1994.3. Ross, B. R., Faure, A. M., Kitsios, E. E., Oosterling, P., Zettle, R. S.: “Innovative Slim-Hole Completions,”SPE 24981, European Pet. Conf, Cannes, Nov. 16-1 8, 1992.4. Robison, C. E.: “Monobore Completions for Slimhole Wells,” SPE 27601, European Prod. Oper.Conf., Aberdeen, March 15-17, 1994.8-41
LUBRICATORLOCATOR SEAL AS825yBLYWrm PUMP OUT PLUQLOCK WITH PBR Am FLAPPER(Carnco, 1996)Figure 8.35: Runnint seal assembly on coiled tubing.5. Tollefsen, S., Grane, E., Svinndal, S.: “Gullfaks Development Provides Challenges,” World <strong>Oil</strong>,May, 1994, p 77-82.6. Gee, N., Brown, S., Mcltardy, C.: “The Development <strong>and</strong> Application of a Slickline RetrievableBridge Plug,” SPE 26742, Offshore European Conf., Aberdeen, Sept. 7-1 0, 1993.7. Vinzent, M., Smith, R.: “New Subsurface Safety Valve Designs for Slimhole/Monobore Completions,”OTC 7885, 1995 Offshore Tech Conf., May, 1995.<strong>References</strong>1. Wilkirson, J. P., Smith, J. H., Stagg, T. O., Walters, D. A.: “Horizontal Drilling Techniques at PrudhoeBay, Alaska,” SPE 15372, 61 st Annual Mtg., New Orleans, October 5-8, 1986.2. Bosio, J. C.: “Horizontal Wells Prove Their Worth,” Pet. Eng. Int. (February 1988), pp. 18-1 9.3. Baldwin, D. D., Royal, R. W., Gill, H. S.: “Drilling High Angle Directional Wells,”4. Hardrnan, P.: “Beckingham 36 Horizontal Well,” SPE 15895, SPE European <strong>Petroleum</strong> Conference,London, October 20-22, 1986.8-42
COwlliOL U#C O W TUBHQ(Camco, 1996)Figure 8.36: The SSSV control line connection at surface.5. Jourdan, A. P., Baron, G.: “Elf Drills 1 OOO+ ft Horizontally,” Pet. Eng. Int. (September 1981),pp. 51-52, 56, 58.6. Prevedel, B.: “New Techniques in Horizontal <strong>and</strong> Drainhole Drilling Optimization: Lehrte 41 LateralDrilling Project,” SPE 15694, Fifth SPE Middle East <strong>Oil</strong> Show, Manama, Bahrain, March 7-10, 1987.7. Moore, S. D.: “High Angle Drilling Comes of Age,” Pet. Eng. Int. (February 1987), pp. 18-20, 22.8. Dussert, P., Santoro, G., Soudet, H.: “A Decade of Drilling Pays Off In Offshore Italian <strong>Oil</strong> Field,”<strong>Oil</strong> <strong>and</strong> <strong>Gas</strong> J., Feb. 29, 1988, p. 33, 34,36; 37, 39.9. Moore, S. D., ed.: “Making New Production Technology Work for You,” Pet. Eng. Int., Jan. 1988,pp. 20-21.10. Markle, R. D.: “Drilling Considerations in Designing a Shallow Horizontal Well at Norman Wells,”N.W.T., Canada SPE/IADC 161 48, SPEIIADC Drilling Conference, New Orleans, March 15-1 8,1987.11. Bezaire, G. E., Markin, I. A.: “Esso Resources Horizontal Hole Project at Cold lake,” CIM Paper79-30-1 0, Banff, May 8-1 1, 1979.12. , “Getting to the Bottom with Slant-Hole Logging Tools,” Pet. Eng. Int. (February 1988),pp. 32-34.13. de Montigny, O., Combe, J.: “Horizontal Well Operations, pt. 3, Hole Benefits, Reservoir TypesKey to Profit,” <strong>Oil</strong> & <strong>Gas</strong> J. (April 11, 1988), pp. 50-54, 56.8-43
14.Fuh, G. F., Whitfill, D. L., Schuh, P. R.: “Use of Borehole Stability Analysis for Successful Drillingof High-Angle Hole,” IADC/SPE 17235, presented at IADC/SPE Conference, Feb. 28-March 2,1988.15.16.17.18.19.20.21.22.23.24.25.26.27.28.29.30.31.Bradley, W. B.: Failure of Inclined Boreholes,” J. of Energy Resources Tech., Trans. of ASME.,1979, pp. 232-239.Adams, N.: “How to Control Differential Pipe Sticking,” Pet. Eng. Int. (Sept. 1977).Wilson, M. A., Sabins, F. L.: “A Laboratory Investigation of Cementing Horizontal Wells,” SPE16928, 62nd Annual Mtg., Dallas, September 27-30, 1987.Hudson, T. D., Martin, J. W.: “Use of Low-Density, Gravel Pack Material Improves PlacementEfficiency,” SPE 171 69, Formation Damage Symp., Bakerfield, Feb. 8-9, 1988.Shryock, S. G.: “Gravel-Packing Studies in a Full-scale Deviated Model Wellbore,” J. Pet.Tech., March 1983, pp. 603-609.Elson, T. D., Darlington, R. H., Mantooth, M. A.: “High-Angle Gravel-Pack Completion Studies,”J. Pet. Tech., Jan. 1984, pp. 69-78.Toney, J. B.: “New Perforator Enhances Gravel-Pack Completions,” World <strong>Oil</strong>, Dec. 1986,pp. 40-44.Strubhar, M. K., Fitch, J. L., Glenn, E. E., Jr.: “Multiple Vertical Fractures From an Inclined Wellbore- A Field Experiment,” JPT (May 1975), pp. 641-647.Houghton, C. J., Westermark, R. V.: “North Sea Downhole Corrosion: Identifying the Problem;Implementing the Solutions,” J. Pet. Tech. (Jan. 1983), pp. 239-246.Giger, F. M.: “Analytic 2-D Models of Water Cresting Before Breakthrough for Horizontal Wells,”SPE 15378, 61st Annu. Mtg., New Orleans, Oct. 5-8, 1986.Giger, F. M.: “Horizontal Well Production Techniques in Heterogeneous Reservoirs,” SPE 1371 0,Mid East <strong>Oil</strong> Conf., Bahrain, March 11 -1 4, 1985.Joshi, S. D.: “Augmentation of Well Productivity Using Slant <strong>and</strong> Horizontal Wells,” SPE 15375,61st Annual Mtg., New Orleans, October 5-8, 1986.Joshi, S. D.: “A Review of Horizontal <strong>and</strong> Drainhole Technology,” SPE 16868, presented at 62ndAnnual Tech. Mtg., Dallas, Sept. 27-30, 1987.Sherrard, D. W., Brice, B. W., MacDonald, D. G.: “Application of Horizontal Wells at PrudhoeBay,” SPE 15376, 61 st Annual Mtg., October 5-8, 1986, New Orleans.Cinco, H., Miller, F. G., Ramey, H. J., Jr.: “Unsteady-state Pressure Distribution Created by aDirectionally Drilled Well,” J. Pet. Tech., (Nov. 1975), 1392-1402.Matthews, C. S.: “Steamflooding,” Journal of <strong>Petroleum</strong> Technology, (March 1983) 465-471.Konopnicki, D. T.; Traverse, E. F.; Brown A. <strong>and</strong> Deibert, A. D.: “Design <strong>and</strong> Evaluation of theShiells Canyon Field Steam-Distillation Drive Pilot Project,” Journal of <strong>Petroleum</strong> Technology,(May 1979) 546-552.8-44
32. Moss, J. T., White, P. D., McNeil, J. S.: “in-Situ Combustion Process-Results of a Five WellExperiment in Southern Oklahoma,” J. Pet. Tech., (April 1959) pp. 55-64.33. Gates, C. F., Ramsey, H. J., Jr.: “Field Results of South Belridge Thermal Recovery Experiment,”Trans., AIME, (1958), 213, 236-44.34. White, P. D.: “In-Situ Combustion Appraisal <strong>and</strong> Status,” Journal of <strong>Petroleum</strong> Technology,(November 1985) 1943-1 949.35. Chu, Chieh: “Current In-Situ Combustion Technology,” Journal of <strong>Petroleum</strong> Technology,(August, 1983) 141 2-1 41 8.36. Lerner, S. L.; Fleming, G. C. <strong>and</strong> Lara, P. F.: “Dominant Processes in In-Situ Combustion ofLight-<strong>Oil</strong> Reservoirs,” Journal of <strong>Petroleum</strong> Technology, (May 1985) 889-900.37. Schirmer, R. N. <strong>and</strong> Eson, R. L.: “A Direct-Fired Downhole Steam Generator-From Design toField Test,” Journal of <strong>Petroleum</strong> Technology, (October 1985) 1903-1 908.38. DePriester, C. L. <strong>and</strong> Pantaleo, A. J.: “Well Stimulation by Downhole <strong>Gas</strong>-Air Burner,” Journal of<strong>Petroleum</strong> Technology, (December 1963) 1297-1 302.39. Singhal, A. K. <strong>and</strong> Card, C. C.: “Monitoring of Steam Stimulation in the McMurray Formation,Athabasca Deposit, Alberta,” Journal of <strong>Petroleum</strong> Technology, (April 1988) 483-490.40. Briggs, P. J.; Baron, R. P.; Fulleylove, R. J. <strong>and</strong> Wright, M. S.: “Development of Heavy-<strong>Oil</strong> Reservoirs,”Journal of <strong>Petroleum</strong> Technology, (February 1988) 206-21 4.41. Underdown, D. R. <strong>and</strong> Das, K.: “Stability of Gravel-Packing Materials for Thermal Wells,” Journalof <strong>Petroleum</strong> Technology, (November 1985) 2006-201 2.42. Reed, M. G.: “Gravel Pack <strong>and</strong> Formation S<strong>and</strong>stone Dissolution During Steam Injection,” Journalof <strong>Petroleum</strong> Technology, (June 1980) 941-949.43. Carden, R. S., Nicholson, R. W., Pettitt, R. A. <strong>and</strong> Rowley, J. C.: “Unique Aspects of Drilling <strong>and</strong>Completing Hot, Dry Rock Geothermal Wells,” Journal of <strong>Petroleum</strong> Technology, (May 1985)821 -834.44. Davis, J. S., Fanaritis, J. P.: “Insulated Tubing Can Cut Wellbore Heat Losses,” <strong>Oil</strong> & <strong>Gas</strong> J.(Mar. 1, 1982) 86, 91 -96.45. Pacheo, E. F., Farouq Ali, S. M.: “Wellbore Heat Losses <strong>and</strong> Pressure Drop in Steam Injection,”J. Pet. Tech. (Feb. 1972), pp. 139-144.46. Giusti, L. E.: “CVS Makes Steam Soak Work in Venezuela Field,” <strong>Oil</strong> & <strong>Gas</strong> J. (Nov. 4, 1974), 89-93.47. Willhite, G. P., Dietrich, W. K.: “Design Criteria for Completion of Steam Injection Wells,” J. Pet.Tech. (Jan. 1967), 15-2148. Earlougher, R. C.: “Some Practical Considerations in the Design of Steam Injection Wells,” J.Pet. Tech. (Jan. 1969) 79-86.49. Cain, J. E., Shryock, S. H., Carter, G.: “Cementing Steam Injection Wells in California,” JPT,(April, 1966), pp. 431-436.8-45
50. Holliday, G.H.: “Calculation of Allowable Maximum Casing Temperature to Prevent Tension Failuresin Thermal Wells”, ASME <strong>Petroleum</strong> Mechanical <strong>Engineering</strong> Conference, Tulsa, Sept. 21 -25, 1969.51. Willhite, G. P., Dietrich, W. K.: “Design Criteria for Completion of Steam Injection Wells,” J.P.T.,(Jan., 1967) pp. 15-21.52. Bleakley, W. B.: “Steamed Wells Need Good Completions,” O.&G.J., (April 4, 1966), pp. 136-138.53. Gates, C. F., Holmes, B. G.: Thermal Well Completions <strong>and</strong> Operations,’’ Seventh World <strong>Petroleum</strong>Congress, Paper PD-1 l, Mexico City, (1967).54. Eilers, L. H.: “High-Temperature Cement Compositions-- Pectolite, Scawtite, Truscottite, orXonotlite: Which do you want,” Journal of <strong>Petroleum</strong> Technology, (July 1983) 1373-1 377.55. Milligan, M. R.: “Sour <strong>Gas</strong> Well Completion Practices in the Foothills, Western Canada,” J. Pet.Tech. (Sept. 1982), p. 2113.56. Buzard, L. E., Jr., Kastor, R. L., Bell, W. T., DePriester, C. L.: “Production Operations Course 1 -Well Completions,” SPE Video Tape Cours Course Notes, 1972.57. Badon, H. B., Nellis, W. E.: “Multiple Packer Completions in the Attaka Field,” SPE 5975.58. ,: “Humble Runs 3 Strings of 4-1/2-lnch Pipe in One Hole,” World <strong>Oil</strong>, (March 1966),p. 57.59. Enloe, J. R.: “Amerada Finds Using Multiple Casing Strings Can Cut Costs,” <strong>Oil</strong> <strong>and</strong> <strong>Gas</strong> J.,(June 12, 1967), p. 76.60. Othman, M. E.: “Review of Dual Completion Practice for Upper Zakum Field,’ SPE 15756, MidEast <strong>Oil</strong> Show, Manama, Bahrain, March 7-1 0, 1987.61. Singh, I.: “Study Shows Dual Completion Aids Productivity, Controls Water Coning,” <strong>Oil</strong> <strong>and</strong> <strong>Gas</strong>J., (July 7, 1975), p. 45.62. Lewis, K. W.: “Use of Vent Strings in Artificially Lifted Wells,” SWPSC, Lubbock.63. Nance, J. G.: “Dual Suspension <strong>and</strong> Sealing Rams for Use in a Blowout Preventer,” OTC 5578,Houston, April 27-30, 1987.64. Moradi, S. C.: “An Innovative Single Completion Design with “Y-Block” <strong>and</strong> Electrical SubmersiblePump for Multiple Reservoir,” OSEA 881 63, Offshore Southeast Asia Conf., Singapore, 2-5Feb 1988.65. Webster, K. R., O’Brien, T. B.: “Deep Duals Simplified,” SPE 3904, SPE Deep Drilling Symposium,Amarillo, Sept. 11 -1 2, 1972.66. Moring, J. D.: “How Skelly H<strong>and</strong>les Deep Duals at Warwink,” Pet. Eng. Intl., (Dec 1974), p. 66.67. Lambie, D. A., Walton, R.: “<strong>Gas</strong> Lift in Multiple Completed Wells,” SWPSC, Lubbock, pp. 101.68. Yew, C. H., Li, Y.: “Fracturing of a Deviated Well,” SPE 16930, 62nd Annual Mtg., Dallas,September 27-30, 1987.8-46
69.70.71.72.73.74.75.76.77.78.79.80.81.82.83.84.85.Daneshy, A. A., “A Study of Inclined Hydraulic Fractures,” J. Pet. Tech., 1973, pp. 61-68.Hsiao, C.: “A Study of Horizontal Wellbore Failure,” SPE 16927, 62th Annual Mtg., Dallas,September 27-30, 1987.Terzaghi, K. van: “Die Berechnung der Durchlassigkeitsziffer des Tones aus dem Verlauf derHydrodynamischen Spannungserscheinungern,” Sber Akad, Wiss, Wien, (1 923), 132, 105.Roegiers, J. C.: “Elements of Rock Mechanics,” from the book Reservoir Stimulation, Economides,M. J., <strong>and</strong> Nolte K. G., Schlumberger, 1987.Parcevaux, P.: “Guides Emerge for Cementing Horizontal Strings,” O.G.J., Oct. 19, 1987, pp. 35-41.Gavignet, A. A., Sobey, I. J.: “A Model for the Transport of Cuttings in Highly Deviated Wells,”SPE 15417, 61st Annual Mtg., New Orleans, October 5-8, 1986.Martin, M., <strong>George</strong>s, C., Bisson, P., Konirsch, 0.: “Transport of Cuttings in Directional Wells,”SPEAADC 16083, 1987 SPEAADC Mtg., New Orleans, March 15-1 8.Reiley, R. H., Black, J. W., Stagg, T. O., Walters, D. A., Atol, G. R.: “Cementing of Liners in Horizontal<strong>and</strong> High-Angle Wells at Prudhoe Bay, Alaska,” SPE 16682, 62nd Annual Mtg., Dallas,Sept. 27-30, 1987.Crook, R. J., Keller, S. R., Wilson, M. A.: “Solutions to Problems Associated with Deviated WellboreCementing,” SPE 141 98, 60th Annual Mtg., Las Vegas, Sept. 22-25, 1985.Zurdo, C., <strong>George</strong>s, C.: “Mud <strong>and</strong> Cement for Horizontal Wells,” SPE 15464, 61 st Annual Mtg.,New Orleans, October 5-8, 1986.Kolthoff, K. W., Scales, G. H.: “Improved Liner Cementing Techniques for Alaska’s Prudhoe BayField,” SPE 10756, Calif. Reg. Mtg., March 1982.Dickinson, W., Anderson, R. R., Dickenson, W.: “Gravel Packing of Horizontal Wells,” SPE16931, 62nd Annual Mtg., Dallas, September 27-30, 1987.Addington, D. V.: “An Approach to <strong>Gas</strong> Coning Correlations for the Prudhoe Bay Field,’’ SPE8332, 54th Annual Mtg., Las Vegas, Sept. 23-26, 1979.Giger, F. M.: “Low Permeability Reservoirs Development Using Horizontal Wells,” SPE 16406,Low Perm Reservoir Symposium, Denver, May 18-19, 1987. 067. Van Der Vlis, A. C., Duns, H.,Luque, R. F.: “Increasing Well Productivity in Tight Chalk Reservoirs,” Proceedings of theTenth World <strong>Petroleum</strong> Congress. Vol. 3, Bucharest, Hungary (1979) 71-78.Jourdan, A. P., Baron, G.: “Horizontal Well Proves Productivity Advantages,” Pet. Eng. Int.(October 1984), pp. 23-25.Stramp, R. L.: “The Use of Horizontal Drainholes in the Empire Abo Unit,” SPE 9221, 55thAnnual Mtg., Dallas, September 21-24, 1980.Reiss, L. H.: “Horizontal Wells - Production after Five Years,” SPE 14338, 60th Annual Mtg., LasVegas, September 22-25, 1985.8-47
86.87.88.89.90.91.92.93.94.95.96.97.98.99.Ertekin, T., Sung, W., Schwerer, F. C.: Production Performance Analysis of Horizontal DrainageWells for the Degasification of Coal Seams,” JPT (May 1988), pp. 625-632.Pratts, M.: “Effect of Vertical Fractures on Reservoir Permeability - Incompressible Fluid Case,”SPEJ, (June 196l), 105-1 18.Aadnoy, B. S.: “Modelling of the Stability of Highly Inclined Boreholes in Anisotropic Rock Formations,”SPE 16526, presented at Offshore Europe 87, Aberdeen, Sept. 1987.Giger, F. M., Reiss, L. H., Jourdan, A. P.: “The Reservoir <strong>Engineering</strong> Aspects of Horizontal Drilling,”SPE 13024, 59th Annual Mtg., Houston, September 16-1 9, 1984.Muskat, M.: “The Flow of Homogeneous Fluids Through a Porous Media,” IHRDC, Boston(1937).Law, B. E., Rice, D. D.: “Hydrocarbons from Coal,” AAPG Studies in Geology #38, 1993,Chapter 15, by R. A. Schraufnagel.Law, B. E., Rice, D. D.: “Hydrocarbons from Coal,” AAPG Studies in Geology #38, 1993,Chapter 12, by T. L. Logan.Law, B. E., Rice, D. D.: “Hydrocarbons from Coal,” AAPG Studies in Geology #38, 1993,Chapter 9, by D. Yee, J. P. Seidle, W. B. Hanson.Law, B. E., Rice, D. D.: “Hydrocarbons from Coal,” AAPG Studies in Geology #38,1993,Chapter 5, by J. C. Close.Law, B. E., Rice, D. D.: “Hydrocarbons from Coal,” AAPG Studies in Geology #38, 1993,Chapter 13, by P. L. Scholes <strong>and</strong> D. Johnston.Law, B. E., Rice, D. D.: “Hydrocarbons from Coal,” AAPG Studies in Geology #38, 1993,Chapter 14, by I. D. Palmer, S. W. Lambert, J. L. Spitler.Boyer, C. M., Reeves, S. R.: “A Strategy for Coalbed Methane Production Development Part Ill:Production Operations,” 1989 Coalbed Methane Symposium, University of Alabama, Tuscaloosa.Holditch, S. A.: ‘Completion Methods in Coal Seam Reservoirs,” SPE 20670, 65th Annual Meeting,New Orleans, LA, Sept. 23-26, 1990.Palmer, I. D., Mavor, M. J., Spitler, J. L., Seidle, J. P., Volz, R. F.: “Openhole Cavity COmpletionsin Coalbed Methane Wells in the San Juan Basin,” JPT, Nov. 1993, p. 1072-1 080.100. Seidle, J. P.: “Long-Term <strong>Gas</strong> Deliverablility of a Dewatered Coalbed,” JPT, June 1993,p. 564-569.101. Palmer, I. D.: “Review of Coalbed Methane Well Stimulation,” SPE 22395, International Mtg.,Beijing, China, March 24-27, 1992.102. Themig, D.: Planning <strong>and</strong> Evaluation are Critical to Multi-lateral Wells,” Pet. Eng. Int., Jan. 1996.103. Rowan, M. C., Whims, M. J.: “Multi-lateral Well Enhances <strong>Gas</strong> Storage Deliverability,” 0. & G. J.,Dec. 25, 1995.8-48
104. Brockman, M.: “Multi-lateral Completions Prepare to Take Off,” Pet. Eng. Int., Jan. 1996.105. Hall, S. D.: “Multi-lateral Horizontal Wells Optimize a Utah Five-Spot Waterflood,” Pet. Eng. Int.,May 1996.106. Comeau, L., Pustany K. R., Smith, R., Giles, I.: “Lateral Tie-Back System Increases ReservoirExposure,” World <strong>Oil</strong>, July 1995.8-49
Appendix 8.A - Special Horizontal Well OperationsLoggingRunning wireline conveyed tools in a deviated well on tubing or drill pipe requires a special couplingknown as a side entry sub. In wells past about 55 degrees, gravity will often not overcome the effectsof friction of the tool on the side of the hole <strong>and</strong> the logging tools will not slide into the deviated sections.In these cases, the tools have to be pushed by tubing into the deviated sections of the well.Once the tools are at the end of the section to be loaded, they can be retrieved by wireline to make asmooth log at a constant pulling speed. To keep the pipe out of the way during retrieval of the tools,the side entry sub is needed. Since a wireline connection is still needed for tool readout, a way isneeded to have a wireline connection through the tubing while allowing the tools to be pulled alongcontinuously by wireline rather than by the jerky motions required by breaking out pipe connectionswhen removing tubing. To allow this wireline movement, the wireline logging cable runs down theannulus from the top of the well between the tubing <strong>and</strong> the casing for several joints of pipe. At tileside entry sub, the cable enters the inside of the pipe <strong>and</strong> runs to the tools at the bottom of the string.The pipe provides the force necessary to push the tools along the deviated section while running in. Atthe furthest point to be logged, the tools are pumped out of the tubing <strong>and</strong> the tubing is withdrawn to apoint where the side entry sub is near the surface. The wireline pulled tools can then be retrievedwhile logging until the tools are pulled into the tubing. Another logging procedure when using a sideentry sub, is to run to bottom with the tool on tubing <strong>and</strong> log up by pulling tubing until the side entrysub returns to the surface. The cable is then unlatched from the side entry sub <strong>and</strong> removed permittingthe rest of the drill pipe <strong>and</strong> logging tools to be tripped out of the well.There are two options for protecting the logging tools from the weight of the drilling string or tubingstring during running-in the well. In the first option, a compression sub with a certain amount of strokecan be placed at the bottom of the tool string <strong>and</strong> a compression sensor placed above the logging tool.St<strong>and</strong>ard logging tools may be used without a protective sleeve surrounding the tool. When the wirelineis connected <strong>and</strong> the logging tools are powered, any downhole tool compression is indicated atthe surface. This information may be tied to an alarm system to alert the driller when the bottom of thehole is reached. The driller then has a reaction time of the distance of the compression sub to stop thestring before the entire weight of the string is on the tools. Pad-type tools, which ride the low side ofthe pipe, can be used with a swivel in the tool string to decouple the drill pipe torque from the toolstring. The second option for protecting logging tools involves the use of a protective sleeve thatincreases the compressional strength of a tool string. The sleeve is usually constructed from nonconductivefiberglass or metal casing with windows cut out around pad type devices. In this case, tool orientationmust be measured <strong>and</strong> drill pipe rotated to make sure that the pad tools ride the low side ofthe pipe.Stress in an Deviated WellWith the application of three dimensional elastic theory, Yew <strong>and</strong> Li68 analyzed the deviated well <strong>and</strong>derived a set of formulas for stress components around the hole. They found that when fractures areinitiated at the deviated wellbore, they would leave the plane of the wellbore <strong>and</strong> align with the planeof a fracture preferred by the stresses in the formation. This is consistent with the findings ofDane~hy.~'Assuming that the rock medium has a tensile failure stress 2, fracturing will initiate at the inner surfaceof the wellbore when the maximum tensile stress at the rock surface reaches this value. Yew <strong>and</strong> Lipresent their information in a coordinate system <strong>and</strong> a coordinate transformation <strong>and</strong> solve forstresses. The stress components around the wellbore with r= R, are:CJ~, = - 20,sin8 + 20,cos8where:8.A-50
oqz = principle stress on the surface of the wellbore8 = position of the initial fracturex,y,z = Cartesian coordinate valuesoxz <strong>and</strong> ay = in situ stress<strong>and</strong> the maximum tensile stress has a form:Hsiao” also predicted fracture initiation through work on the stresses necessary for failure in a horizontalwell. Borehole tensile failure through fracturing was predicted to occur if one of the principienormal stresses induced on the borehole wall exceeded the tensile strength of the formation. Thestresses are increased by increasing the pressure. When the maximum tensile stress reaches the tensilestrength of the formation, fracturing will occur. Fracturing may be beneficial in the form of a stimulationor very detrimental in the form of lost circulation from drilling or workover operations.For a full underst<strong>and</strong>ing of wellbore stability, several stresses in the formation must be known. Theseinclude: (1) the stress in the formation before drilling the hole (in situ stress), (2) the additional loadupon the formation caused by the hole, (3) how the overburdened load on the rock is affected by mudpressure, (4) the strength of the rock, <strong>and</strong> (5) how the mud chemically affects the strength of the rock.Obviously, in most formations, many of the data needed will only be estimations.Formations are classed in terms of in situ stresses as being either normally stressed or tectonicallystressed. In the normally stressed region, the maximum in situ stress, 03, is vertical <strong>and</strong> is equal to theoverburden stress. Also, the other two principal in situ stresses, o1 <strong>and</strong> 02, which are located in thehorizontal plane are nearly equal. For well compacted <strong>and</strong> cemented formations, the overburdenstress varies linearly with depth. The value routinely reported for this gradient is approximately equalto 1 psi/ft (22.6 kPa/m) although variances are common. In almost all active oil-producing formations,the overburden gradient will vary with depth. This assumes that the full or nearly full overburden issupported by all layers of sediment down to the basement rock. Conditions such as grabens <strong>and</strong> faultswill alter these conditions.Besides in situ stresses, the other additional stress that must be considered is pore pressure. Theeffective stress concept proposed byTerzaghi7’ used pore pressure, p, as an opposing force to the total applied stress o to give an effectivestress 6’. The relationship was simplistic:<strong>and</strong> was later modified by H<strong>and</strong>in23 to0’ = 0-pwhere a, the poroelastic constant, varies between 0 <strong>and</strong> 1, describing the conditions of no pore pressuresupport (very strong cementation) to total pore pressure exerted (very weak cementation),respectively. The poroelastic constant is related to the Poisson’s ratio, v, before initial production(undrained), <strong>and</strong> the Skempton pore-pressure ~oefficient:~~8.A-51
a=3 (y+J)S(1-2u) (1 +v,)Typically, for petroleum reservoirs, a is about 0.7.Well Completion ProblemsIncreased problems with placement of cement <strong>and</strong> solids removal after drilling operations can besolved in most formations by very careful application of currently available technology, but areas forimprovement definitely exist. Removal of solids, cuttings, <strong>and</strong> mud prior to the cement job are criticalto obtaining a good primary cementing operation.Parceva~x~~ divides the cementing decisions into two categories. Properly located drain holes thatextend through only one pay do not need to be cemented. It may be completed open hole or a linermay be used if hole stability is a problem. If hole collapse is a problem, heavier casing should beused. Extended reach holes that may pass through several formations need to have zone isolation forproper production control. These wells usually involve two strings, both of which may need to becemented. The first string, an intermediate string, is usually deviated up to 80". The second string,probably a long liner, is deviated 50" to 90". The intermediate casing string should pass through thezones that must be isolated.Centralizing the casing in the well is critical to the success of the cementing operation. Mud <strong>and</strong> cuttingsare easier to remove in well centralized (> 67% API st<strong>and</strong>off) casing <strong>and</strong> almost impossible inpoorly centralized casing (c 30% API st<strong>and</strong>off). Casing centralization is very difficult when the deviationangle is high, because of the increased load on the centralizers. Casing centralization becomesmore difficult when a high density cement slurry is in the pipe <strong>and</strong> a lighter mud is in the annulus. Casingst<strong>and</strong>off will be increased by reducing the density differential between the cement <strong>and</strong> the mud.The number of centralizers will increase with the increasing angle of deviation. Wells over 50" willrequire closer spacing <strong>and</strong> probably will require full body centralizers.The cementing successes in detailed in the literature at the present time deal with using large diameterdrillpipe <strong>and</strong> high velocity flow of drilling mud up the annulus. The flow rate required is the minimumvelocity necessary to carry the cuttings at the particular deviation <strong>and</strong> mud condition present inthe well.Prior to the casing job, the deviated holes may contain more cuttings <strong>and</strong> solids than in a conventionalThe reason is the existence of three separate inclination regions with different levels of holecleaning requirements: 0°-45", 45"-55", <strong>and</strong> 55"-90". Region 1 (0"-45") is conventional <strong>and</strong> is h<strong>and</strong>ledin the normal fashion with cutting removal dictated by st<strong>and</strong>ard lift equations for vertical wells.Region 2 (45'455") presents a different cleaning problem since cuttings will accumulate on the lowside of the hole <strong>and</strong> may slide down the wellbore into the start of the high angle section of the well.Cleaning in this region is best accomplished by higher viscosity fluids <strong>and</strong> turbulence of the liftingfluid. In region 3 (55"-90°), there is less tendency for the cuttings to slide, especially near horizontal,although accumulation of cuttings may be severe. Although several studies have shown the benefitsof hole sweep using various rates <strong>and</strong> gelled fluid stages, field practice has indicated that hole cleaningof horizontal wells is very difficult. The most successful method known at this time is reverse circulation.Successful use of all the benefits of the horizontal hole hinge on obtaining successful zone isolationthrough a good primary cement job. Simultaneous reciprocation <strong>and</strong> rotation of the pipe, (using arotating head <strong>and</strong> other special equipment) plus pipe centralization, flushes <strong>and</strong> critical flow rates arenecessary. Some companies have used cement filled formation packers in the horizontal section toapproach centralization <strong>and</strong> zone isolation problems, Figure 8.35.28976 This practice allows the sepa-8.A-52
ation of areas of the formation for multiple fracturing jobs, although it is not a perfect solution sinceproblems have been reported with leakage around the packers.Successful primary cementing in wells over about 50" becomes increasingly sophisticated, requiringpipe movement, close centralizer spacing <strong>and</strong> techniques of improving mud displa~ement.~~,~~-~~Liner movement was found by Reiley, et al., to be a critical part of a successful cementing job. Polymerplugs have also been used in the open hole sections to control pressure <strong>and</strong> flow during cementing.The removal of cuttings <strong>and</strong> cleaning of the hole is critical before <strong>and</strong> during the cementing operation.This cleaning is made much more difficult in deviated holes by the natural tendency of the pipe to buryinto the wall.Centralizer spacing in these wells will depend on the competency of formation, the weight of the pipe,the angle of deviation, type of fluid <strong>and</strong> other factors.34i4Productivity EstimatesEstimates of productivity of a nonfractured, deviated well in comparison to a nonfractured vertical wellrange from less than one-fold to over eight-fold, depending upon angle of deviation through the pay,well spacing, the thickness of the formation, vertical permeability, presence of vertical permeabilitybarriers, <strong>and</strong> the extension of the horizontal segment of the well into the formation.80~18*81~26 Theseverity of the impact of vertical permeability on the productivity of a horizontal well is presentedgraphically in Figure 8.36. As vertical permeability decreases below about 50% of the horizontal permeability,the advantage of the horizontal well begins to drop noticeably. In very thick sections, theadvantage also decreases. For increasing extension, vertical permeability, <strong>and</strong> spacing, the productivitybenefits increase, while increasing pay thickness limits the effectiveness of the horizontal completion,especially for low ratios of vertical to horizontal permeability. Laminated zones or other verticalpermeability barriers limit the usefulness of the horizontal completion because they change the drainagepattern of the well. Special cases for low permeability wells are being promoted8* but the processis untried. The horizontal well may ultimately be tested as a base for hydraulic fracture processing of atight well.Actual production comparisons between horizontal wells <strong>and</strong> unstimulated vertical wells are on therange of 1-1/2 to 3, although several authors maintain that as horizontal well completion technologyimproves, this comparison may rise into the six- to eight-fold increase regi~n.~*~~p~Inflow performancecomparison between horizontal <strong>and</strong> vertical wells in comparable north slope wells are shown inFigure 8.37.Long-term evaluations (five years) of horizontal well production have been published along withdetailed observations about intersections of horizontal wellbores with high capacity natural verticalfractures <strong>and</strong> changes in geology.85 These evaluations of long-term production from horizontal wellshave shown that the wells are very useful in improved processing (sweep) over st<strong>and</strong>ard vertical completionsin some reservoirs with relative high vertical permeability.86Special production cases involving fractured formations such as coals have shown that well placementrelative to formation parameters, e.g., boundaries <strong>and</strong> fractures. In numerical simulations,Ertekin, et al.,87 demonstrated that the placement of horizontal wells in thick coal seams could drasticallyaffect water <strong>and</strong> gas rate. Also demonstrated was a need to place the borehole orthogonal (atright angles) to the fracture system to maximize production.The reasons for the improved productivity benefits from the horizontal hole in homogeneous formationswith high vertical permeabilities are related to the reservoir drainage pattern. The horizontal welldrains an ellipse around the wellbore as opposed to the upright, short, cylindrical volume processed8.A-53
y a vertical The flow <strong>and</strong> pressure gradients are different from the vertical case <strong>and</strong>, in somecases, the horizontal well may be used for changing the sweep or processing of a recovery flood or tocontrol gas or water coning. In cases of very thick pays, multiple horizontal completions may be usedto drain or in some cases to vertically flood the reservoir. In the case of short drain holes in a symmetricalpattern around a single vertical (unfractured) well, the productivity is estimated to be 1 to 8 timesthe vertical well productivity depending on horizontal well extension <strong>and</strong> number of drain holes.27Many factors such as reservoir barriers <strong>and</strong> channels can decrease these optimistic estimates.The concept of effective wellbore radius introduced by PramM for deviated <strong>and</strong> fully horizontal holesare also useful for comparison of the effects of fractures <strong>and</strong> other factors which change the naturalmatrix flow resistance toward the wellbore. In his analysis, a vertical fracture extending over the fullheight of a reservoir can be replaced by an imaginary circular borehole with an effective wellboreradius large enough to give the same production rate as the fracture under the same producing conditions.When skin factor, s, from a buildup test or other analysis, is known, the effective wellbore radius,r, is:Van der Vlis8' modifies the concept from Pratts to give effective wellbore radius, rweff, for deviatedholes.where:L = length of horizontal sectionh, = reservoir heighth = fracture heightg = vertical distance between center of fracture <strong>and</strong> center of reservoir heightThe equation is valid for (h, - h) I 2L.The effective wellbore radius can be used to predict production <strong>and</strong> to compute the expected yield offractures. The production rate, Q, is related to rw,efby:27ckh, [ P, - Pw]'w, effwhere:kppe= reservoir perm= produced fluid viscosity, cp= pressure at the external boundary
pwre= bottomhole flowing pressure= external boundary radiusThe equation is valid for re > ~l,,fi The drainage area of the horizontal well is elliptical <strong>and</strong> the axis, a<strong>and</strong> b, of the ellipse in a homogeneous media are= -(a+@ 1re 2mdL2 = a2-b2A comparison of actual inflow performance curves of horizontal <strong>and</strong> vertical wells was shown previously.Using this data, flow rates improvements of 2 to 3 fold are noted at the same drawdown. This isconsistent with other reports of horizontal wells showing actual productivities of 2 to 3 fold over verticalwells but much less than the 5 to 6 projected by theory. The difference in productivity between theoretical<strong>and</strong> actual may be at least partially explained by the differences in vertical <strong>and</strong> horizontalpermeabilities dictated by the bedding planes of the formation. These bedding planes, as illustrated byAadnoygo in Figure 8.38, offer a glimpse at the way flow restrictions in the form of bedding planes maybe oriented around a deviated well.Productivity Index of a horizontal well from Giger in SI units, is:For PI of a horizontal wheel, in ft, bbl, day, psi, md, cp, <strong>and</strong> base 10 logs, the formula is:kL 1PI, = 0.0145- P1+ 1- -j- hFor Plof a horizontal well, in M, M3, day, bar, md, cp <strong>and</strong> base 10 logs, the multiplier is 0.0233 insteadof 0.0145.For comparison, the Productivity Index for a vertical well is:8.A-55
2nkh 1PI, = -The ratio of Pld Plw valid in any consistent system of units, isIn19 m+bln(1- -L L 2nrwH h )0..where:k = permeability of matrixh = thickness of the reservoirL = length of the horizontal section in the payre = radius of the well's reservoir drainage arear, = radius of wellborep = viscosity of the produced fluidThe equation, from Joshi, to predict oil production is:Q, =where:Qk,App8,aL=flow rate= permeability to oil, darcy= pressure differential= produced fluid viscosity, cp= formation volume factor, dimensionless= half the major axis of a drainage ellipse= horizontal section length,8.A-56
The preceding equations treatment of permeability recognize only a single value, <strong>and</strong> thus are onlyaccurate when the vertical permeability <strong>and</strong> the horizontal permeability are the same. In the event ofk, less than kh, the productivity of the horizontal well decreased. In the rare case of kvgreater than k,,,productivity is increased. By using M~skat's~~ average reservoir permeability B =equation becomes:G-k k , Joshi's8.A-57
Chapter 9: PerforatingThe objective in perforating is to place open perforations at the correct depth that extend through thecasing <strong>and</strong> cement into the formation. To be effective, the perforation tunnel must be in contact with apermeable part of the formation <strong>and</strong> not be damaged by any mechanism that would stop or impedethe transfer of fluids between the formation <strong>and</strong> the wellbore. Perforations are holes through the casingto allow entry of fluids <strong>and</strong> may be produced by any of several methods, shaped charge perforating,bullet perforating, abrasive/erosive methods, hydraulic punch <strong>and</strong> performed (deformable) ports.The best known design considerations for perforating are perforation length, shot phase angle, perforationdensity, entrance hole size, <strong>and</strong> perforating flow efficiency. However, to properly design for theoptimum in perforating requires preplanning <strong>and</strong> consideration of parameters such as filtered perforatingfluid, amount of underbalance, through tubing vs. casing or expendable guns, the method for conveyingguns, <strong>and</strong> gun clearance.The first perforating mechanism which saw large scale use was the bullet gun, which was first used in1932.' With this technique, a hardened steel bullet is shot from a very short barrel <strong>and</strong> penetrates thecasing, the cement sheath, <strong>and</strong> enters into the formation. Currently, bullet perforators are used infrequentlybut are available in some areas for soft formations, brittle formations, or where consistentlyround holes in the casing are needed. Since the perforations are made by a round bullet, the holes areeasier to seal by ball sealers than are the more irregular holes from the shaped charges, Figure 9.1.Recent testing on break down pressures has shown that in comparable formations perforated with jets<strong>and</strong> bullets, the bullet perforations were easier to breakdown. This may be due to the shattering effecton some brittle formations, such as coal <strong>and</strong> some shales. A surface test with a coal target showed jetpenetration of 30 in., compared with bullet penetration of 8-1/2 in. The perforation formed in the coalby the bullet was heavily shattered. Because of shorter penetration in high compressive strength formations,bullet perforating is often relegated to softer formations.(Amoco)Figure 9.1:A sidelooking down hole TV camera photo of abullet perforation in 5-112" casing. The debris inthe perf are from injection of unfiltered water.The shaped explosive charge or "jet" charge is the most commonly used perforating mechanism.According to theory, the shaped charge produces a hole by explosive propagation of a pressure wavefront from the surface of the metal liner in the charge, through the port or scalloped wall of the gun,
<strong>and</strong> then through casing, cement, <strong>and</strong> into the formation.* The metal liner of the charge deforms underhigh pressures <strong>and</strong> provides mass which makes the charge more efficient. The penetration is theresult of the mass of fluidized liner <strong>and</strong> the amount of pressure (energy) created by the charge. Thelength of the perforation created is a direct function of the shaped charge design (i.e., liner shape <strong>and</strong>size of the charge), the compressive strength of the formation, <strong>and</strong> to a lesser extent, the explosivepowder weight.The detonation of a shaped charge is shown schematically in Figure 9.2. In Frame A, the main componentsof the shaped charge are shown. The detonating (primer) cord fires the shaped charge, <strong>and</strong>as shown beginning in Frame B, the wave front progresses through the explosive charge. As thiswave front moves through the apex of the liner, the pressure generated starts to collapse the liner onits own axis. Since this pressure is beyond the yield strength of the metal used in the liner, the metalbehaves as a fluid. By the design of the metal cone, this collapsing fluidized liner is squeezed byperipheral pressure at the plane of the wave front. The jet stream then moves forward <strong>and</strong> behaves asa penetrating slug.3 The pressure generated during the firing of the charge reaches a maximum ofapproximately 2 to 4 million psi. The forward portion of the fluidized stream has a velocity of approximately20,000 to 30,000 ft per sec. The stream lengthens slightly as the charge burns, with the backof the stream traveling at a much slower velocity of about 3000 ft per sec. The rear portion of thestream does not fully contribute to penetration development <strong>and</strong> is often blamed for enlarging the protrudingburr on the entry hole. For charges which have a wrapped metal liner, rather than a powderedmetal liner, the slug or carrot formed from the wrapped liner will follow the jet <strong>and</strong> can become lodgedin the perforation or in the entrance hole. Efforts to eliminate this characteristic have centered on theuse of pressed powdered metal liners.W W EMPONEHIS OFWWED WRROE PERFORRTWDETONATION TRRVELS WYNTHE CHARGE RND STRIKESTHE RPEX OF THE COMuavmw tOLLwam LINER. ROVRNCIWO URVEFRONT FCMTHE LIMB INNER MFRCE THE JET STREAM. THE OUTER WR-DISINTEDROT S 10 FORM W T FRCE Of THE LINER FORnS A SLUOOF TltE Z T EtRERn.M1 CRRROT WICH FOLLWS THE JElSTRERMFigure 9.2:(Dresser)Sequence of shaped charge detonation.The best shaped charges have design variables that include the shape <strong>and</strong> composition of the linercase design, loading pressure, <strong>and</strong> the amount <strong>and</strong> type of explosives. The amount of explosive isoften the most visible factor used for comparison. This is very frequently erroneous: well designedcharges with slightly smaller explosive load can be the better choice. The most desirable explosive9-2
E-63m-
Figure 9.4:Scalloped <strong>and</strong> port plug hollow carrier perforating guns.Hollow carrier guns, depending on their diameter <strong>and</strong> design, may be loaded with from 1-16 shots/ft<strong>and</strong> have all of the commonly used phase angles. Specialty guns to find cement voids <strong>and</strong> channelsmay have 24 shots/ft.The port plugs in the reusable guns are usually threaded sealing plugs with a thin center section. Theplugs are made from an easily penetrated material such as aluminum or mild steel. The old port plugs<strong>and</strong> debris from expended charges are removed after a run <strong>and</strong> the tool is reloaded <strong>and</strong> fitted withnew plugs before reuse.The alignment of charges in a reusable gun is provided by the alignment washer, Figure 9.5 or a rubberpop-up cap. The alignment washer fits over the top of the charges <strong>and</strong> the alignment sleeve thatgoes between the port plug <strong>and</strong> the washer. In most guns, there is a small amount of compressionload on the rubber boot on the rear of the charge when the plug <strong>and</strong> sleeve are properly fitted, whichholds the charge in place. The amount of gun diameter swell due to repeated use of port plug typeguns, may make this compression less. Longer alignment sleeves may be needed for correction toavoid misalignment of charges. The problem with using a longer alignment sleeve or a severely worngun is that the st<strong>and</strong>off distance between the change <strong>and</strong> the inside of the port plug or casing wall hasnow changed <strong>and</strong> the change may generate less length or hole size. Alignment washers are usuallystamped steel. Alignment sleeves may be steel, sintered aluminum, ceramic, or plastic.Any wireline conveyed, hollow carrier gun should have a detonator system which will not allow thecharges to fire if the gun is filled or partially filled with water. If a wet gun is fired, the hollow carrierouter shell will probably rupture <strong>and</strong> result in a fishing or milling job. Schematics of the st<strong>and</strong>ard explosivesdetonator <strong>and</strong> the fluid desensitized, resistor detonator are shown in Figure 9.6. The st<strong>and</strong>ardexplosive detonator (also called a blasting cap) is a mainstay of the blasting industry but is not wellsuited to the petroleum industry. Several accidental discharges of perforating guns have been linkeddirectly to stray currents or poor electrical panel operational procedures. The resistor detonator incorporatesresistors that reduce the possibility of discharge from low power electrical signals. Other typesof detonating systems that eliminate the less stable primary explosive (lead azide) are being developed.Perforating accidents are a rarity within the petroleum industry. Historically, there are about half adozen incidents per year that involve accidental firing of a perforating gun on the surface (any locationabove the ground level or water level on an offshore well) where people may be endangered. In most9-4
Figure 9.5:Alignment systems for perforating charges.Left: alignment sleevelwasher system for port plug gun.Middle: rubber “pop-up” system for port plug gun.Right: charge case ready to mount in scallop gun carrier~NDCIUDCIU&IIDX,\-atoa*STANDRRD EXPLOSIVES DETONRTORFLUID DESEkSITIZED. RESISTOR TYPEFigure 9.6:Detonator schematics for a st<strong>and</strong>ard explosives detonator<strong>and</strong> safety detonator. The safety cap reduces the chance ofaccidental flring in water or by low voltage signals.of these incidents, the firing occurred following a missed run (failure to fire at depth) while personnelare working on the gun at surface. Safe explosives procedures are available <strong>and</strong> must be followed.Through tubing hollow carriers are popular because they can be run through the production tubing <strong>and</strong>packer <strong>and</strong> require only a service truck. Generally, the only phasing recommended for the through tub-9-5
ing guns is 0" since clearance is critical to the small charges used in these guns. The guns should berun through a lubricator <strong>and</strong> are limited to about 40 ft in length, less for larger, heavier guns. Theadvantages of the guns are low cost, ability to perforate underbalanced, <strong>and</strong> ability to maintain positivewell control. The disadvantages are limited penetration, small entry hole, <strong>and</strong> the numerous productionlimitation of 0" phasing.The expendable <strong>and</strong> semiexpendable guns use several encapsulated charges held together by metalstrips or wires, or the cases may be linked together. The expendable <strong>and</strong> semiexpendable carriers cannormally use a larger charge for a given tubing or casing size than the hollow carrier guns since onlythe skin of the capsule around each charge separates it from the walls of the casing. With this toolthere is also more flexibility since some bending can be achieved. When the gun is fired, however,some or all of the linking material as well as the charge capsule remnants are left in the hole. Problemswith these guns have centered around misfires from damage to the detonating cord, tubing <strong>and</strong>surface line plugging from debris <strong>and</strong> carrier strip disintegration or severe bending after firing. Anotherserious objection to the expendable link charges is the increased possibility for casing damage, particularlyin poorly cemented ~asing.~*~Temperature EffectThe higher the wellbore temperature, the shorter the time that the charge is stable. Figure 9.26 illustratesstable time at temperature for charges made from two common types of explosive. Guide linesabout high temperature charge selection will vary, but most wireline conveyed charges should be stableat the temperature for 16 to 24 hours while tubing conveyed perforating charges should be stableat the bottom hole temperature for 100 hours or more. Higher temperature charges for extended timesabove 300°F (149°C) are available although they are more costly. When selecting a high temperaturecharge, remember that it is part of a system; all parts of the system, including detonator, detonationcord, charges, seals <strong>and</strong> mechanical components must be rotated for the temperature <strong>and</strong> must worktogether.1 10 200TlMEATTUhPEIUTURE HRSFigure 9.26: Approximate time at temperature stability for threecommon explosive types. Other materials are available.Perforation SizeWith shaped charges, the penetration of the perforation has usually been thought to be proportional tothe weight of the charge. Although the charge size has an effect on the performance, the shape of theliner, the internal st<strong>and</strong>off in the gun, <strong>and</strong> the overall design are also important. In the through tubingapplications where the carriers are small, the charge size will vary from 2 grams to about 8 grams withthe smallest charges used in the 1-9/16 in. <strong>and</strong> 1-1 1/16 in. hollow carriers <strong>and</strong> the larger sizes used inexpendable strips. In the hollow carrier casing guns of 3-1/8 in. or larger diameter, charge weights of9-6
over 12 grams are common. The largest normally used charges are the large expendable guns <strong>and</strong>casing guns in which the charges are over 50 grams. Open hole perforating guns that are designed toreach beyond mud damage in a open hole completion may use charges of 90 grams or more.Perforation length is usually the most important criterion in a perforating design for natural completionsor for tests on exploratory wells. As shown in Figure 9.7 for the nondamaged case, the productivityratio is dependent upon the length of the perforation.6 When damage in the perforation isconsidered, it is recognized as a controlling aspect of the flow into the perforation.7i8 The damagefrom perforating, often referred to as the crush zone, is a compacted assortment of crushed formationparticles thrust aside by the jet. Removal of the crush zone by acidizing or underbalance perforating isnecessary for high productivity. Flow restriction caused by the crush zone can be estimated from severalmodels but all depend on a subjective guess of the crush zone thickness <strong>and</strong> permeability.8t9 Inwells that must be completed without further stimulation, long perforations in a high shot density patternare recommended.1.c Mokmot0.6 -0.s0 3 6Is1I2IIS IDPLRCORATIOM LENOTH (Inches)Figure 9.7:(Locke, JPT, 1981)Productivity ratio vs. length of perforation for variousperforation densities. Note that the data assumes nodamage.Factors such as hydraulic fracturing or prepacked gravel pack operations negate the advantages of afew extra inches of perforated length. For hydraulic fracturing or gravel pack treatments, having alarge entrance hole through the pipe <strong>and</strong> cement is more important than total perforation penetration.Although rarely considered, the perforation diameter also influences the productivity ratio, Figure 9.8,<strong>and</strong> the drawdown pressure for a given rate (Fanning Equation), Figure 9.9.6 The perforation diameteris dependent on charge design <strong>and</strong> the clearance of the gun in the casing. In instances such as s<strong>and</strong>control operations, unstable formations (including some chalks) <strong>and</strong> wells which are to be hydraulicallyfracture stimulated, the perforation diameter is important enough to dominate perforator selection.Flow through an open perforation is usually controlled by the permeability of the formation.Where the formation permeability is essentially infinite (very large natural fractures <strong>and</strong> vugs), thepressure drop through a single perforation is:9-7
0.2369 qLpAp =$E2where:Ap = perforation pressure drop, psiq = flow rate per perforation, bbl/minp = fluid density, Ib m/gald = perforation diameter, inch& = perforation efficiency, usually 0.95.Big hole charges may offer some disadvantages as well. The design of big hole charges producesmaximum force impact at the wall of the casing <strong>and</strong> can cause damage (<strong>and</strong> weakening) to the formationadjacent to the entry hole through the concrete. For completions in weak formations where gravelpacking or frac packing will not be used, deep penetrating charges at high density (12 to 16 spf) arerecommended.IJ Lf*5: 0.9LB 0.8a7Figure 9.8:(Locke, JPT, 1981)Productivity ratio vs. perforation diameter for variousratios of damaged permeability.Two factors that affect the charge performance are st<strong>and</strong>off <strong>and</strong> gun clearance. St<strong>and</strong>off is the distancebetween the base of the charge <strong>and</strong> the inside of the port plug or scallop <strong>and</strong> is a fixed part ofthe gunkharge system design. Gun clearance is the distance from the outside of the port plug or scallopto the wall of the casing. The gun clearance distance for a 4 in. hollow carrier, 90" phased gun in7 in., 23 Ib/fl, N-80 casing could be anywhere from zero to 2.3 in. depending on positioning of the gun.Unless centralizers are used on the gun, one edge of the gun will contact the casing wall <strong>and</strong> maximumclearance will occur at 180" to the wall contact. For this reason, small guns are purposely decentralizedby magnets <strong>and</strong> the charges are all aligned to fire in a line in the direction of the magnetic9-8
I.I :I .oa\.-a+TbTrki o h Oboo 0:-CERfO(UTIQ1DuymR (crrrr)(Locke, JPT, 1981)Figure 9.9: The pressure differential produced for smallerperforation diameters from the Fanning equation.positioning (0" phasing). Larger guns with small clearance distances use charges aligned in rowsaround the gun.The phasing is the angle between the charges, Figure 9.10. Although there are many possible angles,there are five common values; O", 90°, 60°, 120°, <strong>and</strong> 180". In the 0" phasing, all the shots are in arow <strong>and</strong> the gun must be decentralized against the side of the casing so the charges have minimumst<strong>and</strong>off. This phasing is normally only used in the smaller O.D. guns or guns in very large casing. The0" phasing offers some drawbacks since the practice of putting all shots in a row lowers yield strength<strong>and</strong> makes the casing more susceptible to splits <strong>and</strong> collapse at high shot densities (over16 ~pf).~~'~~'' Fracture stimulating in wells which were perforated with 0" phasing also results in aslightly higher incidence of fracturing screenouts than with 90" or 120" phasing. It is unknown whetherthe screenouts result from the smaller entrance holes or from the fact that one wing of the fracturemust wrap around the pipe.Of the other common phasing possibilities, 60°, 90" <strong>and</strong> 120" are the most efficient choices from astimulation st<strong>and</strong>point since they will produce a perforation just a few degrees from any possible fracturedirection. These phased carriers do not necessarily need to be centralized to give good perforationssince regardless of where they contact the casing at least two or three good perforations per footshould be formed. In the small carrier guns only 0" phasing should be used, especially in large casing.The potential problems with using a 90" phased through tubing gun is shown in Figure 9.11. As shownin the figure, the perforations nearest the gun will be fully developed while the perforations with thelargest gun clearance (the distance from the surface of the gun to the casing wall) are short <strong>and</strong> havea very small diameter. Because of previously mentioned problems <strong>and</strong> production restriction, 0" phasing<strong>and</strong> some through tubing guns should be avoided when casing guns can produce perforations thatmore closely fit the need of the completion.9-9
COMMON GUN PHASINGFigure 9.10:Typical phasings offered by casing carrier guns. Most lowshot density guns will be O", 120°, 90 or 180'. High shot densityguns will use 60" or similar phasing.(original source unknown)Figure 9.11 : Approximate hole orientation, diameter <strong>and</strong> penetrationfrom firing a 1-11/16" 90" phased through tubingperforating gun in 7" casing. Note that the perfs onthe far side of the casing (maximum clearance) are0.1 to 0.18" diameter (just larger than a pencil lead).The effect of perforating phasing on production may be seen in Figure 9.12. This data from Locke6 isnot corrected for damage permeability but is a reasonably good comparison between productivity ofperforations of O", 1 80", <strong>and</strong> 90" phasing. For a shot penetration of 12 in., a productivity ratio of 1.2results from 90" phasing of 4 shots per foot, while the productivity ratio is 0.99 (productivity will bedecreased in comparison to openhole flow <strong>and</strong> "formation damage" may be seen on a buildup) whenthe 4 shots are in 0" phasing. Again, this is ideal behavior <strong>and</strong> does not consider damage.9-10
- 10 1.2t1.1E f 1.01.---0.8- /I 1 I I t IFigure 9.12:(Locke, JPT, 1981)The effect of charge phasing on the productivityof the unfractured well If damage is ignored.Productivities of cased-hole wells are dependent upon the perforation density (number of holes per ft).Productivity ratios for various shot densities versus perforation penetration were shown previously inFigure 9.7. The productivity ratio used in the figure is defined as:Productivity Ratio = - qP90whereqpqo= flow rate from cased <strong>and</strong> perforated wellbore= flow rate from uncased wellbore.Assuming all perforations are open to flow, shot densities of 4 per foot with 90" phasing are usuallysufficient to insure the equivalent of openhole productivity. However, increased shot densities (greaterthan 4 per foot) may improve productivity ratios under certain conditions, such as very high flow ratewells or in gravel packed wells. The cause for the increase is that the real number of open perforations(those producing or taking fluid is only about 50% of the total holes in the pipe (The 50% value wasreached after examining hundreds of hours of downhole N recordings in dozens of wells). The effectof perforation density on the producing rate of a well in a highly productive gas reservoir as plotted onan inflow function <strong>and</strong> the effect on modeled cumulative production rate is shown in Figures 9.13through 9.15. In this example, Cheng uses data from a high flow capacity dry gas well with depth10,000 ft, 2-3/8" tubing, BHT = 200°F, Pr = 3500 psi, pg = 0.75, h = 50 ft, S, = 45%,
IFigure 9.14:Figure 9.13: Cumulative gas production vs. time for anexample case study. Productivity differencebetween 1 <strong>and</strong> 6 shots per foot is about 2.5 bcfat 2 years.I 24hoQcrionno.MMddEffect of shot density on rate <strong>and</strong> economic payout on the same examplemodel run used in Figure 9.13. Note that rate <strong>and</strong> payout maximize at about6 to 8 shots per foot. This data is from a specialized dry gas example.Referring to Figure 9.7, note that Locke also shows that shot density can be more critical to productivitythan penetration. A single perforation 12 in. deep is not as effective as four perforations only 3 in.deep.6 This analysis, however, neglects damage <strong>and</strong> the possibility that the shorter perforations maynot contact permeable, undamaged reservoir. When the effects of drilling damage are included,Figure 9.16, productivity can drop ~harp1y.l~ This is a solid argument for using high shot densities of12 shots or more per foot in high rate wells.The ideal fluid for perforating operations is a solids free fluid which will not cause byproducts whenexposed to the formation. Acceptable fluids may include 5% to 10% HCI, 10% Acetic acid, 2% (ormore) KCI water, 2% NH&I water, clean brines <strong>and</strong> filtered diesel. If a dirty fluid is used, there is a distinctpossibility that formation damage will occur due to particle plugging at the surface of the perforationtunnels. Even when a high pressure differential toward the wellbore is used, clean fluids are still9-12
't0 90 2 4 6 8 1 0 1 2shot density, spt(Cheng)Figure 9.15: Shot density vs. flow rate for a model case run on asimulator.-*-I0.3Figure 9.16:(Locke, JPT, 1981)Productivity vs. damaged zone thickness with no crushzone for the example case of a 9" long perforation.recommended to avoid flow of particles into the perforations in event of a mechanical breakdown,when formation pressure or productivity is less than expected, or when the well has to be shut inbefore all the wellbore fluids have been produced. Drilling mud should never be used as a perforatingfluid. Drilling mud is designed to form a mud cake on the face of a permeable formation. If drilling mudis used <strong>and</strong> the pressure differential (either by design or by accident) is toward the formation from thewellbore, a drilling mud cake will be formed in the perforations that may be difficult to remove unlessthe formation can be produced at a high drawdown for a long peri~d.'~~'~ Diesel or oil may be used asperforating fluids if the full column is diesel or oil, but 6.8 Ib/gal diesel cannot be kept spotted below9.0 Ib/gal brine water. Diesel should also be filtered before use.Perforating produces a zone of damage around the perforation in which permeability may be reducedsubstantially below that of native state formati~n.~>'~*'~ For the condition of no drilling damage, Locke'9-13
has shown that the crushed zone permeability can be as much as 50% less than normal formationpermeability without seriously affecting productivity ratio, Figure 9.1 7. These figures show the effect ofperforation length <strong>and</strong> phasing when a crush zone is present. Longer perforations are less influencedby the crush zone than are short perforations. Phased perforations, such as 90" phased perfs are lessaffected than 0" phased perforations. Klotz, et a1.,13 pointed out that permeability of the compactedzone is less than the wellbore permeability which has been reduced by drilling fluid <strong>and</strong> cement particles<strong>and</strong> filtrate. McLeod' offered the following example of the effect of severely reduced permeabilityon production. The example is very interesting in terms of the amount of pressure drop inflicted on theproducing system by damaged perforations.1.1 -0. PHASINGt o.81 I I1.0 0.5 0.00.9 -CRUSHED ZONE PERYfAllLlTYfORYAT1ON PERYEA8ILITI,KC,Ku)(from Locke)Figure 9.17: The damage (up to 50% of initial) in a perforation mayhave little effect if just the crush zone is considered asin this example from Locke.Q = 8080 MSCFDnet h= 26 ftT= 245°F = 705"Rre= 1320 ftZ- 1.415w= 4.5 in. = 0.375 ftj.~ = 0.035 CpPr= 10,162 psig = 10,177 psiako = 200 mdrd = 0.875 ftkd = perm of near wellbore, damaged by mud <strong>and</strong> cement filtrate = 50 mdkdp = perm of crush zone surrounding perforation = 5 mdNOTE: the permeabilities are estimates, not measured valuesG = gas gravity = 0.635Shotslft = 2Phasing = 180"Lp = Perf. penetration into formation = 0.75 ft9-14
Perf. diameter = 0.38 in. = 0.0317 ft (Perf radius, rp, = 0.19 in.)rdp = Compacted zone thickness = 0.5 in.N= total number of perfs = 52Laminar flow skin1. Perforation geometry skin, Sp = 0.45 (see Hongg)Sp, the skin due to the perforations, can be established from the nomographs of Hong.2. Weilbore damage from drilling(g-Sd = 1)n- rdrw3. Perforation compacted, damage zone(g- = l)/n- 0.875 = 3.90.375(9.3)Sdp = (52) 26 (0.75)( T-- 2oo y:)/n( 0*1i,:6)*5)= 30.954. Combined laminar skin, STurbulence Parameter, DS = Sp+ Sd+ Sdp = 0.45 + 3.9 + 30.95 = 35.3p = 2.6 x 10’ok’*2 = 2.6 x 10¹⁰ (5) l a 2= 3.77 x logBG[’oh~ lD = 2.22 x 10⁻¹⁵ “ZLp2rpI3.77 X log (0.635)= 2.22 x 10⁻¹⁵ [ (52)( 0.75) (0.0158)D = 0.032859-15
Calculated Pressure DropP&AP=8931 psia= 1246 psiThus, the damage in the near wellbore, plus the damage in the crushed zone can cause severe pressuredrops. It should be noted, however, that most damage from drilling mud is confined to the face ofthe formation. In cases of nonwater sensitive s<strong>and</strong>stones, the damage zone should not be of significance.The crushed zone will be created regardless of damage, but may be minimized by underbalanceor extreme overbalance perforating.Partial CompletionInflow of fluids into perforations of an unfractured well, Figure 9.18, shows the normal convergenceinto the sides <strong>and</strong> the end of the perforation. Partial completions may be used for a number of reasonsconcerned with controlling or diverting a stimulation job or to slow water or gas coning. Regardless ofthe intentions, partial completions restrict flow both into <strong>and</strong> out of the zone. Partial completions willappear as skin on a buildup test where the net formation pay height is used instead of the shorter, perforatedheight. Another severe detriment of partial completions is the effect the limited number of perforationshave on fracturing fluids. Most of the high viscosity fracturing fluids are shear sensitive <strong>and</strong>undergo radical viscosity change when forced at high rates through a limited number of perforations.Figure 9.18:Left Normal convergence of flow towards a perforation in a fully completed zone.Right: Convergence of flow towards a perforation in a partially completed zone.Partial completion or limited entry perforating is increasingly being used in combination with stimulationsto get effective diversion of injected fluids into all zones. The number of perforations needed forthis type of diversion depends on the fluid injection rate, the injected fluid viscosity, <strong>and</strong> the pressuredifferential or pressure rise needed to inject fluid into all the zones. If the interval is perforated evenly,fluid will enter the high permeability zones first; then as rate increases, the pressure in the tubulars willincrease from perforation friction <strong>and</strong> fluid will be displaced by the higher differential pressure intolower permeability zones.9-16
The diverting efficiency of the process depends on pumping fast enough to create the pressure rise.The process does not prevent fluid from entering the higher permeability zones, it only limits theamount that enters to the amount that can flow through the perforations. The downhole injection ratemust be matched to the numbers of perforations to get effective diversion. The process will work ineither matrix treating or in fracturing but fluid diversion is only affected as far as the tubular contactwith the formation.If the necessary pressure rise is known, the number of perforations to produce that pressure at thetreating rate can be calculated from friction pressure curves, equations or by the use of a nodal analysissimulator.The partial completion technique is also very useful in combination with ball sealer diversion. At typicalrates, using neutral density ball sealers, perforation densities of 1-2 shotslft yield the best “ballaction” or diversion. Balls are very effective but also only affect the fluid diversion to the contact areaof the formation.Any time a partial completion is used, consideration should be given to adding more perforations afterthe treatment.Underbalance PerforatingUnderbalance perforating or perforating with the pressure in the wellbore lower than the pressure inthe formation is generally acknowledged to be one of the best methods for creating open, undamagedIn underbalance perforating, the pressure differential from the formation of the wellborehelps remove the crushed formation from the perforation <strong>and</strong> provides improved flow channels.The pressure differentials necessary to remove damage from a perforation is affected by pressure <strong>and</strong>flow <strong>and</strong> perhaps limited by formation integrity.20r21 The pressure differentials necessary forperforation cleanup usually range from approximately 500 psi to over 4000 psi <strong>and</strong> have been establishedby trial <strong>and</strong> error in manyPublished studies of the flow rate necessary to remove damage observed that serious perforationplugging occurred whenever the pressure was higher in the wellbore than in the f~rmation.~~-~~ Theplugs consisted of crushed formation, liner particles, case material from the charges, <strong>and</strong> mud. It wassignificant that the plugs that formed when perforating was performed in heavy mud were almostimpossible to remove by reversing pressure. Underbalance perforating followed by flow has beenshown to be the best method for cleaning perforations <strong>and</strong> establishing high flow capacity from naturalcompletions in moderate to high permeability ~ ore.*~*~~ Even when compared to surging <strong>and</strong> washing,underbalance perforating followed by flow was s~perior.~’Underbalance studies of over 100 wells that were underbalance perforated, tested, acidized, <strong>and</strong>retested are shown in Figures 9.1 9 <strong>and</strong> 9.20.18 The data in the figures can be successfully approximatedby:3000AP- -3Ji(This study compared creation of damage free perforations by selection of underbalance pressuresbased on permeability.’’ The original ranges for this work were advanced by Bell, who theorized thatthe underbalance necessary for cleaning should be related to permeability.’7*18 In formations of veryhigh permeability, such as the Berea core used for most test targets, underbalance pressures on theorder of a few hundred psi are quite adequate to generate sufficient flow for cleaning the perforation.In formations of lower permeability, however, higher pressure differentials are needed. In unconsoli-9-17
..,.......dated or poorly consolidated formations, the mechanical strength of the formation must be considered,<strong>and</strong> the lowest useful underbalance pressure are suggested. The scatter of the crossover points (inFigures 9.1 9 <strong>and</strong> 9.20) on each side of the line in both figures is an indication that other conditionsmay be affecting the performance of the perforations. These conditions may represent a myriad of factorsincluding inaccuracies in estimating pressure <strong>and</strong> permeability, extensive damage from drilling,<strong>and</strong> fluid viscosity differences. In almost all of the test cases, the guns were pulled <strong>and</strong> inspected afterthe initial flow test. Wells in which guns did not completely fire or in which charges malfunctioned werenot included in the test.100.......(. ..-....'.............I......... 2 ....... .. .. . . ..........,..... . ....... . . . II ? -..... I.......'...I...'....... ......_I0.1(<strong>King</strong>, et al., JPT, 1986)Figure 9.19: Underbalance used on tubing conveyed perforating completionsin oil zones in s<strong>and</strong>stone.FigureACID DID NOT IMPROVE PRODACID DID IMPROVE PROD. . .. .. . . . . .: i : :::0.01 . .; i : rw UJZlli100 1000 10000TOTAL UNDERBALANCE PSI(<strong>King</strong>, et al., JPT, 1986)9.20: Underbalance used on tubing conveyed perforating completionsin gas zones in s<strong>and</strong>stone.9-18
Although underbalance pressure is seen to be of critical importance in generating clean perforations,it is the flow rate created by the underbalance that is responsible for cleaning the perforation. Theimportance of flow after even underbalance perforating cannot be overemphasized. The volume offlow needed from a single perforation to clean debris is estimated at a minimum of 4 gallons.30 If thepermeability is too low to achieve significant flow rate (cl md), underbalance perforating may not beeffective. The underbalance technique may also be used with the through tubing gun, provided thegun is run through a lubricator into the well. The tree is OR the well before the run <strong>and</strong> well control isestablished since the tubing, packer, <strong>and</strong> tree are all set before the tool is detonated.The most frequent causes of failure for underbalance perforating are low formation permeability <strong>and</strong>lack of flow immediately after the perforating gun fires. C<strong>and</strong>idate formations are best based on permeabilitiesof I md, although s<strong>and</strong>stones are usually much better c<strong>and</strong>idates.Extreme Overbalance PerforatingExtreme Overbalance Perforating, EOP, is a micro fracture initiating process that is applied at the momentof initial perforating or as a surge process to existing perforations. The technique uses stored gas energyin the tubing to break down the zone. Bottomhole pressure equivalents to 1.4 psi/ft <strong>and</strong> higher are instantaneouslyapplied through use of a nitrogen gas supercharge contained in the tubing. The energy is isolatedin the tubulars of an unperforated well <strong>and</strong> behind a shear disk or other device in the tubing on a wellthat has already been perforated. The energy is isolated in the tubulars of an unperforated well <strong>and</strong> behinda shear disk or other device in the tubing on a well that has already been perforated.The energy imparted is more sudden than a traditional hydraulic fracturing process <strong>and</strong> more sustainedthan an explosive or propellant treatment.The fracture created by the EOP surge is more likely to fracture all exposed zones than a traditional fractureprocess applied as an all liquid hydraulic fracturing process. Work with production logs <strong>and</strong> radioactiveisotope tagged s<strong>and</strong> after EOP jobs indicate that multiple zones do tend to be broken down more evenlywhen EOP is used.Although a fracture is created during extreme overbalance perforating or surging, its growth does notappear to be controlled initially by formation stresses or traditional rock mechanics forces. Because of thevery high pressure of the initial surge, the pressure behind the surge is probably greater than the fields ofmaximum <strong>and</strong> minimum principle stresses in the formation. As a result, the initial direction of the fracture isin the plane of greatest mechanical near-wellbore weakness; the perforations. After the six second life ofthe pulse (Arco estimate), the fracture direction probably is controlled by the traditional stress forces <strong>and</strong>subsequent fracture growth goes perpendicular to plane of least principle stress.The EOP process appears ideally suited for:1. Acid breakdown of perforations in carbonates where the traditional stimulation is an acid/ballout job.2. Creating initial fracture breakdown in wells with linked, multiple zones.3. Low permeability formations (below about 1 md) where a production test is needed prior to stimulatingthe well.4. Where breakdown pressures are too high for economic fracture treatment (this conclusion is not wellsupported by available data).Although the designs of treatments are still being refined, the initial successes have focused on maximizingthe kinetic energy in the job. This is accomplished by minimizing the liquid in the tubing to eliminate frictionpressure of liquid movement in the tubing during the surge. Most job designs are focusing on filling thetubing with nitrogen <strong>and</strong> filling the casing below the packer with liquid.Tubing Conveyed PerforatingThe tubing conveyed perforating, TCP, system utilizes a casing gun run on a tubing string with apacker above the gun. The casing guns are run as tail pipe below the packer thus allowing the packerto be set before perforating. The system achieves large entrance hole size, longer penetration thanthrough tubing guns, <strong>and</strong> offers the options of phased orientation of charges while perforating in9-19
underbalanced or overbalanced conditions. Because the guns are tubing-conveyed, zones of over1000 ft in some areas have been successfully perforated in one run. A typical installation is shown inFigure 9.21.tovrrEnONSWITH P E W E MPAClERSLnON WRELINEAND USINGOUWI RUW INON TWINOANDTHROWWMEPACK€#SYmU FORDITLOMTORY.TESflNG.AND*ullponMEWWOCIDUREtPRDvtDB rollURBE FLOWARWWEWITHDMWALOF WE, ANDIUI REURIIY.Figure 9.21:(Vann Tool Company)Examples of tubing conveyed equipment for various conditions.The equipment involved in tubing conveyed perforating is varied since several suppliers offer the service.The technique may also be adapted for special completions involving artificial lift methods ormultiple completion^.^'-^ Basic equipment involved in underbalance perforating includes the packer,the guns, initiation or firing systems, <strong>and</strong> specialty items for particular applications.The packer may be a retrievable or permanent model or the guns may be run with a seal assembly<strong>and</strong> stung through a seal bore permanent packer previously set in the well. After the guns have beenrun <strong>and</strong> the wellbore is isolated, the underbalance is set by swabbing the tubing, nitrogen jetting, circulatingthrough a vent assembly or other method.Firing the guns is done by a drop bar, battery pack, slick line, electric line, or by pressure level. Thedrop bar, a solid steel bar that sets off an impact detonator, is the most common current method. Theinitiator or firing head is usually set above the packer in the tubing <strong>and</strong> a detonating cord leads to theguns. A rupture disk or mechanical valve above the firing head separates the pressure in the tubingfrom the fluids below the packer. With the firing of the guns, the well fluids surge through the ventabove the guns or through the guns themselves <strong>and</strong> flow into the tubing.Specialized equipment includes: disconnecting subs that can drop the guns after firing, shock absorbersto prevent tubing or packer damage when firing hundreds of charges at once, multiple firing initiatorsfor multiple completions, <strong>and</strong> backup firing systems to avoid pulling a gun.9-20
A major drawback to tubing conveyed perforating is that there is no way of knowing, except by pullingthe guns, how many charges were fired. A signal charge device that either fires a small explosivecharge or trips a hammer device a few seconds after the primer cord detonation reaches the bottom ofthe gun can be used (in conjunction with a sensitive sound recording device) to determine that the detonationcord was ignited to the bottom of the gun. Although the detonation of the signal charge will nottell how many charges were fired, it does signify that the primer cord has burned past all the charges.Since the major mechanical problems of the TCP systems have been in two areas: (1) failure to initiatethe guns at the firing head, <strong>and</strong> (2) failure to initiate the next gun at the gun junctions, the use ofa bottom shot detector is very advantageous. The reports of early use of this system indicates it hasbeen very successful on l<strong>and</strong> based wells but has given problems on offshore well due to the highnoise levels associated with platforms.The frequency of misfires depends upon both equipment <strong>and</strong> personnel. A worldwide study generateda failure-to-fire rate of about 6% for tubing conveyed perforating. However, some locations with experiencedcrews reported almost no failures, while areas with less experienced operators reported ahigher failure rate. Failure rates with wireline conveyed perforating guns are harder to obtain but areusually stated at 2 to 3%. New systems or new crews may generate early failure rates of 50%.Wireline PerforatingWhen a well is perforated with a wireline gun with the differential pressure into the well, the flowingfluid tries to pull the cable up the hole because of the lift effect produced by fluid drag <strong>and</strong> the effect ofdifferential pressure on the area of the gun or able.^^^^ In normal operations, this drag is minimal<strong>and</strong> will probably not be noticed unless the well produces several thous<strong>and</strong> barrels per day.The magnitude of the drag on the cable, Figure 9-22, depends upon the flow regime illustrated inFigure 9.22a. Following perforating, the liquid column used to control the amount of underbalancepressure is lightened by gas production from the formation. The liquid in the tubing also starts to flowupward due to fluid influx from the formation. As more gas enters the casing there is a period of timewhere slugs of water are rapidly lifted by the gas. The velocity increase as the slugs rise is due to theexpansion of the gas. After all the liquid has been produced from the tubing, the gas flow can bedescribed as auasi steadv state. The maximum lift on the cable will occur during flow of slugs of water<strong>and</strong> gas when velocities of the liquid slugs are high?5Figure 9.22:An idealized schematic of the flow regimes of wellbore fluid <strong>and</strong> thetypes of lift (drag) produced on a wireline suspended in the middle ofthe tubulars. In actual operations, the cable is always lying againstthe side of the tubing because of wellbore inclination. Drag is minimizedwhen the wireline is near the boundary.9-21
If possible after firing underbalance with a wireline gun, the gun should be lowered beneath the perforatedzone to minimize the lift force on the gun body. If it is necessary to flow the well as the gun is runthrough the tubing, sinker bars will be needed on the gun <strong>and</strong> the well should be choked back. Veryclose clearances between the gun <strong>and</strong> tubing will result in very high lift forces if the well is flowing.Highly Deviated WellsHighly deviated wells may create problems for wireline guns. The wireline gun problems have essentiallybeen with placement of any tool due to friction of the assembly in the high angle holes overcomingthe gravitational effect. Flexible tools <strong>and</strong> roller units have been used to improve success butoperations are still limited in holes with deviations of more than 45”.*OTubing conveyed completions in holes of up to 75” or more are common.21 The higher angle holesmake the use of J set packer difficult, thus most packers in the high angle wells are set by pressuringup on the tubing. When the guns are run on the drillstring, pressuring up to set a packer often allows alarge amount of dried debris such as cuttings <strong>and</strong> mud to fall out of the tubing <strong>and</strong> cover the firinghead. The circulating vent for debris removal which is commonly run above the firing head cannot beused in these cases since the firing head is below the pressure set packer. When perforating underthese conditions, the guns should be run only on a new or clean workstring or on the new or clean productiontubing.Depth ControlThe most critical field parameter of a perforating treatment is depth control. Drillers measurements ofdepth are based on pipe tally <strong>and</strong> are not usually corrected for stretch under load or effects of temperature.Wireline measurements, even if corrected for stretch may still be in error. The wheels in thedepth measurement device on logging trucks are calibrated for new cable. Wear in the cable, cablestretch, <strong>and</strong> wear of the measurement wheels can all cause inaccuracy. Magnetic marks or depth flagson the cable are helpful but can be thrown off by cable stretch. The only reliable method for spottingthe perforating gun is to use the openhole gamma ray log as a base <strong>and</strong> to run a confirmation sectionof gamma ray log. Some companies offer a gamma ray tool that is fitted in the head of the perforatinggun; these devices should be used wherever possible. On tubing conveyed guns, the confirmation GRis run with the tubing in the hole before the packer is set. For guns run on wireline, the GR should berun immediately before the perforating job preferably on the same cable to be used to carry the gun.The gamma ray log is matched with the openhole gamma ray log, Figure 9.23, <strong>and</strong> the casing collarlocations correlated with the log. Remember to subtract or add the distance from the RA detector tothe CCL to get the depths exactly on target. To account for creep in the wireline <strong>and</strong> to very accuratelyzero in on the depth, the collar locator should be raised very slowly into the collar above the pay <strong>and</strong>stopped when the signal for the peak (collar location) is only half formed. This indicates the tool isexactly in the center of the collar. To find the spot where the tool is centered on the collar <strong>and</strong> remainswithout changing may take several very slow passes. Once located, the wireline depth of the collarabove the pay can be correlated to the openhole gamma ray log. If the casing (or the tubing in a tubingconveyed operation) is run with a short joint or pup joint near the pay, it will be much easier to correlatetool depth on repeat runs.Openhole <strong>and</strong> cased hole gamma ray logs rarely agree exactly on depth due to differences in cable<strong>and</strong> chart paper. The depth correlation is to be made to the openhole log. If two sections are to be perforated<strong>and</strong> a single shift will not align the cased hole log to the openhole log, each section should bealigned independently to the openhole log.If a short joint is not run with the casing, the collars should be counted to assure depth control agreementwith the wireline measurement. The most common depth control problem with perforations isshooting them one joint off; a complete miss for most zones. Radioactive “PIP tags” on the casing arealso helpful in determining depth. The well’s plug-back-depth (or float collar) can also be “tagged up”with the bottom of the gun to check depth. If the float collar has been drilled out, it can also be used asa short joint for identification.9-22
Figure 9.23:An example of overlaying the cased hole gamma-ray logstrip over the original open hole gamma-ray log to tie in thecollar depth for depth control on the perforating run.After running the perforating gun <strong>and</strong> locating the collar above the pay, note the distance from the collarlocator to the first shot (to the first shot of the appropriate section if a selective fire tool is used) <strong>and</strong>position the first shot at the top of the zone to be perforated. With this method, the tool can be positionedwithin a few inches of the desired spot.A stepwise sequence of the depth control procedure is shown below:1. Correct cased hole log to openhole log, overlay <strong>and</strong> record interval on cased hole log.2. Determine distance of CCL to top shot.3. Run CCL <strong>and</strong> perforating gun <strong>and</strong> correlate collars to openhole log depths, record on cased holelog.4. Perforate.5. Log a few collars up to confirm depth or rerun gamma ray if a tracer was used in the upper <strong>and</strong>lower port plugs.Cement DamageContrary to some existing opinions, there is little shattering or cracking damage to cement from perforating.Tests have been conducted on over 50 targets with unconfined compressive strength from1500 psi to over 9000 psi. When the perforation is more than about four inches from a free face therewas almost no instance of cement shattering noted after firing. Splitting (longitudinal) along the perfplanes may be seen in some targets but is usually reduced when the targets are bounded by steelretaining forms that limit compressional wave rebound from free surfaces. In short, cracking followingperforating is the result of the test method, not the perforating process.Casing DamageThe shock of firing the charges must be absorbed by either the casing or the carrier. The air filled hollowcarrier gun absorbs the detonation pressure hence there is less possibility of casing splits due to9-23
upture. This becomes very important when shooting a large number of holes or whenever casingstrength is important. As shown in Figure 9.24, the collapse resistance of the casing (<strong>and</strong> resistanceto splits) depends upon the number of holes in the pipe <strong>and</strong> their alignment (shot phasing).lOtll A newgeneration of casing guns with staggered phasing (i.e., 37.5") has improved the casing collapse resistanceloss. These guns, even using big hole charge, often result in less than 10% loss (the typicalvariance of casing strength) of crush strength at shot densities of 16 or more shots per foot.Figure 9.24:(<strong>King</strong>, SPE 18843)Casing crush resistance tests on tubes. The tubesmodel a 7" casing perforated with 0 to 36 spf.Perforating with the hollow carrier causes only slight reduction in yield or collapse strength of the casing.The expendables cause substantially more damage since the casing must st<strong>and</strong> the shock of detonation.Research by Godfrey <strong>and</strong> Methven4 on casing damage at downhole conditions determinedthat expendable jets (limited to six shots per foot) do not cause significant damage to (1) high strengthcasing without flaws even when unsupported, or (2) high-strength casing with flaws (laps <strong>and</strong> seams)that is well supported by cement. Casing of low or unknown strength, corroded, old, with flaws, orpoorly supported casing should definitely be shot with a hollow carrier gun.Reperforating ConsiderationsReperforating can often be beneficial to repair problems such as scale or paraffin plugged perforations,unknown shallow formation damage or questionable perforations. If the buildup test shows veryhigh skin even after a properly designed acid treatment, then the problem may be poor perforations.As shown previously in Figure 9.24, pipe in good condition can tolerate many phased shots per footwithout being seriously weakened. When reperforating, at least two shots per foot are recommended<strong>and</strong> three or four may provide the best treatment. If the pipe strength is critical, phasing of 0" shouldnot be used in reperforating especially where 0" phasing was used initially. If two sets of 0" phasedshots are used in the same interval, the chance for casing splits is greatly increased. Since the Oophased guns are usually magnetically positioned <strong>and</strong> ride the low side of the pipe, the possibility of liningup new <strong>and</strong> old shots is too great to use the 0" phasing. If it is necessary to reperforate underthese conditions, the magnetic positioner on the gun should be offset 15" to reduce the possibility ofthe new perforations lining up with the old ones.9-24
Stimulation ConsiderationsThe type of stimulation or ultimate well completion should influence the perforation design.The damage to a cement sheath from jet perforating should be slight if the cement is continuous <strong>and</strong>not heavily ~ontaminated.~' Even the light weight cements have been shown to be significantlyundamaged by perf~rating.~~In gravel packing operations, a large number of big holes are usually desired to reduce the velocity offluids coming into the wellbore. The decreased fluid velocity will carry less formation s<strong>and</strong> grains <strong>and</strong>will result in less fines movement <strong>and</strong> plugging in the pack. Since the perforations may be filled withs<strong>and</strong>, more perforations are required to generate the same productivity as open perforations.Fracturing stimulations require sufficient perforations to avoid detrimentally shearing the fluid (loweringthe viscosity by degrading the polymer or crosslinked system) <strong>and</strong> to avoid needlessly high purnpingcosts. The viscosity of a fracturing fluid is a designed part of the stimulation treatment, <strong>and</strong> ifaltered, the treatment may not meet expectations of s<strong>and</strong> carrying capacity. If this carrying capacity isdestroyed by high shear, the s<strong>and</strong> may fall out of the fluid too soon causing a blockage of the perforationsor fracture by injected s<strong>and</strong> (a screenout). The friction resistance offered by a perforation duringpumping is approximated with the following equation:40Fp = 0.237~~ (Q/(PfcN(d2)2))2whereFPP1QPfcNd= friction resistance, psi= density of the liquid in Ib/gal= flow rate in BPM= a flow coefficient, usually between 0.65 <strong>and</strong> 0.87= number of perforations open to flow= diameter of perforation, in.Another problem encountered in fracturing, which may be eliminated by having the perforating treatmentdesigned for the stimulation, is a flow restriction from the fracture to the wellbore caused by 0"phased perforations. When all the perforations are in one vertical line, the s<strong>and</strong> packed crack leadingto the fracture can be a source of restricted production since the line of perforations may be up to 180"away from one of the fracture wings. This means that for both fracture wings to be productive, thes<strong>and</strong> packed crack must wrap around the pipe. The fracture direction will be in the direction of leastprinciple stress in the formation <strong>and</strong> is not influenced by the direction of the perforations.Deviated wells pose a problem of tool movement <strong>and</strong> depth measurement due to the high degree offriction or drag between the cable or the tool <strong>and</strong> the wall of the pipe. Subs <strong>and</strong> tools with small wheelsplus weights on the tool make movement easier, Figure 9.25. Tubing conveyed operations usuallywork better in deviated wells than wireline conveyed systems. Firing systems are often more troublesomein deviated wells when using tubing conveyed guns.Concentric strings of casing will reduce the penetration of any perforating ~ harge.~~~~~The thicknessof the string of casing, as well as the thickness of the two sheaths of cement which must be penetratedcan reduce the length of perforation penetration in where an effective perforation may not becreated in a well unless the deepest penetrating charge is used. The use of through tubing perforatorsfor shooting concentric strings is not recommended, since both hole size <strong>and</strong> penetration are reducedwith small charges.9-25
In deviated wells were concentric strings are to be perforated, the perforating gun will ride the low sideof a pipe. When a casing gun is used for this operation, shot phasing of 60°, 90" or 120" should beused to obtain the best chances of making perforations by the charges with the least st<strong>and</strong>off. Use ofcentralization techniques (if possible) on the guns run in deviated wells are recommended if hydraulicfracturing is to be used. This will allow perforations to be placed near both fracture wings. Centralizationwill also improve the roundness of the holes since the gun clearance will be near ideal. If inadequateperforations are a problem in wells with concentric strings, the innermost casing can be milledout <strong>and</strong> the completion made through the outer casing.When casing is run <strong>and</strong> cemented through washed out sections, the cement sheath can be sufficientlythick to deny access to the formation with any perforator. When drilling a well into an easily washablepay zone, care must be taken to obtain a gauge or near gauge hole so that the perforations will reachinto the pay.Perforating charges are subject to high temperature degradation by sublimation of the powder or byauto detonation.Critical gun components should be analyzed to determine stability at temperature. Charges, detonatingcord, detonator, port plugs <strong>and</strong> seals must all be considered.Stimulations in Deviated Wells - Effect of PerfsThe perforating design needed for a cased <strong>and</strong> cemented deviated well may be different than for avertical well, even in a similar formation. The main factors are cost of perforating in very long sections<strong>and</strong> need for focusing injected fluid into a single fracture when fracturing.The number of perforations needed for any well, deviated or vertical, depends on the inflow potential.While perforating costs can indeed increase as pay contact increases, a better method of cost controlis to use logging methods to identify zones of best porosity, oil saturation <strong>and</strong> pressure (or flow wherePLT data is usable, <strong>and</strong> concentrate perforations in those areas. The estimates on numbers of openperforations runs from 30% to 80%, with the authors view at 50% (from examination of downhole TVtapes in dozens of wells).In the case of fracture stimulating in highly deviated wells, there is little to prevent multiple fracturesfrom initiatings along the wellbore. Since fracture growth is driven by the amount of fluid entering thefracture, increasing the number of fracture sites will decrease growth.To achieve better fracture growth potential, single fracture sites are needed. In field application of multiplefractures in deviated wells, perforating one meter of the wellbore prior to a fracture job has producedgood results. Although this approach is effective in providing sufficient width in a main fractureto prevent early screenout, it does not address potential inflow from the matrix into the cased <strong>and</strong>cemented wellbore. Adding perforations along the length after all fracturing is one option, but obtainingany type of cleanup or breakdown of these added perfs can only be accomplished with a straddlepacker.AbrasivelErosive PerforatingPerforations may also be cut through the casing <strong>and</strong> rock with abrasive laden fl~ids~'~~~or fluid aloneunder very high press~re.4~The abrasive laden fluids abrade a hole through the pipe <strong>and</strong> into the formation. The slurry is pumpeddown the tubing <strong>and</strong> turned at the bottom of the tubing by a deflector <strong>and</strong> nozzle arrangement thatallows the stream to impinge directly on the casing. Holes, slots or pipe cutoff may be accomplishedwith the tool by slowly moving the tubing while cutting. The size hole produced is a function of pumpingtime, slurry velocity (nozzle design), <strong>and</strong> pipe movement. Depth of penetration is determined bythe pressure drop across the nozzle, the size of s<strong>and</strong> grains, the hardness of the target material <strong>and</strong>9-26
the pumping time. There is a point of diminishing returns in penetration where penetration is notextended for a longer pumping time. Time to form a perforation is on the order of 20 minutes.Water jet penetration of rocks has been used for several years as a drilling assistance tool, but hasalso recently been used for perforating. In one such device, water at several thous<strong>and</strong> psi is channeledthrough a flexible steel tube which is fed out of a tool in the wellbore. The casing exit hole isdrilled by a fluid-powered downhole motor.Pipe Cutoff MethodsThere are at least five methods of cutting off either tubing or casings. These cutoff methods may beused for pipe recovery prior to sidetracking operations or as explosive detonation to cut <strong>and</strong> shapeexit points for milling windows.The most common pipe cutoff methods involve either explosive or chemical cutters. Explosive cuttersutilize the same explosive technology used in perforating charges. Instead of a cylindrical cone, however,the explosive <strong>and</strong> the liner is arranged in a wedge so that the explosive front of the device willpush out on all sides <strong>and</strong> sever the pipe. Although the technique is effective in most cases, the externalpart of the pipe is left with a flare that is often difficult to wash over during pipe recovery operations.Chemical cutting has become one of the most common pipe cutoff methods, especially for tubing. Thespecial acid reacts extremely quickly <strong>and</strong> generates intense heat. It is sprayed through a nozzleassembly at the walls of the tubing all around the cutoff tool. As the fluid contacts the steel wall, a vigorousreaction occurs <strong>and</strong> the pipe is separated smoothly without leaving an external flare.Problems with both explosive system <strong>and</strong> chemical system are typically that only one side of the tubingis cut. Often it is necessary to pull the tubing into after the cut. In most instances, the pipe shouldbe held in tension during the cutting operation. Cutting on either explosive or chemical tools can beimproved by using the correct sizing of the tool <strong>and</strong> also centralizing the tool in the tubing. A furtherimportant point on the chemical cutter is to use a tool with nozzles that have not been worn byrepeated use. When chemical cutter nozzles are new, the fluid is sprayed out in a tight regular jetwhich impacts a small circular section of the inside pipe wall. As the nozzles become enlarged withconstant use, the tight stream becomes a wide spray <strong>and</strong> the fluid contact area is spread out over alarger section of the pipe. As this section is spread, the fluids may not cut as quickly as with a newtool.Abrasive <strong>and</strong> mechanical tools have also been used for tubing cutoffs. The abrasive tool uses a mixtureof s<strong>and</strong> <strong>and</strong> liquid jetted against the side of the pipe while the nozzle that sprays the fluids islocated. Cutting times are typically 5 to 20 minutes depending on available pump rate, nozzle size,clearance distance <strong>and</strong> pipe size grade <strong>and</strong> thickness.Cutting tubing with mechanical methods has seen several new tools come to the market in the lastseveral years. One tool which can rotate two or three blade cutters against the side of the tubing hasbeen shown to smoothly cut tubing into two to four minutes without having to pull tension in the string.The last tool is a temperature or thermite tool which is relatively new on the market. Insufficient dataon field performance is available at the present time.Questions1. What is the difference in productivity ratio (ratio of production from a unfractured perforated completionto an unfractured open hole completion) by completing a well with 8 shots/ft with 6" penetrationas compared to 4 shots per foot with 15" penetration (give both productivity ratio's).Assume 0" phasing <strong>and</strong> no damage.9-27
2. What is the actual production difference in question # 1 if zone height is 50 ft, open hole PI is 20barrels/day/psi, maximum drawdown is 500 psi <strong>and</strong> the API oil gravity is 29.3. For a gas well with an average core permeability of 30 md, what underbalance pressure is necessaryduring perforating to create clean perforations during underbalance perforating?Q = 12000 MCFldre= 1320 ftr,= 3 in.T= 200 Fpr = 11400 psigfb= 0.9 ftZ= 1.3kd= 15 mdkd,, = 20 mdh=50ftk,, = 300 mdrdp = 0.5 ftG = 0.63j~ = 0.40 CPN= 504. For the following conditions, what is the skin associated with perforating? (from McLeod’s equations)5. What are two well completion problems associated with expendable through tubing perforators?6. What amount of casing collapse resistance can be expected to be lost from perforating N-80casing at 16 spf with DP charges. Assume 60” phasing of the charges.7. Specify the gun size <strong>and</strong> charge type for perforating through an overlap section having 5-1/2”(17 ppf, N-80), cemented in 7” (32 Ib/ft, P-110) cemented in a 10-3/4” open hole in a hard s<strong>and</strong>stone.The well will be stimulated with a proppant frac after perforating.8. Specify the gun size, phasing, <strong>and</strong> charge type for a completion in an unconsolidated s<strong>and</strong> with9-518“ casing .<strong>References</strong> - Perforating1. Technology Review, (Schlumberger)2. Cook, M. A.: The Science of High Explosives, Krieger Publishing, American Chemical Society,1958.3. Aseltine, C. L.: “Flash X-Ray Analysis of the Interaction of Perforators with Different Target Materials,”SPE 14322, 60th Annual Tech. Mtg., Las Vegas, Sept. 22-25, 1985.4. Godfrey, W. K., Methven, N. E.: “Casing Damage Caused by Jet Perforating,” SPE 3043, AnnualFall Meeting, Houston, October 4-7, 1970.9-28
5. Bell, W. T., Shore, J. B.: “Casing Damage from Gun Perforators,” Bell, W. T., Bell, R. M.: “TheParadox of Gun Power vs. Completion Efficiency,” paper presented at the 1981 Explosive Conferenceof IADC, June 9-11, 1981.6. Locke, S.: “An Advanced Method For Predicting the Productivity of A Perforated Well”. J. Petrol.Technol., December 1981, pp. 2481-2488.7. Saucier, R. J., L<strong>and</strong>s, J. F.: “A Laboratory Study in Stressed Formation Rocks”, J. Petrol. Technot.,September 1978, pp. 1347-1 353.8. McLeod, H. 0.: “The Effect of Perforating Conditions on Well Performance,” SPE 10649, Presentedat the SPE Formation Damage Symposium, Lafayette, Louisiana, March 24-25, 1982.9. Hong, K. C.: “Productivity of Perforated Completions in Formations With or Without Damage,”J.P.T., (Aug. 1975), pp. 1027-1038.10. <strong>King</strong>, G. E.: “The Effect of High Density Perforating on the Mechanical Crush Resistance of Casing”,SPE 18843, Prod. Operat. Sym., Okla. City, March 13-14, 1989.11, <strong>King</strong>, G. E.: “Casing Crush Resistance Loss to High-Density Perforating: Casing Tests, SPE20634, 65th Annual Tech. Conf., September 23-26, 1990.12. Cheng, A. M.: “How Perforation Shot Density Affects <strong>Gas</strong> Well Performance,” World <strong>Oil</strong> (March1988), pp. 39-42.13. Klotz, J. A., Kruger, R. F., <strong>and</strong> Pye, D. S.: “Maximum Well Productivity in Damaged FormationRequires Deep, Clean Perforations”. SPE 4792 presented at Symposium on Formation Damage,New Orleans, Louisiana, February 7-8, 1974.14. Bundy, T. E., Elmer, M. J.: “Perforating a High Pressure <strong>Gas</strong> Well Overbalanced in Mud: Is ItReally That Bad,” SPE 16894, 62nd Ann. Tech. Conf., Dallas, Sept. 27-30, 1987.15. Bihn, G. C., Brown, S. A.: “Perforation Performance in the Kuparuk River Field,” SPE 14323,60th Ann. Tech. Conf., Las Vegas, Sept. 22-25, 1985.16. Harris, M. H.: “The Effects of Perforating on Well Productivity”, J. Petrol. Technol., April 1966,pp. 518-528.17. Bell, W. T.: “Perforating Techniques for Maximizing Well Productivity,’’ SPE 10033, Int. Mtg. Pet.Eng., Beijing, March 18-26, 1982.18. Bell, W. T.: “Perforating Underbalanced-Evolving Techniques,” JPT (Oct. 1984), pp. 1653-1 662.19. <strong>King</strong>, G. E., Anderson, A. R., Bingham, M. D.: “A Field Study of Underbalance Pressures Necessaryto Obtain Clean Perforations Using Tubing Conveyed Perforating,” J. Pet. Eng. (June1986), pp. 662-664.20. Colle, E.: ‘‘Increase Production with Underbalance Perforation,” Pet. Eng. Int. (July 1988),pp. 39-42.21. Young, W. S., Zaleski, T. E.: “Procedural Design Considerations Associated with Tubina-ConveyedUnderbalanced Perforating,” SPE 13646, 1985 Calif. Reg. Mtg., Bakersfield, Makh 27-29, 1985.9-29
22. Allan, J. C., Moore, P. C., Weighill, G. T.: “Experience of Perforation Under Drawdown UsingTubing Conveyed Guns on the Beatrice Field,” SPE 1401 2.23. Barnes, J. A., Swafford, C. V., Snider, P. M.,: “Single-Trip Tubing-Conveyed-Perforating, ProductionTesting, <strong>and</strong> Pressure Buildup Testing in Nonflowing Wells”, SPE 18841, Prod. Oper. Symposium,Okla. City, March 13-14, 1989.24. Kruger, R. F.: “Joint Bullet <strong>and</strong> Jet Perforation Tests,” API, 1956.25. Alien, T. 0. <strong>and</strong> Warzel, H. C.: Productivity Method of Evaluating Gun Perforating,” Drilling <strong>and</strong>Production Practice API (1 956), 11 2-1 25.26. Bell, W. T., Brieger, E. F., Harrigan, J. W., Jr.: “Laboratory Flow Characteristics of Gun Perforations,”4. Pet. Tech. (Sept. 1972), 1095-1 103.27. Halleck, P. M., Deo, M.: The Effects of Underbalance on Perforation Flow,” SPE 16895, 62ndAnnual Tech. Conf., Dallas, Sept. 27-30, 1987.28. Regalbuto, J. A., Riggs, R. S.: “High Differential Pressure, Radial Flow Characteristics of GunPerforations,” SPE 14319, 60th Annual Tech. Conf., Las Vegas, Sept. 22-25, 1985.29. Bonomo, J. M., Young, W. S.: “Analysis <strong>and</strong> Evaluation of Perforating <strong>and</strong> Perforation CleanupMethods,” J. Pet. Tech. (March 1985), 505-51 0.30. Stracke, M. L.: “Success in Offshore Gravel Pack Methods,” SPE 16212, Prod. Oper. Sym., Ok.City, March 8-1 0, 1987.31. Robson, M. K.: “Introduction to <strong>and</strong> Benefits of Tubing Conveyed Perforating,” J.P.T., February1990, pp. 134-1 36.32. Dudley, R. W.: “Reperforation of North Sea Electric Submersible Pump Wells using an ESP/Y-Tool/TCP System, SPE 16534.33. Holloway, M. L., Wesson, D. S.: “Tubing Conveyed Perforating Sucker Rod Pumping Wells,”SPE 18839, Prod. Oper. Sympos., Okla. City, March 13-14, 1989.34. Manohar, M. M., Morris, C. W., Hill, D. D., Brunner, S. R.: “Evaluating Underbalanced PerforatingConditions,” World <strong>Oil</strong>, November 1990, pp. 47-60.35. Garcia, D. J., Paslay, P. R.: “Prediction of Gun Cable Behavior,” when Perforating <strong>Gas</strong> Zonesunder High Reverse Pressures,” Explosives Conf. of the IADC, Houston, June 9-1 1, 1981.36. <strong>King</strong>, G. E.: “Perforating Multiple Strings of Casing: Getting Through the Overlap Zone,”SWPSC, Lubbock, April 1989.37. Regalbuto, J. A., Leidel, D. J., Sumner, C. R.: “Perforator Performance in High Strength Casing<strong>and</strong> Multiple Strings of Casing,” API 1983 Pacific Coast Mtg., Bakersfield, Nov. 8-1 0.38. Godfrey, W. K.: “Effect of Jet Perforating on Bond Strength of Cement”, JPT, (Nov. 1968),pp. 1301 -1 306.39. Crump, J. B., Sabins, F. L.: “Guidelines for Selecting Cement that will be Perforated,” SWPSC,Lubbock, April 1989.40. Halliburton Fracbook.9-30
41. Pittman, F. C., Harriman, D. C., St. John, J. C.: “Investigation of Abrasive-Laden-Fluid MethodFor Perforation <strong>and</strong> Fracture Initiation,” JPT, (May 1961), pp. 489-495.42. McCauley, T. V.: “Backsurging <strong>and</strong> Abrasive Perforating to Improve Perforation Performance,”JPT, (Oct. 1972), pp. 1207-1212.43. “The Lance Formation Penetrator Tool,’ a technical report of Penetrators Inc., Oct 15, 1985.9-3 1
Chapter 10: Formation Damage - Causes <strong>and</strong>PreventionsThere is an old adage that you cannot hurt a good well. It is wrong.Formation damage is a term that may be applied many well productivity impairments, many of whichhave nothing to do with a problem in the formation.’p2The goal of this chapter is to explain, identify <strong>and</strong>suggest removal methods for formation damage.There are four questions that must be considered in formation damage investigation.1. What is the damage?2. Where is the damage located?3. How much damage is present?4. How is it affecting the productivity of the well?The study of damage is necessarily linked to diagnostics of the damage, the topic of the next chapter.As causes of damage are discussed, some mention will be made of ways to identify <strong>and</strong> quantify thedamage. These brief comments will be explained further in Chapter 12 the Diagnostics Chapter.Many of the most common damage mechanisms are described in Table 10.1. This data also givesdiagnostic clues <strong>and</strong> treatment suggestions that will be advanced in the chapter on Chemical Stimulation.For purposes of description, the causes of damage are often divided into natural <strong>and</strong> completionsdamage. Natural damage includes those factors that will primarily occur as a result of producing theoil or gas. Completions damage is something that happens as a result of a completions, repair or stimulationoperation. Unfortunately, some completion operations can trigger natural damage mechanisms.Eliminating or reducing the effect of natural damage is part of the completions design step.Naturally occurring damage includes clay problems, hydrates, water formed scale, tar deposition, relativepermeability problems, some emulsion formation, paraffin, asphaltenes <strong>and</strong> other hydrocarbondeposits which impede flow. Completion oriented damage includes particle plugging by entrained particlesin the injected fluids, some emulsions, wettability changes, acid reaction, acid by-products, ironprecipitation, iron triggered sludges <strong>and</strong> numerous other factors. Each of these will be addressed.Table 10.1 : Common Damage TypesICondition or Type of Damagehydrates (ice)migrating finesDiagnostic Cluesgas well, interrnttent flow, near totalshutoff, followed by return to flow in a fewminutes; produces a small amount ofwateroil well, usually only forms near mud linein arctic regions; may also form in drillingmudkaolinite or fibrous illite clay or some feldspars(non clays): brine salinity changesmay trigger fines movement; sporadicreductions in flow rate, variable productionrate tests; fines in prod, emulsionsrare but possibleRemedialglycol or alcohol in1 below hydrate forrnaconpoint. Insulated risers or tubing.insulated risersclay control for prevention; retarded acidfor removal: may need to limit rate inextreme case10-1
Table 10.1 : Common Damage TypesCondition or Type of Damageswelling claywater blockspoor load fluid rec.fill in perfsfill in casingparticle damagefracture pluggingconing of watercommingled water productionwaterflood breakthrough throughhigh permeability zonemicro porosityemulsionDiagnostic Cluessmectlte clay, sometimes iwte <strong>and</strong> smectiteinterbedded clay; permeability is sewsitive to change in water salinity or brinetypeusually gas well, small pore throats,untreated water, low pressure formation;if very low pressure (c about 0.2 psilft),pore throat size doesn't matterusually formation dependent; maydecrease production rate in severecases or cause long cleanup time. Mostcommon in formations with small pores<strong>and</strong> microporous clays.high skin, can inject into well at very lowrates; reperforating may show sharpincreaseshigh skin, difficult or impossible to injectinto well; partial fill will show skin on abuild up but injection possible at areduced rate; confirm with a sinker baron wirelineskin on buildup test, difficult to inject;sometimes shows emulsions in oil wells;poor mud condktioning before cement;frequently encountered in open holecompletions <strong>and</strong> horizontal wellsmay also be encountered following acidor frac stimulations or workover fluidswhere a dirty water was used or thewater was hauled or stored in a dirty tankcan reduce injection in flood projects -backflow shows particles <strong>and</strong> oil carryoverreturnlarge whole mud losses in naturally fracturedformations; intermittent productionat low <strong>and</strong> moderate rates; infrequentrecovery of whole mud <strong>and</strong> mud fines.Some emulsions, especially after acidtreatments; may also occur if hole ispoorly cleaned during drillingonset of water production after extendedproduction; formation has no vertical permeabilitybarriers <strong>and</strong> sufficient verticalperm to allow water to move towarddrawdowninitial production of water with oil in primary,with breakthrough in flood; watercut increases in floodexamine produced water analysis <strong>and</strong>compare with flood watercaused by some forms of clay; may bindwater <strong>and</strong> make high Sw readings on logunstable emulsions, breaks on st<strong>and</strong>ing;created in tubing at pressure drop pointsin piping system from pumps to chokeRemedialacme With HC~I- it damage IS shallowFrac if damage is deeper than 12"matrix treat with alcohol or surface tensionlowering surfactant; inject gas in gas reservoirto distance of 10 ft.Prevention - avoid or minimize water contact<strong>and</strong> lower surface tension of water.Removal - alcohols <strong>and</strong> some surfactantscleanout or reperfreverse circulation or regular circulation.HCI or HCWHF acid in matrix acid job solventwash follow with acid in wells with oilbase mud; foam or jetting cleanups areoften usefulfilter treatment fluids - use clean tanksbetter cleaning of wateracid useful if damage is shallow; frac ifdeep; to prevent, improve solids recoverylimit rate, some treatments may temporarilybe useful; most water control productsare not useful without naturalreservoir baniersno treatment or temporary at besthigh permeability zones should beplugged deep (&loo') from producer <strong>and</strong>injector when oil recovery from zone iscompleteno treatment necessaryno down hole treatment suggested; treaton surface if string redesign is impractical10-2
Table 10.1 : Common Damage TypesCondition or Type of Damagesilt stabilized emulsionoil base mud emulsion damagewaterflood breakthrough throughhigh permeability zonesurfactant stabilized emulsionsludgeparaffin in tubularsparaffin in formationparaffin after stimulationparaffin in flow linesDiagnostic Cluesvery stable emulsion. Dartta\lv wettedfines at interface; common aher drillingmud dispersement or cleanup of mud orcement fines by acid; may also occur onpolymer cleanup; common in productionform unconsolidated formations, especially after acid or gravel packing operationsvery common in wells drilled with oil basemud; if treated with acid or brine beforethe sulfonate emulsifiers are washed offthe cuttings by production or solventtreatments, an emulsion from that canlock up the well; the first one or two treatmentsmay be short lived as more mud<strong>and</strong> mud filtrate moves back toward thewellbore, this is often the case in naturallyfractured formationsexamine produced water analysis <strong>and</strong>compare with flood waterstable to very stable emulsion; commonto severe after acid treatment; may beable to see the stabilized skin at the dropinterfacesludge is an emulsion that is nearly solid;it may be triggered by acid, oil basedmud, asphaltenes, or iron compounds;disperse the sludge in xylene <strong>and</strong> analyefor components, particularly ironpressure restriction in tubulars; soft tohard mass found at press drops: colorreddish brown to black; even white orgray possible; also frequently occurs intubing near surface as oil cools <strong>and</strong>cloud point is reached; may becomeincreasingly a problem as field ages;most paraffin deposits melt at c1 5OoFseen as skin on test, may or may not disappearif well is shutin for several days;cloud point of oil is near the reservoirtemperature; pressure drop may triggerparaffin drop outinjection of a cool stimulation fluid mayprecipitate paraffin in reservoir on contact;well may be clean up slowly (1 to 4weeks) after stimulation even thoughload fluid is recovered more quickly; maysee a decreasing skin if multiple builduptests are runsoft to hard deposits (not scale) in surfaceflow lines <strong>and</strong> equipment; paraftinwill mett when exposed to enough heat(usuallv. about 1 5OoF is sufficient)Remedialdownhole source of solids if possiblewash with aromatic solvent followed bymutual solvent <strong>and</strong> acid; may require severaltreatments; cuttings removal is importanthigh permeability zones should beplugged deep (&-loo') from producer <strong>and</strong>injector when oil recovery from zone iscompletetreat on surface if temporary; use mutualsolvent or surfactant to prevent emulsionwith next acid jobprevention is best cure; use non sludgingacid systems, test with iron contentexpected in wellscraping, cutting for mechanical removal;hot oil useful if deposit is c100 ft from surface;solvent soaks on deeper deposits;some inhibitors available for pipelines <strong>and</strong>few problem wells; some wells requirecontinuous downhole treatment throughmacaroni string; special bacteria are usefultreat with downhole heat generating processesif well is good producer; solventsoaks also used; some inhibitors availableto be used with a frac treatmentallow the well to clean up on its own; usexylene preflush ahead of acid when theproblem is known to occurmechanical or solvent removal or pigging;inhibitors can be used10-3
Table 10.1 : Common Damage TypesCondition or Type of Damageasphaltenestarcalcium carbonate scalecalcium sulfate scalebarium sulfate scalewettability problemsrelative perm problemDiagnostic Cluessoft to hard black mass that may occuras flakes, sludge, marblesize balls <strong>and</strong>as a stick buildup often occurs with paraffin;precipitation is triggered by destabilizationof maltene resins caused by acidcontact, outgassing, shear in pumps,electrically charged metal surfaces, ternperature reduction, <strong>and</strong> CO2; asphaltenessoften with increasing temperature(t>150°F) but do not melt.flows very slowly into perfs during prcductionof oil; usually associated with thepresence of a tar deposit near pay, frequentlyhighly asphaltic; may containsome water that is tied up as droplets or"pockets" in the high viscosity massmay form at any pressure drop, either inthe formation or in the tubulars; may formvery fast <strong>and</strong> can sharply limit productionespecially at gravel pack interfaces ornear perfs in wells with high draw downacross the perforations; may occur morefrequently in earlier stages in some fieldswhen pressure drop is more severe:there is usually no crystal patternusually forms at pressure drop whereinduced by turbulence; more frequentwhere high sulfate waters contact highcalcium waters <strong>and</strong> in COp floods; scaleis not acid soluble; may be found on outsideof pumps <strong>and</strong> at intakes <strong>and</strong> gasexpulsion ports <strong>and</strong> valves in downhole;crystals are characteristic for this scalenon reactive scale that forms at pressuredrawdowns or where outgassing occurs;no readily apparent crystal pattem inmany deposits; may occur as radioactiveNORM scale in some areas where radicactiveisotopes form in the lattice. NORMscales are detectable with gamma raylogging toolsfrequently occurs after an acid job wherethe corrosion inhibitor was not mixed inthe acid just before injection; emulsions<strong>and</strong> reduced flow are common, particularlyafter inhibitor loss or oil base mudcontact; may be temporary or permanentbut most clean up slowly with time <strong>and</strong>flow; attempts to reverse natural wettabilityusually are short lived; natural wettabilityis determined by the naturalsurfactants in the produced fieldsmay occur when oil is injected into a gaszone or gas is injected into an oil zonethat is above the bubble pointRemedialtreatment with aromatic (cyclic nng) solventssuch as xylene or toluene; somesurfactants are also useful for dispersionof asphaltic mass; use anti-sludge additiveor xylene with acid in reservoirs withmore than 0.5% asphalt to prevent sludgessolvent soak as needed; test solvent withsample of tar before job; heat often helpsHCI to remove <strong>and</strong> inhibitor to prevent;inhibitor may be squeezed into the formationfor longer lived protection; some HCIjobs may trigger calcium carbonate scalein rare cases; inhibit acid or treat withEDTA if this is a problemchemical converter or dissolver followedby acid; (do not contact converter or dissolverwith acid): acid is not useful byitself; inhibitors placed by squeeze treatmentsare useful to preventscraping, water blasting or other rnechanicalremoval; chemical treatment is usuallynot possible if scale occurs as nearly pure(>go%) deposit or as thick (>1/4", 6 rnm)deposits in pipes. Can be prevented byinhibitorstreat with mutual solvent wash over thepay, displace <strong>and</strong> soaktreat with high API gravity solvent such ascondensate or xylene (low flash point);squeeze <strong>and</strong> produce back10-4
~~ ~~Table 10.1 : Common Damage TypesCondition or Type of Damageretrograde condensatetubing problemsaltbacterial infestationpoor perforationsunstable formationDiagnostic Cluesa Special case of relative Permeabilityeffect; a condensate (liquid phase) thatforms from a rich gas; if the condensateforms in the tubing or casing, headingmay occur; if condensate forms in theformation -creation of another phase willreduce permeability to gas; usuallyoccurs near wellbore as pressure dropsnear the wellborewell refuses to flow although pressure issufficient with the expected assistancefrom dissolved gas; well may head <strong>and</strong>die or liquid slugs may be produced ifstring is too large; rate is restricted byfriction back pressure if tubing is toosmallsalt precipitates as a white mass in thetubulars or in the formation; usually associatedwith a cooling of super saturatedwater but may also be triggered by apressure drop: may be seen early in thelives of some wells <strong>and</strong> becomes less ofa problem as water cut increases; lookfor problems in formations with producedwater salinity that is near saturationa difficult problem to predict; it is morecommon in injection wells where surfaceor produced water is injected, if the colonyis established in the water h<strong>and</strong>lingsystem, it can occur with injection of anywaters; when tubing is pulled, brown toblack slimy masses or an H2S odor areindications; bacteria may cause slowreductions in the injectivity of a wholefield; complete removal of the bacteria israrely possible -treatment is usually on aremedial basis; untreated water in treatments;drilling fluid or injection water cansour reservoirs with SRB bacteriashows up as damage on a build up testbut cannot be cured with acid ormechanical changes in the well; problems such as screenouts of frac jobs,high injection pressures, s<strong>and</strong> production,downhole scale occurrence, unstableemulsions, <strong>and</strong> downhole paraffin<strong>and</strong> asphaltene deposits are common;problems with a well that cannot be brokendown or even pumped into shouldalways be approached by reperforatingthe wellmay occur in any formation that is poorlyconsolidated or that will fail under pressure;may occur with onset of water productionor loss of pressure fromdepletion; problems include embedmentof proppant, closing of acidized channelsin acid fractures, spalling of formationinto perfs or wellbore or production ofsolidsRemedialcontrol draWdOWnS <strong>and</strong> repressure reservoir;redesign tubing if forming in tubularsredesign string; a velocity string that will fitinside existing tubing may help if tubing istoo largefresh water or weak brine washtreat with bleach followed by HCI (do notallow contact of bleach <strong>and</strong> HCI); morethan one treatment may be necessary;alternative treatments are chlorine dioxide<strong>and</strong> bactericide slugsreperfgravel packing, plastic consolidation, orrate limits10-5
Table 10.1 : Common Damage TypesCondition or Type of Damagecollapsed pipeleaksDiagnostic Cluesmay show UP as reduced rate or destructionof lift equipment. Check with a gaugering on wireline or tubing. Has a varietyof causes including severe corrosion,malfunctioning perforating guns, pipeflaws <strong>and</strong> wear of tubulars from drilling orlift system. Most common causes areearth shift loads caused by subsidenceof producing formations with fluid <strong>and</strong>s<strong>and</strong> withdrawals, active faults, <strong>and</strong> formationmovements near salt zones.sudden changes in GOR, WOR, pressure,or chemical analysis of waterRemedialIf caused by earth Shin torces, use heavierpipe or multiple strings. Liners, cement,<strong>and</strong> patches used for repair.repair;consider corrosion control programClaysClay primarily occurs in s<strong>and</strong>stones. Although some exceptions are known, most carbonates do nothave reactive clay in significant amounts.The materials classified as clays have a common size range, normally less than five microns, but mayhave various chemical compositions, different reactivity to pore fluids <strong>and</strong> many physical arrangements.The presence of clay does not necessarily mean that there will be a problem with clay duringproduction or treating of the well. To be a problem, the clay must be in the larger pores of the reservoirin large quantity <strong>and</strong> react in a detrimental manner with the fluid flowing through the pores. If the clayoccurs only in the smallest pores or a part of the matrix, it will not be a problem, regardless of its reactivity.Table 10.2 shows approximate major component analysis as well as surface area exposed per unitweight of quartz <strong>and</strong> common authigenic clays3 It is this vast surface area-to-mass ratio that makesthe clays so important; they may be involved in literally hundreds of adsorptions, absorptions <strong>and</strong>chemical reactions. Adsorption describes a process that is a coating on a surface that does not penetrate,like paint on a non porous wall. The paint does not significantly increase the volume of the wall,although it bonds very tightly to the wall. Absorption is filling the pores without adhering to the surface,like water in a sponge. Just like wetting a dry sponge, as water is admitted into the sponge, thesponge swells. An illustration of surface area is needed to underst<strong>and</strong> its overwhelming effect on achemical reaction. The weight of a 2" x 4" wood block is roughly similar to the same basic cellulose ina typical big city Sunday newspaper. The surface area of the wood block may be about 1 square foot<strong>and</strong> the surface area of the Sunday paper may be over 1000 square feet. Now, touch a lighted matchto each <strong>and</strong> see the difference in reactivity! Although the reaction of water on clays is indeed differentfrom the pyroactivity of paper, any reaction of the water <strong>and</strong> the clay will proceed much faster on claywith a very large surface area.QuartzKaoliniteChloritelllite(Smectite or Montmorillonite)Table 10.2I Particle I Major Components I Common Surface Area 1SI, 0AI, Si, 0, HMg, Fe, AI, Si, 0, HK, AI, Si, 0, HNa, Mg, Ca, AI, Si, 0, H0.000015 m2/gm22 m2/gm60 m2/gm113 m2/gm82 m2/gm10-6
The distinction between types of clays is more of arrangements of the atoms in a crystalline structurethan a major difference in chemical formula. The location of the clay is critical to its reactivity; if theclay is in a pore throat as fill or as a lining; it is authigenic, that is, grown in the pore from minerals inthe connate water.4 Authigenic clays have a large amount of surface area exposed in the pore <strong>and</strong>can be reactive. If the clay is part of the building material in the original matrix, it is detrital. Detritalclays are usually less reactive that authigenic clays because they have less surface area in contactwith the fluids in the pore. Clay may also be a cement that holds the matrix grains together. As acement, it may react with some fluids such as acid <strong>and</strong> water to disaggregate the formation. If the claycement is shielded by a quartz overgrowth, as is common in many s<strong>and</strong>stones, the clay will not bereactive. Only the authigenic clays, the unprotected clay cements <strong>and</strong> the few detrital clays on thepore boundary are worth concern as potential damage mechanisms. The vast majority of detrital claysare just not contacted by sufficient volumes of fluids. Remember, just because clay is present in theformation, does not mean that a clay reaction will occur.Authigenic clay minerals orient themselves as they are formed from the formation water <strong>and</strong> often createone or two favored physical forms that may be recognized from scanning electron photographs,Figures 10.1 <strong>and</strong> 10.2. Recognition of the type of clay should not be staked entirely on an SEM analysis.Focused dispersive X-Ray analysis is much more accurate. Even after identification of the clay,laboratory core tests are often required to see if the core is reactive with a given fluid. Just becausethe clay is in the rock does not mean that it is reactive.Figure 10.1(Amoco Production Co.)10-7
Figure 10.2(Amoco Production Co.)Common Types of ClayThe four common clays that account for most of the real <strong>and</strong> perceived clay problems are kaolinite,smectite (formerly called montmorillonite), illite, <strong>and</strong> chlorite.Kaolinite - Kaolinite is chemically stable <strong>and</strong> will not react appreciably with HCI acid. However, it issoluble in HCI/HF acid. Kaolinite poses potential production problems for two reasons: some formshave been noted to have a loose attachment to the host grain <strong>and</strong> its large individual particle size cancause blocking of pores.Smectite (Montmorillonite) - Smectite refers to a group of clays which are water sensitive to varyingdegrees. The extent of water sensitivity of these “swelling clays” is determined by the amount ofsodium in the composition.* Production problems with smectite may rise in two areas; water sensitivitythat may swell the clay <strong>and</strong>/or give off pieces of the clay (clay fines) <strong>and</strong> high microporosity.10-8
Mite - lllite clays may form in several shapes <strong>and</strong> may often be found associated with the smectites inmixed layer clay. Problems posed by the illites include high microporosity <strong>and</strong> a tendency for someforms of the illite to break <strong>and</strong> move as particles or act as traps for other particles.The high microporosity in the illites, like that in smectite, offers a trap for migrating particles as well asbinding water to the host.The fibrous form of illite resembles fine hair or spider web fibers. Thick accumulation of these filamentsare effective snares for micron size debris <strong>and</strong> may break <strong>and</strong> migrate. They are among themost difficult forms of the clays to stabilize. Fortunately, illite in the fibrous form is less common thanthe mixed layer occurrences of illite/mica <strong>and</strong> illite/smectite.Chlorite - Chlorite usually has a strong attachment to the host grain <strong>and</strong> is not commonly associatedwith migrating clays although it can serve as a collection point for migrating debris. Chlorite is slowlysoluble in HCI acid, but may cause problems due to high iron content if the acid does not contain asuitable chelating or sequestering agent. If the unsequestered acid spends completely, iron can precipitateas iron hydroxide <strong>and</strong> block pores.Water lmbibition of ClaysClays may change volume as a fresher or more saline fluid flows through the formation. Severalauthors have contributed work on clay swelling in s<strong>and</strong>stones showing either cation exchange, movement,or critical salt concentration that triggers clay dispersement."1° The changes in formation permeabilitydue to alteration of clay are due to the amount, location, <strong>and</strong> type of clay minerals within theformation. The total quantity of clay inside the formation is a misleading indication of potentialchanges to permeability. It is the arrangement of the clay, its chemical state at the moment of contact,<strong>and</strong> the location of the clay with respect to the flowing fluids that are responsible for the changes. Predictingthe response of a clay to water flow is almost impossible without testing. However, smectite isreactive a majority of the time when it occurs as an authigenic clay. When smectite is known to exist ina formation, a 3 to 5% KCI (potassium chloride brine) is usually a good choice for a completion or killfluid until the reactivity of the core can be tested. The large pores are not important since they dominatethe flow contribution to the permeability.Clay SwellingClays swell by two established mechanisms: crystal adsorption of water <strong>and</strong> osmotic swelling. In crystaladsorption, all clays absorb some water, including illite <strong>and</strong> kaolinite. However, this highly orderedcrystalline water is held tightly to the clay surface, like adsorption. Osmotic swelling occurs as a resultof a concentration imbalance between ions held at the exchange sites on the clays <strong>and</strong> the ions of thecontacting water. When the ionic concentration of the interlayer region between the clay platelets isgreater than the ionic concentration in the contacting fluid, water will be drawn into the interlayerregion <strong>and</strong> the clay is swelled. The amount of swelling can be six fold in severe cases. The amount ofpermeability reduction will depend on the arrangement <strong>and</strong> amount of the reactive clay in the largestpores. Figures 10.3 <strong>and</strong> 10.4 are typical core test responses for water influenced reactions of salinityshock (temporary change in permeability <strong>and</strong> clay swelling respectively).Clay DispersionClay is not the only material that can move in a rock. Feldspar, silt <strong>and</strong> even small grains can be rearrangedby physical flow forces or by chemical or physical reactions as water or organic liquids movethrough the reservoir. Groups of clay platelets can be dispersed by contact with water that has a differentionic concentration or type than the connate water if the clay is reactive. Dispersion may also becaused by a physical reaction in which the clay surface wetting is changed by a mutual solvent oralcohol. Dispersion is the separation of the clay platelets from each other <strong>and</strong> from the pore wall. Thiscan create a considerable amount of migratable fines. How much damage it does depends on whetherthe fines are created <strong>and</strong> whether they can block enough large pore throats to have an effect on permeability.10-9
.......i6% NACI.i. ................................................. : ........................ -..-- ....60 100 130 200TOPAL FLUID FLOWED CCFigure 10.3: Salinity shock showing no permanent formationdamage when switching brine salinity level <strong>and</strong> type.j0 1 -ID0 200 aon I00 6000 BOOTOTAL VOLlihlE OF WATICll FWWEL) CCFigure 10.4: Water sensitivity test on a core that is sensitive toboth brine type <strong>and</strong> brine concentration.Producing the injected (foreign) water from the formation <strong>and</strong> reestablishing contact with connate fluidsmoving through the rock can help return at least some of the initial permeability of the formation.This happens when the clay can adjust to the connate water by giving up some of its recently boundwater <strong>and</strong> shrinking. Flow of a brine through a core sometimes results in a greater stable permeabilitythan the initial permeability. This can be caused by dissolution of a salt in the pore or by shrinking of aclay in the large pores. Some moving clays can even be redeposited on contact with a stable fluid.5Use of KCI <strong>and</strong> NH CI (ammonium chloride) brines, or oil based fluids may help avoid the swellinginfluenced dispersion tendencies of most clays. Dispersion caused by physical fluid movement maynot be avoided unless the fluid flow velocity is below the critical level for fines movement.Other Clay ProblemsHigh microporosity or a dense growth of the clay in the pore throats produces ultra small pore throatsthat plug off quickly when exposed to fine solids <strong>and</strong> can sharply reduce permeability. Thismicroporosity is much like a second matrix forming in the larger matrix of the formation; this actionreduces the pore throat size to a fraction of original <strong>and</strong> reduces permeability. High microporosity alsoreadily traps water <strong>and</strong> can result in high water saturation calculations from resistivity logs. The bound10-10
water influences the water saturation calculation without actually being able to move. Thus, some formationswith a high water saturation value can actually produce water free. SEM photomicrographs ofthe high microporosity created by smectite are shown in Figure 10.5. Once again, it is the large surfacearea of the clay that plays a deciding role.(Courtesy of Amoco Production)Figure 10.5: SEM view of high microporosity Smectite clay in apore from an Alaska core.Paraffins <strong>and</strong> AsphaltenesParaffins (wax) <strong>and</strong> asphaltenes are organic solids that may deposit from a crude oil during production.Pure paraffin is white <strong>and</strong> pure asphaltenes are black. Both materials may occur mixed in thesame deposit. When asphaltene is absent, the precipitated paraffin may be straw colored, red, green,gray or brown. When asphaltene is present, the mixture is usually black.When a deposit is recovered from a well, it is imperative that the identity of the deposit be obtained.The treatments for removal of paraffin <strong>and</strong> asphaltene are different, <strong>and</strong> many of the common paraffinremoving materials are not effective in removal of the asphaltene. Designing a completion for controlof asphaltene is different from that for paraffin since the deposition of asphaltene can often be preventedby avoiding fluid shear, outgassing, chemical upsets <strong>and</strong> mixing of incompatible fluid streams.Paraffin control is based on temperature <strong>and</strong> pressure preservation, avoiding of sharp pressure drops,<strong>and</strong> injection of inhibitors.The quickest method of determining whether a deposit is asphalt or paraffin is to apply a small amountof heat. Paraffin will melt, asphaltenes will soften slightly but will not melt completely. Asphaltenesalso usually sink in fresh water while paraffin flakes float (mixtures may do either!).Paraffins are the simplest of the hydrocarbons. They are composed of only carbon <strong>and</strong> hydrogenatoms <strong>and</strong> the carbons occur as an unbranched chain. Paraffin chain length associated with formationof solid wax deposits begin at 16 or 18 carbons per molecule <strong>and</strong> may have 60 or more carbons. Theprecipitation of paraffins is triggered by the loss of pressure, loss of temperature, <strong>and</strong>/or loss of shortchain hydrocarbon compounds (light ends). The temperature at which the first solid paraffin crystalforms from an all liquid solution is called the cloud point. Designing a completion to produce to the surfaceabove the cloud point or modifying the cloud point through chemical methods are accepted practicesto prevent paraffin deposition in the tubing.10-1 1
Melting points increase as the length of the paraffin chain increases. The hardness of the solid paraffinstructure also increases with molecular size. The following table lists several paraffin chain lengths<strong>and</strong> their melting points. Impurities may cause the melting point of field samples to vary slightly.Table110.3INumber of Melting PointI Carbon Atoms “F1664177218822000253242496012915818119621 1Paraffins may form anywhere in the producing system when the conditions became favorable for precipitation.12-16Paraffins are normally found in the tubing near the surface where the temperature <strong>and</strong>pressure drops are highest. In cases such as nearly pressure-depleted reservoirs or in formationswhich have experienced dry gas cycling (which removes the light hydrocarbon ends), the paraffins canform at the perforations or in the formation. Paraffin may also be precipitated by injection of a coolfluid.” Although not generally considered, this cause may be the reason for slow cleanup of manywells after a stimulation.Paraffins normally form by nucleation. A “seed crystal of paraffin or other solid material in the producedfluid offers a nucleus or site for rapid growth of paraffin. The longer chain molecules attach tothe nucleation sites <strong>and</strong> the crystal grows large enough to drop from the produced fluid stream. If thecrystal attaches to the tubing, further growth occurs from the paraffin in the produced crude <strong>and</strong> ablockage will eventually occur. Most prevention techniques work on blocking the nucleation sites.Rates of deposition of paraffin are variable. Problems with entire fields are common, but paraffin depositionof only one or two wells in a unit is also known. Individual well variances in pressure drawdown,flow rate, temperature loss <strong>and</strong> mechanical equipment may be significant enough to lead to aproblem in a borderline paraffin deposition area. The most common depositional sites for paraffin arein the upper section of the tubing. This site is favored since pressure <strong>and</strong> temperature are both loweredas the produced fluid nears the surface. Other high incidence areas are downstream of pressuredrops such as perforations, downhole restrictions, tubing <strong>and</strong> pump intakes <strong>and</strong> wherever fluids(especially cooler fluids) are commingled.Asphaltenes are organic materials consisting of condensed aromatic <strong>and</strong> naphthenic ring compounds(Figure 10.6) with molecular weights of several hundred to several thous<strong>and</strong>.1s25 They are characterizedby the nitrogen, sulfur <strong>and</strong> oxygen molecules they contain <strong>and</strong> are defined as the organic part ofthe oil that is not soluble in a straight chain solvent such as pentane or heptane. Asphaltenes are generallyfound in one of three distinctive forms: (1) a hard coal-like substance <strong>and</strong> (2) a blackenedsludge or rigid film emulsions (often triggered by iron in solution), <strong>and</strong> (3) in combination with paraffin.In “solution,” they usually exist as a colloidal suspension, stabilized maltene by resins within the oil.The colloidal particles are 30 to 65A in diameter. The volume of these resins (also called maltene resins)is the first key to the stability of the asphaltene in suspension. The actual quantity of asphaltenesin the oil is much less important. The stability of asphaltic dispersions depends on the ratio of thequantity of resins to the quantity of asphaltic materials. Ratios larger than 1 :1 (resins to asphaltenes)are stable, while ratios less than 1 :1 are unstable <strong>and</strong> may precipitate during production. Ratios of10-12
10+:1 are known, <strong>and</strong> no asphaltic problems are usually reported with these oils. Although asphaltenecontents of up to 60% are known, the major problems occur with oils in the about the 1% to 3%asphaltene range.(Stout)Figure 10.6: Structure of the basic asphaltene building block.Variations are the rule. Common components are N,S, HI C <strong>and</strong> OH, among others. Bonding varies.Asphaltene precipitation can be influenced by pressure drops, shear (turbulence), acids, solution CO2(lowers the pH), outgassing of CO2 <strong>and</strong> other gasses (turbulence), injected condensate, gas, cornminglingwith other (incompatible) oils, <strong>and</strong> charged metal surfaces.2G32 Anything that takes away theresins or breaks the stability of the micelle will lead to a precipitation of asphaltene.EmulsionsEmulsions are combinations of two or more immiscible fluids (including gas) that will not molecularlydisperse into each other.3s44 Emulsions are composed of an outside phase (also called nondispersedor continuous) <strong>and</strong> an inside phase (also called dispersed or discontinuous). The inside phase aredroplets suspended in the outer phase, Figure 10.7. Almost all emulsions found in the field are producedby addition of some form of energy that produces mixing. Most emulsions break rapidly whenthe source of energy is removed. The breaking mechanism of these unstable emulsions is by dropletcontact <strong>and</strong> growth, <strong>and</strong> then by fluid density separation. As the droplets draw near <strong>and</strong> touch, thesurface film around the drop may thin <strong>and</strong> rupture, forming large drops in a process called coalescence.The larger droplets settle rapidly due to density differences between the liquids forming separatelayers. Only a portion of the drops that touch will coalesce. When only a few droplet contacts leadto coalescence, the emulsion is stable.oil-in-wa t erwater-in-oilFigure 10.7: Representation of the two types of all liquid emulsions: water-in-oil (oil external)<strong>and</strong> oil-in-water (water external). Volumes of the inner or the dispersedphase may vary from 0 to over 70%. Emulsions are stabilized by presence ofsolids at the interface.10-13
The shared surface of two immiscible substances is the interface. Emulsification, wetting <strong>and</strong> foamingare affected by what goes on at this interface. The interface is characterized by a film that is the trueboundary between the inner part of the emulsion, the droplet, <strong>and</strong> the outer or continuous phase. Thefilm (Figure 10.8) surrounding each droplet of the internal dispersed phase, especially in the bubbleinterference region of from 50% to 74% internal phase volume is probably the most important reasonfor stability of oil field emulsions. The toughness of this film keeps the droplets from directly touching<strong>and</strong> coalescing into larger drops. The film is the interface boundary <strong>and</strong> may have an electrical chargeon each side (charge double layer). Emulsion properties are affected by the type of film.Schematic of the surface surrounding a droplet of dispersed fluid in acontinuous fluid.continuous fluid or outter fluidrounded surface is the smallestinner fluid \area - minimizes energy.Figure 10.8: Schematic of the surface surrounding a droplet of dispersedfluid in a continuous phase fluid. The surface of the film is a“high energy” environment where natural surfactants congregate.The droplets will be rounded as the drop forms the lowestenergy shape. Small areas between fluids may be filled by athird phase such as oil in a water-gas foam.The ratio of the total volume of the droplets of the dispersed phase to the external or continuousphase is known as the phase ratio. This ratio influences the behavior <strong>and</strong> properties of the emulsion toa very significant extent. Alteration of the phase ratio can lead to making the emulsion more stable orbreaking the emulsion. When the internal phase is less than about 30% by volume, Figure 10.9, (lowphase ratio), the drops do not interfere with each other <strong>and</strong> the properties of the whole system (includingthe apparent viscosity) are determined by the continuous phase. As the amount of dispersedphase is increased, the droplets begin to collide more frequently, <strong>and</strong> droplet interference begins. Thiscauses an increase in the viscosity of the emulsion. This viscosity increase continues until the dispersedphase volume is about 52% (the volume ratio of uniform spheres packed in a cubic array). At adispersed phase volume of 74%, the droplets are so closely packed (Figure 10.9) that they can nolonger be spheres unless they are multisized (polydispersed). Viscosity of the emulsion increases rapidlyat this point because of the energy required to overcome the resistance of the droplets movingpast each other when the liquid must flow.Most emulsions will separate quickly due to fluid density difference when the energy source thatcaused mixing is removed. If separation does not occur, there is a stabilizing force acting to keep thefluids emulsified. The most common stabilizing forces are modification of the surface film strength atthe interface by chemical reaction, precipitation or addition of partially wetted fine particles, by electriccharge or by high viscosity of the components or the resultant viscosity. They may act singly or incombination. Natural surfactants help stabilize emulsions by stiffening the film around the droplet orby partially wetting very small solid particles. The natural surfactants are present in many waters <strong>and</strong>most crude oils. They may be of several chemical formulas <strong>and</strong> may be bacterially created or occur aspart of the oil generation process. Like other surfactants, they have an oil soluble end <strong>and</strong> a water solubleend (usually possessing a small electric charge) <strong>and</strong> congregate at the interface of the water <strong>and</strong>oil. Micron size solids in the liquid may stabilize the emulsion by increasing the toughness of the filmor acting as the emulsifier by binding droplets of the dispersed liquid with electrical charge. Almostany solid can be a stabilizing agent if it is small enough. For a solid to be effective in stabilizing anemulsion, it must be present at the interface of the drop <strong>and</strong> the continuous phase.The more common solid materials found stabilizing emulsions are:10-14
dispersed interference deformation I unstableregionviscositydispersed fluid saturation XFigure 10.9:Emulsion behavior as a function of the percentage of dispersed fluidin the emulsion. Viscosity Increases dramatically in the deformationregion since the droplets must be deformed to pass by each other.The region above 96% is unstable <strong>and</strong> the emulsion will commonlybreak or "invert" with the outer <strong>and</strong> inner fluids changing places. Theregion boundaries are only valid for all droplets of the same size. Avariation in droplet size will increase stability.Iron SulfideSiltClayBentoniteParaffinsSaltAsphaltsResinsS<strong>and</strong>ShaleScaleMetal Flakes (from pipe dope)Cuttings Corrosion Products Iron ColloidsThe pH is a measure of the acidity of a fluid. The pH may have an effect on ionization of compound, itmay affect valence state, or it may change how a surfactant works. pH changes can alter a demulsifiersurfactant to an emulsifier or change a scale inhibitor to an inert chemical. pH is a very important factorin treater upsets following acid backflow. Most free water knockouts <strong>and</strong> treaters will operate wellat a pH of 6 to 7, depending on individual well conditions. Following an acid treatment, the pH maydrop below 4 <strong>and</strong> emulsions may be created. Emulsions created in this manner continue until the pHrises above 6 or 7. When a well must be acid treated <strong>and</strong> the crude is an emulsifier or a sludge former,the wellhead may be equipped with a chemical injection port just upstream of the choke or a chemicalinjection valve may be placed in a gas list m<strong>and</strong>rel at some point in the treatment string.DispersionsDispersions (also called suspensions) are mixtures of a fluid, solid or gas entrained in a fluid. In somecases, dispersions such as water in oil are emulsions. Other dispersions, including air in water arefoams. One of the most common solid-in-liquid dispersions is drilling mud. Generally speaking, dispersionsare only semi-stable <strong>and</strong> will separate into phases when the energy is removed. The separationtime is, like emulsions, affected by density difference, viscosity, droplet <strong>and</strong> particle size, <strong>and</strong> presenceof other stabilizing forces. When the solids are very finely divided, they tend to agglomerate or10-15
stick together to reduce excess surface free energy. The basic difference in emulsions <strong>and</strong> dispersionsis that dispersions are rapidly separated by filtering.FoamsFoams are gas-in-liquid dispersions that can become emulsions if they are stabilized. Their behavioris described by the same theory as emulsions with typical internal phase volumes of over 52% (thebubble interference region). The stability of a foam is dominated by viscosity <strong>and</strong> film strength. Polymers<strong>and</strong> some soap-like surfactants stabilize foam, while some other surfactants <strong>and</strong> alcohols breakthe foam. Foams that occur in diesel based solvents are caused by short chain carboxylic acids &phenols (acidic components). Removal of the acid materials or neutralization usually stops the foamingof the oil. Foams in gas processing are usually linked to the glycol based materials <strong>and</strong> are controlledby defoamers such as TCP (tricretial phosphate), etc. Breaking crude oil foams often requireshigh surface area components (physical break) that promote coalescence. Defoamer use on crude oilfoams are often unsuccessful in full scale equipment. Successful treatment of oil foam is usuallyachieved by flowing the foam through a fibrous filter such as hay or cellulose. Water based foams areusually the result of a soap like surfactant. Foams can be stabilized by polymers, viscosity, solids orother surfactants.FrothA froth is a special type of emulsion which may include water, oil, gas, <strong>and</strong> solids in one mixture.Froths are the result of very high energy mixing such as found in electric submersible pumps. The volumeof gas in a froth is usually near the border of the mist region (about 95% gas). The solids in thefroth act to stabilize the froth <strong>and</strong> electrical charges are common. A forced breakdown of a stable frothcollected from an ESP pumped well in the North Sea showed 95% gas, 4% water, 1% solids <strong>and</strong> atrace of oil. The froth survived two weeks shipping without much loss of volume. The froth was recoveredafter the ESP burned out from lack of fluid movement through the pump. Viscosity of froth can beso high that the material may appear to be a very low density solid.Wettability ProblemsIf a drop of a liquid is placed on the surface of another immiscible liquid, or on the surface of a solidwhich it cannot dissolve, it may spread out into a thin film or it may remain in the form of a drop or athick lens.38 If the drop of liquid spreads out, it wets the surface. If the drop of liquid does not spreadout, it doesn’t wet the surface. The surface free energy of the two phases <strong>and</strong> the interfacial tensionbetween them determines whether the liquid will spread or remain in a deformed drop. Wettability ismeasured by the contact angle that a droplet of fluid forms on a particular surface. Examples of thecontact angle are shown in Figure 10.10. If the angle of contact, 8, is less than 90°, the drop spreadsout from the initial ball shape <strong>and</strong> the surface is said to be wetted by the liquid. The smaller the angle,the higher the wettability. If the angle is more than 90°, the surface is not wetted by the liquid. Wettabilitycan be measured with a liquid surrounded by gas or a liquid surrounded by an immiscible liquid.Simple wetting means very little, it is the resultant effect of wetting on fluid flow that is important.Water3Figure 10.10: Contact angle sketch. If the drop spreads on the surface (0less than goo), the liquid is said to “wet” the surface.10-16
In the natural state, formations may be water-wet, oil-wet, or neutral, depending both on the surfaceexposed to the fluid <strong>and</strong> the natural surfactants in the fluid itself. There are some instances, such asthe Cardium reservoir in Alberta, Canada, where both oil <strong>and</strong> water wetting behavior have beenreported in different sections of the reservoir.When a surface of a pore passage is oil wet, more of the passage is occupied by the bound oil (thickermonomolecular layer) <strong>and</strong> less of the pore is open to flow than in a water wet pore. Naturally, in adesire to get as much flow capacity as possible in a formation, it is desirable to change the wettabilityto water wet (in most cases). Unfortunately, it is impossible to change most naturally oil wet surfacesfor very long. Wettability may be modified by preflushing the formation with a wetting surfactant or asolvent that establishes a new coating on the face of the formation or cleans the current coating fromthe formation. Regardless of the altered condition of a surface, however, the wettability will eventuallybe decided by the surfactants in the produced fluid. Thus, the water wet condition of a formation followingan acid job can revert to an oil wet condition after a sufficient volume of strongly oil wettingcrude is produced.The effect of wettability on relative permeability may be seen in Figure 10.1 1. In an oil-wet formation,for example, some connate water can be produced even at low water saturations, whereas in a waterwetformation, only very small amounts of water may flow even at saturations as high as 50-60%. Thisis the cause of some cases of high water production in areas with low water saturation.DDHydrates(Craig, SPE)Figure 10.11: Water <strong>and</strong> oil wet formations <strong>and</strong> how relativepermeability is affected in each case.Hydrates are mixtures of ice <strong>and</strong> other elements, principally natural gas, that may resemble a dirty icedeposit. Unlike ice, they can form at temperatures in excess of 32°F (OOC). The formation of hydratesis normally associated with a drop in temperature or a reduction in pressure which may accompanythe production of fluids. <strong>Gas</strong> hydrates are most often found in wells that produce gas <strong>and</strong> a smallamount of water. Hydrates may also form in gas cut drilling mud, particularly when the mud is circulatednear the seafloor in cold locations. Hydrate plugging of chokes <strong>and</strong> valves can be a seriousproblem. Hydrate particle abrasion of equipment is also possible.Hydrates are part of a group of substances labelled clathrates because they consist of a “host” moleculethat forms a lattice structure to entrap a “gas” molecule. The host structure is water, <strong>and</strong> the gasstructure may include one or more of a number of hydrocarbon or nonhydrocarbon gases. The mostprevalent type of hydrocarbon gas associated with hydrates are C,, C2, Cs, or C4 carbon-chain components.Other materials which may form hydrates are hydrogen sulfide, H2S, <strong>and</strong> carbon dioxide,CO2. Hydrocarbons with carbon chain links larger than C5 cannot form hydrates because of a limitationon the cage size produced by the water molecule. The amount of gas trapped in a hydrate can bequite high. One cubic foot of hydrate may contain as much as 170 st<strong>and</strong>ard cubic feet (4.8 st<strong>and</strong>ardcubic meters) of gas. When a hydrate melts or decomposes because of increasing temperature, alarge volume of gas is normally produced. If this occurs in a limited volume or sealed container, pres-10-17
sures can develop that are capable of rupturing lines. A major factor that affects the hydrate formationis the gas composition as shown in Figure 10.12. In this data, temperature <strong>and</strong> pressure regimes tothe left of the line for any particular gas can result in hydrate formation where the regime to the rightpart of the line is usually safe.Katz, mod. by Baker & Gom’ez)Figure 10.12: Hydrate formation conditions for gascontaining water.Hydrates are most common in gas wells with a small amount of water production. The quantity ofwater relative to the quantity of gas production is critical. As water cut increases, many hydrate problemswill disappear. Hydrates are prevented by adding a freezing point depressant such as alcohol orglycol below the hydrate formation point. They may also be controlled by temperature preservation inthe produced fluid or elimination of severe pressure drops.ScalesWater formed scale deposits are among the most troublesome damage problems in the oil industry.47Scale in the oil industry is usually considered a precipitate formed from mixing incompatible waters orupsetting the solution equilibrium of produced waters. A water that may be stable under reservoir conditionsmay become super saturated with an ion when the pressure is decreased (allowing CO2 outgassing)or the temperature changed. The super saturated solutions react by precipitating acompound from solution. The deposition of scale is influenced by pressure drop, temperature, dissolvedgases, flow viscosity, nucleation sites, metal type: in short, anything that upsets the solutionequilibrium.The following scales are among the most troublesome.CalciteCalcite or calcium carbonate, CaC03 (Figure 10.13) is usually formed when the pressure is reducedon waters that are rich in calcium <strong>and</strong> bicarbonate ion. The deposition can be affected by outgassingof CO2, which raises the pH <strong>and</strong> makes the high concentrations of calcium unstable.Although most carbonate scale will precipitate on a surface, high energy environments such as flowingwater or gas evolution in water may lead to free formed granules of scale in pellet form,Figure 10.1 4. These pellets of carbonate usually form around a nuclei of matter <strong>and</strong> grow through10-18
(Courtesy Arnoco UK)Figure 10.13: Layered calcium carbonate scale removed from asub surface safety valve in a North Sea field.addition of layers on the outer surface. Such occurrences are usually size limited by the lifting energyin the system; when the pellet becomes too heavy to be refluxed in the flowing fluids, it sinks to thebottom.Figure 10.14: Pellets of calcium carbonate scale from a highenergy, refluxing environment (flowing oil well inEast Texas Field). The pellets formed by carbonatelayering around a particle of silt.All carbonate minerals dissolve in HCI acid, releasing carbon dioxide gas as a product. The acid reactionswith some of the noncalcium carbonate scales (e.g., strontionite, SrC03, <strong>and</strong> witherite, BaC03<strong>and</strong> the iron carbonate scales) are usually much slower than the HCI/CaC03 reaction.Calcium SulfateGypsum or “Gyp” may be the most frequently found sulfate scale in the oil industry.47 With a chemicalstructure of CaS042H20, it shares a similar composition to a hemi-hydrate, CaS041 /2H20 commonlycalled Plaster of Paris or by its mineral name, Bassonite. It is also similar in formula to the evaporitemineral anhydrite, CaS04. Calcium sulfate is often mistaken for calcium carbonate scale <strong>and</strong> an acidtest may be usually required to establish identity if a crystalline pattern is not apparent. Calcium sulfatedoes have a characteristic crystalline form, monoclinic prismatic, Figure 10.1 5. It may be of variouscolors depending on impurities <strong>and</strong> may occur as soft crystals or hard, layered deposits. Veryslow deposition may produce large crystals as shown in the example in Figure 10.1 6, while chemical10-19
upsets caused by mixing of formation water with incompatible workover fluids can cause very rapidprecipitation of a mass without significant crystal structure, Figure 10.17.(Cowan & Weintritt)Figure 10.15: A gypsum crystal from S. Dakota. Note thelinear growth surfaces.Figure 10.16: Slowly grown calcium sulfate crystals from ahorizontal surface line in West Texas. Thecrystals formed over a ten year period.Figure 10.17: Rapidly formed calcium sulfate from a chemical upset ofsuper saturated water may form a precipitate without recognlzabiecrystal structure. This piece was removed from atubing coupling joint following an acid job that contacted asulfate saturated solution (a scale removal chemical).Although downhole mixing of commingled water production (from formations or casing leaks) are oftencited as a reason for gyp formation, mixing of connate water with incompatible injection water can alsobe a factor. One of the most common sources of sulfate ions is sea water used for injection or asmakeup water for stimulations or workovers. The cause of slowly developed, layered gyp scale depos-10-20
its in tubulars <strong>and</strong> downhole equipment can be from intermittent application of sea water in formationwater that are calcium ion-rich.Gyp has almost no solubility in water <strong>and</strong> only very minor solubility in acids. Chemicals such as causticsmay convert the gyp to an acid-soluble form while tetra sodium EDTA (ethylene glycol monobutylether) will dissolve it. Water-blasting tools may also be used in gyp removal, especially in thicklyencrusteddeposits in the tubing.Barium SulfateBarium sulfate, BaS04, Figure 10.1 8, is a less common form of sulfate deposit, but causes extensiveproblems almost any combination of barium <strong>and</strong> sulfate ions causes precipitation. It also has no significantreaction to normal solvents unless it is finely ground or the structure is interrupted with impurities.Like calcium sulfate, barium sulfate is usually thought to be a product of mixing incompatiblewaters, with precipitation accelerated by pressure drop, outgassing or turbulence.Figure 10.18: Unlike the long, regular sulfate crystals,the barium sulfate deposit shown above(from the North Sea) is a dense, layeredmass.Some barium sulfate are radioactive; these are NORM (naturally occurring radioactive material)scales. The radioactivity results from a concentration of uranium in the lattice of the scale. Buildup ofradioactive scale can be monitored by use of a gamma ray logging tool. Barium sulfate removal methodsare usually mechanical. Most chemical removers have only slight reactions, especially in thickdeposits.Care must be exercised when analyzing well debris to avoid mislabeling barite, BaS04, from drillingmud residue as barium sulfate scale.Strontium SulfateStrontium sulfate, SrS04, is a common substitute in the barium sulfate crystal lattice. Strontium scalecan be associated with radioactive scale (NORM scale). It may be more soluble than barium sulfate inchemical remover systems.10-21
Other ScalesSilica, iron, <strong>and</strong> other deposits may also create problems in producing or injection wells. These depositsare less common than the previously mentioned scales but can cause serious problems. The silicascales are more frequently found in the steam injection processes. These scales are usually depositedat points of reduced pressures or temperatures where the loss of pressure leads to a cooler fluidthat may be supersaturated with silica. The chemistry of iron scaling compounds is more complex thanmost of the other scales since two forms of iron, ferrous <strong>and</strong> ferric exist in the formation <strong>and</strong>, in solution,the ferrous form may be oxidized to ferric iron by contact with sufficient oxygen. Most formationwaters contain less than 100 ppm iron but this concentration may be raised substantially by corrosionor contact of magnetite, Fe304, or hematite, Fe203, forms depending on depositional environment.Common iron scales include iron oxides, iron sulfides <strong>and</strong> iron carbonates. These scales are slowlysoluble in HCI.Particulate DamageMost damage following drilling, completion workovers, or stimulation are associated with one or bothof two mechanisms: (1) fines blocking of pore throatshatural fractures or (2) clay/mineral swelling ordispersement (migrating fines production). Fines blocking of pores is the major culprit in most cases.The fines come from a variety of sources, most caused by poor h<strong>and</strong>ling, transport <strong>and</strong> storage.Drilling MudDrilling muds are liquid with a large percentage of polymers, clays <strong>and</strong> other solids to add viscosity<strong>and</strong> weight. After mud flows through the bit, it carries cuttings up the annulus. The solids in the mudform the mud cake on the wall of a permeable formation. Mud cake damage is very shallow, except infractured formations. Mud filtrate damage may be shallow or deep depending on the permeability ofthe formation, the efficiency of the mud in forming a tight filter cake <strong>and</strong> the reactivity of the filtrate withminerals or clays in the pores of the formation.CementsCements also have a large concentration of solid particles. The particles are stopped, like those inmud, at the wall face, but the cement filtrate can cause clay or mineral damage in the formation due toits high pH (e.g., pH = approximately 10-12). The best control is to use fluid loss additives.Kill FluidsWell control may have suspended solids. These solids block the permeability much the same as thesolids in cement or mud. Clay reactions may also be possible.Dirty WaterDirty water is one of the worst sources of plugging damage. The care taken to formulate a fluid thatdoes not damage the clays or minerals is wasted if the finished brine contains suspended solids. Filteringis required for most applications. The volume of solids required to severely reduce productivity<strong>and</strong> permeability in an unfractured well is very small. Debris masses on the order of a few pounds arefully capable of limiting injection into a formation with permeability of several hundred md. Moredetailed information is available in the chapter on filtration.Bacteria ProblemsThere are five common classes of micro organisms:Bacteria - one cell organisms, over 1800 species identifiedAlgae - simple plants with chlorophyllProtozoa - single celled animalsFungi-yeast - simple plants devoid of chlorophyll10-22
Viruses - intercellular parasitesAlthough many microorganisms may be present in the unsterile world of the oilfield, there are only ah<strong>and</strong>ful which produce widespread problem^.^"^^ Bacteria can be a serious problem in several operationsbecause of what they eat <strong>and</strong> their by-products. Different types of bacteria can grow in environmentsof 12°F to >250°F, pH of 1 to 11, salinities up to 30%, <strong>and</strong> pressures to 25000 psi.Certain strains of bacteria grow without oxygen. The most common method of general classification ofbacteria is whether they need oxygen to survive:Aerobic bacteria - require oxygen to surviveAnaerobic bacteria - grow best in absence of oxygen (growth is inhibited by oxygen)Facultative bacteria - can grow either way, switches metabolism to suit the environment. Theyusually grow about 5 times faster in oxygen than without it.The bacteria most troublesome to the oilfield are sulfate reducing bacteria (SRBs), slime formers, ironbacteria, <strong>and</strong> the several aerobic forms that attack polymer in fracture fluids <strong>and</strong> secondary recoveryfluids. SRBs cause the most problems from a reservoir point of view. SRBs reduce the sulfate orsulfite in the water to sulfide <strong>and</strong> produce hydrogen sulfide, H2S, as a byproduct. SRB biomass accumulationcan lead to pitting of the steel under the colony. The hydrogen sulfide increases the corrosivityof the water <strong>and</strong> creates the possibility of blistering of carbon steels <strong>and</strong> sulfide cracking. Thebyproduct of the H2S attack on steel is iron sulfide (general form is FeS). SRBs are anaerobic bacteriawith very slow growth rates where oxygen is present. SRBs occur naturally in surface waters, includingsea water. Growth of the SRBs are controlled by the nutrients <strong>and</strong> temperature. Primary nutrientsare carbon, nitrogen, phosphorus <strong>and</strong> dissolved iron.Iron bacteria produce gelatinous ferric hydroxide. They obtain the iron from dissolved iron in the water.Iron bacteria produce some corrosion, but they often cover SRB colonies <strong>and</strong> protect them fromattack. Iron bacteria are listed as aerobic bacteria, but can live in systems with only a trace of oxygen.Slime forming bacteria are facultative <strong>and</strong> produce dense mats of high density slime that covers surfaces.Their primary detriments are protection of SRBs <strong>and</strong> pore plugging.The bacteria that attack polymers may be a variety of the aerobic <strong>and</strong> a few of the anaerobic bacteria.Polymer is an excellent simple carbon food that can be consumed readily <strong>and</strong> contribute to enormousgrowth rates of bacteria. Prevention of polymer destruction is normally h<strong>and</strong>led with biocides <strong>and</strong> tankmonitoring. Control of bacteria downhole is more difficult <strong>and</strong> involves scraping or treatments withbleach or other oxidizer followed by acidizing, <strong>and</strong> then treatment with an effective biocide at a level atleast 1.2 times minimum kill level. Frequent rotation of biocide type is also necessary to prevent thedevelopment of biocide resistant strains of bacteria.Effects of Formation Damage on ProductionRate <strong>and</strong> SkinFormation permeability damage reduces the ability of the fluids to flow through the formation towardthe wellbore. Removal of this damage requires a knowledge of what the damage is as well as wherethe damage is located. The identity of this damage is required to select an acid or a solvent, <strong>and</strong> thelocation is necessary for proper placement of the treatment <strong>and</strong> picking an adequate volume of thetreatment fluid. The following example problem highlights the general techniques used for damageconsideration.Example 10.1A well is currently producing 120 bfpd (barrels fluid per day). An examination of the well file recordsshows that after the initial perforating, the well was killed with a brine that has recently shown to bedamaging to the clays in the pay zone. During the completion, 50 bbls of the brine was lost to the150 ft perforated interval. The initial undamaged averaged permeability was 500 md, <strong>and</strong> the perme-10-23
ability is homogeneous throughout the zone. The well is not fractured. The porosity is 25% <strong>and</strong> thewellbore diameter is 8-112 in. The permeability now is estimated at 50 md from rate <strong>and</strong> pressureddata.The volume of fluid lost will fill how much of the pore space?VO~ = (25 bbl) (5.61 ft3/bbl) = 28 ft3The volume of the fluid occupied (damaged) pore space surrounding the unfractured 8" wellbore isdescribed by:where:rd = radius of damaged zone, ftr, = radius of wellbore, fth = height of the pay, ftI$ = porosity of the payrearranging <strong>and</strong> solving for r,r; =28 ft3+ (4/12)2 = 0.35 ft2r2 = (3.14) (150) (0.25)rd = 0.59 ft = 7 inchesThere is often confusion between depth of damage <strong>and</strong> damage radius. A damage radius, uncorrectedfor wellbore, is the distance out from the centerline of the wellbore. The depth of damage, a betterterm for practical calculations, is the depth of damage beyond the wellbore. The two values are different.The 7 in. of damaging fluid penetration in this case is a depth of damage since the wellbore has beentaken into the equation.An assumption is made in this case that the fluid leaked off evenly into the zone. By use of the damagegraph in Figure 10.1 9 (from McLeod), an estimate can be obtained of the productivity of the damagedwell, 0, as compared to the undamaged or ideal productivity, 0,.From the permeability ratio of k&, = 50/500 = 0.1 <strong>and</strong> the calculated depth of damage of 1.6, thegraph yields a Qd/ 0, of about 0.48. The well has about 48% of the productivity of an undamagedcompletion. If the damage were removed from this well, the productivity would be:120/0.48 = 250 bfpd10-24
DEPTH OF 0IvIM;EO ZONE,INCHES(McLeod)Figure 10.19: Effect of Damage on Well ProductivityThe damage in a formation is often expressed as skin factor, S. A positive skin denotes damage <strong>and</strong> anegative skin means that the well has been stimulated <strong>and</strong> has better productivity than a natural completionwith initial reservoir permeability. The producing efficiency (mod. from McLeod) is expressedis:In r&- 0.75 7-= z-Q, In rJrW- 0.75 + S 7 + Swhere:QdQorerW= production rate with well damaged= production rate from undamaged well= well drainage radius= radius of wellboreAlthough it may seem inaccurate to use the shortened approximation 747 + S) instead of the moreprecise formula, it should be remembered that the skin value S is a fairly rough approximation itself,generated from an interpreted plot of pressure versus time.In the previous example of &= 250, the skin would be S= 3.6.10-25
When selecting the 0, damaged production rate, to use in the calculation, the best rate to use is astable rate measured at about the same time period as when the skin was measured. Two very commonmistakes are typical when productivity <strong>and</strong> skin are discussed:1 ~ Skindamage is often rate sensitive in formations with moveable fines, moveable grains, retrogradecondensate or with some deposit forming conditions that respond to flow rate <strong>and</strong> accompanyingpressure drop.2. Skin damage may change with time, either improving during cleanup or worsening during chemicalimbalances or upsets.When the volume of the pore space surrounding the wellbore can be described by a right cylinder,Figure 10.20, that has been modified to account for the porosity, the following equation is used to calculatethe skin factor for drilling <strong>and</strong> cement damage.(McLeod, JPT, Jan. 1983)Figure 10.20: A cylinder of damage surrounding a perforation.s = In fd/f,( (kdk,) - 1)where:k, = undamaged permeabilitykd = damaged permeabilityrdr,= outside radius of zone of permeability damage= radius of wellboreIn a perforated completion, the damage from small volumes of damaging fluids may extend only afraction of an inch to a few inches into the formation. This damage will surround the perforations asillustrated in the data of Figure 10.21. In this case, the damage equation can be modified to:10-26
Llnrrr Dirtonce, Incher(Saucier & L<strong>and</strong>s, JPT, SPE 6758)Figure 10.21: Results of testing of perforators with confiningpressure showed that perforations are surroundedwith damaged rock.= height of perforated interval, ft= number of perforations in entire interval= length of perf tunnel, ft= radius of damage around perf, ft= radius of perf tunnel, ft= undamaged permeability, md= perm of damaged zone around perf, mdThe problem with both of the proceeding equations is in accurately determining the radius of damage<strong>and</strong> the permeability of the damaged zones. Typical damage depths on zones may range from a fractionof an inch (face damage) to several feet in the case of filtrate/clay interactions. Face damage isusually caused by particles in the fluid that plug the entry area of port throats. Clay damage from filtratesis usually the result of using a fresh water (no KCI or NH&I salts). The level of damage may beminor to moderate (10% to 70% reduction) in the case of most filtrate damage; to severe (80% to99+% reductions) in the cases of particles or a few filtrate interactions involving formations with largeamounts of smectite clay lining in the large pores. indeed, one of the biggest problems associatedwith calculating the factors causing or affected by damage is the natural inhomogenieties of most formations.Example 10.2A pressure buildup test has provided an estimate of a skin of +15 in an oil well currently flowing at therate of 250 BPD. The perforations are adequate <strong>and</strong> undamaged. Estimate the undamaged productionfrom the well.10-27
Q, = ( Qd ( QdQ,) ) = 25010.32 = 780 bpdExample 10.3When the productivity is known from experience with the well, the skin factor can be calculated. Usingthe first problem data (Example 10.1):S = /n(7/4) (500/50-1) = 5As a check on the Qd/ Q, aDDroximation offered earlier <strong>and</strong> using the data from Example 10.1 :'d 7-=-Q, 7+5= 0.58From the rates in the example (originally from Figure 10.1):-=-I ' 120 0.48Q, 250Using Production History Curves to Assess DamageThe production history curve is one of the most common tools that can be used to assess damage.When a workover or some other occurrence changes the production of a well, the productivity <strong>and</strong>skins can be estimated from the charts.Example 10.4In the curve of Figure 10.22, calculate the productivity at 250 days <strong>and</strong> estimate the skin factor.By extrapolating the undamaged curve to 250 days, a value of about 220 bopd is obtained vs. a currentproduction of 160 bopd. The productivity is then:<strong>and</strong> skin is:10-28
O ~ 8 8 8 c-cccI-- ~ 8 R 8 8 8 (v(vcvcucv ~ 8 8 8 ~Figure 10.22: Production History of a Damaged WellProducing Time (Days)Workover C<strong>and</strong>idate SelectionQd 7- 0.73 = -QO 7+s7S = --7~2.60.73Selectina a workover c<strong>and</strong>idate based on skin damage can be a bit misleading. Remember, the bestc<strong>and</strong>ida6 is not the well with the highest skin, it is the well that can deliver the most improvement inhydrocarbon rate when (<strong>and</strong> if) the damage is removed.Example 10.5Select the best workover c<strong>and</strong>idate from two wells: well A with a skin of 100 <strong>and</strong> a damaged productionof 20 BOPD, <strong>and</strong> well B with a skin of 5 <strong>and</strong> a damaged production of 400 BOPD.Well A:0.065Q, = 20/0.065= 308 BOPDWell B:n7-=-Q, 7+5= 0.58Q, = 400/0.58 = 690 BOPD10-29
Well B is a better c<strong>and</strong>idate, even with a much lower skin. The best wells may often be the best workoverc<strong>and</strong>idates.Formation Damage - Questions1. List the most probable formation damage condition or cause for low flow for each well behaviordescription.a. An oil well on rod pump lift is pulled after the rods seize. A soft black mass (not acid soluble)is found sticking to the rods in the top 1000 ft of tubing. Below 1000 ft, the tubing <strong>and</strong> rodsare clean. The deposit quickly melts when heated but rehardens after cooling.b. A new gas well that produces a trace of water stops flowing when the drawdown isincreased. When the well dies, surface tubing pressure drops to zero. If the well is left alone,it comes back to initial flows within one hour. The cyclic behavior is repeated unless drawdownis reduced. A well test shows the well is undamaged.c. A new, rich gas reservoir that has an initial reservoir pressure just over the bubble point istested for the first time. A step rate test shows that skin damage occurs at moderate drawdown.When pressure is reduced, the well remains damaged. The reservoir is a clean s<strong>and</strong>stonewith no migrating particles.d. A new well near the edge of a gas field shows very poor productivity on the first test. Abuildup test shows normal reservoir pressure but no skin damage.e. An oil field on CO2 flood develops pump sticking problems as the first traces of CO2 breakthrough at the production wells. The cause of the sticking is a black, hard deposit. The materialis not soluble in kerosene but is quickly soluble in xylene. It does not melt when heated.f. A well is consistently producing 1500 barrels of fluid per day with a 5% water cut from a reservoirwith a dissolved gas depletion mechanism. On the next daily test, the well produces1700 barrels of fluid with a 16% water cut. The salinity of the produced water has changedfrom 5000 ppm to 75,000 ppm.<strong>References</strong>1. Krueger, R. F.: “An Overview of Formation Damage <strong>and</strong> Well Productivity in <strong>Oil</strong> Field Operations,”J. Pet. Tech. (Feb. 1986), 131-1 52.2. Porter, K.: “An Overview of Formation Damage” J. Pet. Tech. ( )3. Davies, D. K.: “Clay Technology <strong>and</strong> Well Stimulation,” Paper presented at Southwestern <strong>Petroleum</strong>Short Course, Lubbock, Texas, April 20-21, 1978.4. Wilson, M. D., Pittman, E. D.: “Authigenic Clays in S<strong>and</strong>stones: Recognition <strong>and</strong> Influence onReservoir Properties <strong>and</strong> Paleoenvironmental Analysis,” J. Sed. Pet. vol. 47, no. 1, (March1 977).5. Azari, M., Leimkuhler, J.: “Permeability Changes Due to Invasion of Sodium <strong>and</strong> PotassiumBased Completion Brines in Berea <strong>and</strong> Casper S<strong>and</strong>stones,” SPE 171 49, Formation DamageSymposium, Bakersfield, Feb. 8-9, 1988.6. Jones, F. 0.: “Influence of Chemical Composition of Water on Clay Blocking of Permeability,”JPT, April, 1964.7. Khilar, K. C., Fogler, S. H.: “Water Sensitivity of S<strong>and</strong>stones,” Soc. Pet. Eng. J., (Feb 1983),pp. 55-64.10-30
8. Mungan, N.: “Permeability Reduction Due to Salinity Changes,” J. Can. Pet. Tech. (July-Sept.1968), pp. 113-117.9. Sharma, M. M., Yortsos, Y. C., H<strong>and</strong>y, L. L.: “Release <strong>and</strong> Deposition of Clays in S<strong>and</strong>stones,”SPE 13562, Intl. Symp. on <strong>Oil</strong>field Chem., Phoenix, April 9-1 1, 1985.10. Priisolm, S., Nielson, B. L., Haslund, 0: “Fines Migration, Blocking, <strong>and</strong> Clay Swelling of PotentialGeothermal S<strong>and</strong>stone Reservoirs,” Denmark, SPE, Formation Evaluation, June 1987,p. 168.11. Svetgoff, J.: “Paraffin Problems Can be Resolved with Chemicals,” <strong>Oil</strong> <strong>and</strong> <strong>Gas</strong> J., (Feb. 27,1984) p. 79.12. Cole, R. J., Jessen, F. W.: “Paraffin Deposition,” <strong>Oil</strong> & <strong>Gas</strong> J. (Sept. 19, 1960), pp. 87-91.13. Burger, E. D., Perkins, T. K., Strieger, 4. H.: “Studies of Wax Deposition in the Trans. AlaskaPipeline,” J. Pet. Tech (June 1981), pp. 1075-1 086.14. Addison, G. E.: “Paraffin Problems <strong>and</strong> Solutions in Michigan,” SPE-SPWLA Mt. Pleasant, Michigan,March 21-22, 1984.15. Thomas, D. C.: ‘Selection of Paraffin Control Products <strong>and</strong> Applications,” SPE 17626, Intl. Mtg.on Pet. Eng., Tianjin, China, Nov. 1-4, 1988.16. Newberry, M. E.: “Crude <strong>Oil</strong> Production <strong>and</strong> Flowline Pressure Problems,” SPE 11561, 1983,151-1 64.17. Sutton, G. D., Roberts, L. D.: “Paraffin Precipitation During Fracture Stimulation,” J. Pet. Tech.(Sept. 1974) 997-1 006.18. Leontaritis, K. J.: “Asphaltene Deposition: A Comprehensive Description of Problem Manifestations<strong>and</strong> Modeling Approaches,” SPE 18892, 1989, 599-61 3.19. Leontaritis, K. J., Mansoori, G. A.: “Asphaltene Flocculation During <strong>Oil</strong> Production <strong>and</strong> Processing:A Thermodynamic Colloidal Model,” SPE 16258, 1987, pp. 149-1 58.20. Tuttle, Robert N.: “High-Pour-Point <strong>and</strong> Asphaltic Crude <strong>Oil</strong>s <strong>and</strong> Condensates,” Journal of<strong>Petroleum</strong> Technology, 1983, pp. 11 92-11 96.21. Stout, Charles A.: ‘Wax <strong>and</strong> Asphaltenes Similarities <strong>and</strong> Differences,” text of a presentation,pp. 1-17.22. Newberry, M. E., Barker, K. M.: “Formation Damage Prevention Through the Control of Paraffin<strong>and</strong> Asphaltene Deposition,” SPE 13796, 1985, pp. 53-61.23. Addison, G. E.: “Identification <strong>and</strong> Treating of Downhole Organic Deposits,” SPE 18894, 1989,pp. 627-632.24. Bunger, James W.: “Chemistry of Asphaltenes - Summary of Symposium,” Salt Lake City, 1979,pp. 1028-1 031.25. Thaver, R., Nicoll, D. C., Dick, G.: “Asphaltene Deposition in Production Facilities,” SPE 18473,pp. 137-1 46.10-31
26. Fuhr, B. J., Klein, L. L., Komishke, B. D., Reichert, C., <strong>and</strong> Ridley, R. K.: “Effects of Diluents <strong>and</strong>Carbon Dioxide on Asphaltene Flocculation in Heavy <strong>Oil</strong> Solutions,” Fourth Unitar/UNDP Conferenceon Heavy Crude <strong>and</strong> Tar S<strong>and</strong>s, (Paper No. 75) pp. 75-1 - 75-12.27. Danesh, A., Krinis, D., Henderson, G. D., Peden, J. M.: “Asphaltene Deposition in Miscible <strong>Gas</strong>Flooding of <strong>Oil</strong> Reservoirs,” Chem Eng Res Des, Volume 66 (July 1988), pp. 339-344.28. Monger, T. G., Trujillo, D. E.: “Organic Deposition During CO2 <strong>and</strong> Rich-<strong>Gas</strong> Flooding,” SPE18063, pp. 63-73.29. Kawanaka, S., Park, S. J., Mansoori, G. A.: “The Role of Asphaltene Deposition in EOR <strong>Gas</strong>Flooding: A Predictive Technique,’’ SPE/DOE 17376, pp. 61 7-627.30. Monger, T. G., Fu, J. C.: “The Nature of CO2-Induced Organic Deposition,” SPE 1671 3, 1987,pp. 147-159.31. Pittaway, K. R., Albright, J. C., Hoover, J. W.: “The Maljamar Carbon Dioxide Pilot: Review <strong>and</strong>Results,” SPE/DOE 14940, 1986, pp. 137-1 43.32. Mansoori, G. A., Jiang, T. S.: “Asphaltene Deposition <strong>and</strong> Its Role in EOR Miscible <strong>Gas</strong> Flooding,”Chicago, pp. 75-86.33. Hoover, John E., ed.: “Remington’s Pharmaceutical Sciences,” 14th Ed., 1970, Mack PublishingCo., Easton, PA.34. Sherman, P., ed.: “Emulsion Science,” Academic Press, 1968, London.35. Lissant, K. J.: “Emulsions <strong>and</strong> Emulsion Technology,” Part 1, Dekker, Inc., New York, 1974.36. Lissant, K. J., <strong>and</strong> K. G. Mayhan: “A Study of Medium <strong>and</strong> High Internal Phase Ratio Water/PolymerEmulsions,” J. Colloid. <strong>and</strong> Inter- Interface Science, pp. 201-208, Jan. 1973.37. B<strong>and</strong>bach, P. L.: The How <strong>and</strong> Why of Emulsions,” <strong>Oil</strong> <strong>and</strong> <strong>Gas</strong> Journal, Sept. 7, 1970.38. Hausler, R. H.: “Guidelines Help Avoid, Treat <strong>Oil</strong> Field Emulsions,” <strong>Oil</strong> <strong>and</strong> <strong>Gas</strong> Journal,Sept. 4, 1978.39. Bikerman, J. J.: “Foams <strong>and</strong> Emulsions - Formation Properties <strong>and</strong> Breakdowns,” Chemistry <strong>and</strong>Physics of Interfaces - Symposium on Interfaces, June 15-1 6, 1964.40. Stewart, G., <strong>and</strong> J. Cambell, <strong>and</strong> H. Wallace: “The Basics of <strong>Oil</strong> <strong>and</strong> Water Emulsion Treating,”Southwest <strong>Petroleum</strong> Short Course, 197, p. 189-1 94.41. Rice, C. L. <strong>and</strong> R. Whitehead: “The Theory of Coagulation of Emulsions”.42. Ogino, K., <strong>and</strong> M. Onishi: “Interfacial Action of Natural Surfactants in <strong>Oil</strong>mater Systems,” J. Colloid<strong>and</strong> interface Sco., vol. 83, no. 1, Sept. 1981, pp. 18-25.43. Gidley, J. L., <strong>and</strong> H. R. Hanson: “Prevention of Central Terminal Upsets Related to Stimulation<strong>and</strong> Consolidation Treatments,” SPE 4551, 48th Annual Fall Mtg., Las Vegas, Sept. 30-Oct. 3,1973.10-32
44. Coppel, C. P.: “Factors Causing Emulsion Upsets in Surface Facilities Following Acid Stimulation,”J. Pet. Tech., Sept. 1975, pp. 1060-1 066.45. Moilliet, J. L. <strong>and</strong> B. Collie: “Surface Activity,” Van Nostr<strong>and</strong> Co., New York, 1951.46. Adamson, A. W.: “Physical Chemistry of Surfaces,” lnterscience Publishers, Inc., New York,1960.47. Cowen, J. C., Weintritt, D. J.: “Water Formed Scale Deposits,” Gulf Publishing, Houston, 1976.48. : “Radioactive Barium Sulfate Scale,” SPE paper.49. Cusack, F., Brown, D. R., Costerton, J. W., Clementz, D. M.: “Field <strong>and</strong> Laboratory Studies ofMicrobiaVFines Plugging of Water Injection Wells: Mechanism, Diagnosis <strong>and</strong> Removal,” USMSPaper 01 4880.50. Clementz, D. M., Patterson, D. E., Aseltine, R. J., Young, R. E.: “Stimulation of Water InjectionWells in the Los Angeles Basin by Using Sodium Hypochlorite <strong>and</strong> Mineral Acids,” J. Pet. Tech.(Sept. 1982), 2087-2096.51. Crowe, C. W.: “New Treating Technique to Remove Bacterial Residues from Water-InjectionWells,” J. Pet. Tech. (May 1968) 475-478.52. Carlson, V., Bennett, E. O., Rowe, J. A., Jr.: “Microbial Flora in a Number of <strong>Oil</strong> Field Water-Injection System,” Soc. Pet. Eng. J. (June 1961), 71.53. Raleigh, J. T., Flock, D. L.: “A Study of Formation Plugging with Bacteria,” J. Pet. Tech. (Feb.1965), 201-206.54. Hancock, W. P., Hagen, D. A.: “Fine Tuning Increases Statfjord B output 39%,” World <strong>Oil</strong>, Jan.1986, pp. 79-84.55. Rooker, M.: “Crude <strong>Oil</strong> Separator Foaming Problems,” Southwestern <strong>Petroleum</strong> Short Course,1983.56. Lawton, L. L.: “Foaming Crudes Require Special Separation Techniques,” World <strong>Oil</strong>, November,1981, pp. 103-1 05.57. Callaghan, I. C., McKechnie, A. L., Ray, J. E., Wainwright, J. C.: “Identification of Crude <strong>Oil</strong> ComponentsResponsible for Foaming,” SPEJ, April 1985, pp. 171 -1 75.58. Christopher, C.A.: “Fundamentals of Emulsions,” Emulsion Workshop, Calgary, Alberta, June 14,1993.10-33
-Time1. The pressure Increase caused by running In the hole.2. The initial hydrostatic fluid pressure (packer set at end of measurement).3. The initial first period flow pressure (valve opened to empty drill pipe).4. Final flow measurement of first flow period (downhole valve closed at end of measurement).5. The end of measurements on initial shut-In pressure.6. Downhole valve Is opened <strong>and</strong> second flow period starts.7. End of second flow period, start of second shut-in or buildup pressure.8. End of final shut-in buildup pressure. The tool Is then pulled loose.9. The hydrostatic pressure of fluids in the annulus at the end of the test.10. The pressures measured as the tool Is pulled out of the well.The pressures measured during the first flow period indicate the type <strong>and</strong> rate of fluid flow into thewellbore. Sharp increases in pressures such as:/sharp increase indicates liquid11-2
Chapter 11: Formation <strong>and</strong> Damage DiagnosisWhen a well does not produce as expected, an analysis must be made to determine the cause. Theproduction sequence from static fluid in the reservoir to oil in the field gathering system is a system: ifone component is poorly designed or impaired, the well production suffers. The first part of diagnosticsis determining the classic questions: what, where, <strong>and</strong> how about the damage <strong>and</strong> the second partof diagnostics is determining what effect it has on production <strong>and</strong> how to remove the damage.Drill Stem Test (DST)The drill stem test or DST is described as a temporary, openhole completion in which pressures canbe measured. The minimum tool assembly consists of a packer, a downhole valve, empty drillpipe <strong>and</strong>the downhole recorder. More complex tool arrangements, some with perforating guns, are available.The DST is a highly useful tool for new completions before pipe is set or even for existing completionsto separately evaluate multiple zone wells or problem wells.A number of pieces of information are available from drill stem tests, including1 productive capacity of a formation2. type of fluids produced3. initial reservoir pressure4. depletion5. estimate of permeability6. Presence of formation damage7. presence of barriers or multiple zones8. collection of fluids.The general shape of the DST chart is a function of the pressures recorded during flow or shut-inbuildup. The events are labeled in the following curves. The graphs have been adapted from teachingmaterial provided by <strong>George</strong> Tew <strong>and</strong> are used with permission.11-1
indicate liquid flow since the hydrostatic pressure of a given volume of liquid is much greater than asimilar volume of gas. The response of gas influxis much flatter. Mixed fluid flow response will depend on relative volumes but will be dominated by liquidcontribution.The rate at which fluids flow into the wellbore when the downhole valve is opened can be estimated bythe initial <strong>and</strong> final pressure levels.11-3
In cases of severe formation damage, fluid inflow may be small, but rapidly building BHPs may indicategood permeability. Such is the case in the following response.When the reservoir being tested loses a significant amount of its total fluids during the test, the secondshut-in buildup pressure will be lower than the first.firstIn some cases, the second flowing bottom hole pressure cycle will reflect the lack of pressure support.Either case is depletion.Nodal AnalysisMany factors affect the production rate from a well: permeability, pressures, fluid characteristics, completiontype, extent of stimulation, depletion, <strong>and</strong> the lift system. The diagnostic methods in this chapterare broken down into eight categories: (1) inflow performance, (2) fluid analysis, (3) transient tests,(4) reservoir logging methods, (5) fluid movement surveys, (6) mapping, (7) completion <strong>and</strong> lift analysis,<strong>and</strong> (8) operations information. When the producing system is examined, a computer based simulatorwith nodal analysis capability is suggested. Nodal analysis means that each component (or nodein a system) is examined with respect to the effect it has on its neighboring components. For example;if the . . perforations . are too small or too few, the pressure drop of fluid flowing through the perfs will be.. . .. .. .. Ifluid inflow will be sharply curtailed by the backpressure held on the reservoir by the perforationrestriction. Any part of the system that holds an unnecessary backpressure can adversely affect thewell performance. A high surface separator pressure, a small choke setting, or tubing that is too smallholds a back pressure on the reservoir. The technology of well completion <strong>and</strong> operation is preventingthese restrictions in the initial design <strong>and</strong> removing them when they occur as the result of productionor stimulation operations. The computer based nodal analysis simulators’#* are a good first step toevaluate the near reservoir fluid flow connection, mechanical systems, <strong>and</strong> overall flow potential,Figure 11 .l. The nodal treatment are useful in spotting obvious problems, but the output from thesesimulators is, like all analysis techniques, totally dependent on input. This chapter stresses methods11-4
of determining damage or design problems, what effect the problem has on the well <strong>and</strong> how to correctit. Nothing about damage is constant; methods of identification <strong>and</strong> removal are always changing.Figure 11.1:(Brown & Lea, 1985)Possible pressure losses in a completion.Inflow PerformanceTo analyze the productivity of a well, the entire inflow, lift, <strong>and</strong> surface resistance forces must be considered.Fortunately, the various components may be broken down <strong>and</strong> examined separately. Inflowperformance is the best known data set since it is used for everything from lift calculations to stimulationjustifications. It is the ability of the well, in its present (or past) condition, to flow fluids through thereservoir <strong>and</strong> into the wellbore or the lift system. The inflow performance relationship, IPR, is a curveof well flowing pressure vs. flow rate, Figure 11 .2.3 The curves represent ideal <strong>and</strong> real measurementsfor the rate expected from a drawdown, Figure 11.3. (Reference the Chapter on Inflow Performancefor more information.) The overlays of tubing flow charts (Figure 11.4) over the IPR curve <strong>and</strong> othermethods of plotting can often spot regions of flow instabilities (Figure 11 .5), tubing size errors, lack ofperforations (Figure 11.6), <strong>and</strong> other problems. Tubing flowing pressure for a certain reservoir pressurecan also have a strong effect on stable flow, Figure 11.7. Even dual completions can be evaluatedwith the technique, Figure 11.8.Figure 11.2:(Patton & Abbott, 1982)Construction of an IPR Curve.The sizing of tubing in a gas well is dependent not only on the flow rate expected but also on the needto remove liquids 4E@ <strong>and</strong> the need to prevent erosion corrosion. Liquids may move into the well with11-5
?wwcxIoI U- (m?o)(Buhidma)Figure 11.3: Inflow performance relationship for a wellproducing below the bubble point pressure.2.001.m1.500f 1.w)1 .ooom5000(Patton & Abbott, 1981)Figure 11.4:Effect of tubing size on well flow rate.the gas or may condense in the wellbore from pressure <strong>and</strong> temperature drops. The lift capacity of thegas through any tubing is a function of the gas velocity. Turner et aLI6 presented a theoretical equationfor the minimum gas velocity, Vg, necessary to lift water <strong>and</strong> to lift condensate with a gas density of0.0031 p.For water removal:vg =5.62 (67- 0.0031 p) 1’4(0.0031 p) 1/2For condensate removal:11-6
-.mbhr*mmmDnplonktkpwNmhlmm a ~ w m a - d F ~ m l & ur at m.Lpk lay. (lor.Figure 11.5:(lone, Schrnidt, Blais, Doty, Brill, 1987)Examples of unstable flow regions for gas wells,RATE I,.b*.~ pwr ro)ul(on by indncludly AP compkllon inm -.(Brown & Lea, 1985)Figure 11.6: The effect of perforation shot density onflow in a gravel pack completion. (Nodalanalysis simulator]vg =4.02 (45 - 0.003 1 p)(0.031 p) 1'2Smith7p4 reports the relationship between rate of flow, 9, <strong>and</strong> velocity, Vg, is:4=16.73p&UgZTwhere:11-7
Q 2 4 6 8 10 12 14 16 10 20 22 24Raw &, MMdd(Banon, PEI, May 1988)Figure 11.7: Flow rate possible at several examples ofbottom hole flowing pressure <strong>and</strong> reservoirpressure. Pff is flowing tubing pressure.(Kirnrnel)Figure 11.8: Flow response example of dual completion.d = inside diameter of tubing, inUg = gas velocityZ = compressibility factorT = temperature (OF + 46), O RBy combining the equations for minimum flow <strong>and</strong> lift, a graph of minimum flow rate to remove waterfor various tubing sizes can be drawn, Figure 11.9. The danger in using a tubing size that is too smallis that the tubing may become a restriction to flow in the early years of reservoir life, Figure 11.10, <strong>and</strong>production (<strong>and</strong> income) will be delayed.The IPR curve changes with production, Figure 11.1 1 , <strong>and</strong> events such as water breakthrough. Forany diagnostic analysis to be effective, a new IPR curve should be drawn.When examining the equipment in this system, remember to look for the restrictions such as no-gonipples, latch assemblies, restricted boreplugs or packers, limited entry perforating, through tubing11-8
2w(Smith, 1989)Figure 11.9: Minimum rate of gas flow to lift water in varioussize tubing. Assume gravity = 0.615 (air 1) at100°F.01 I 1 I I I i0 ~ Q o I 0 1 1 0 ~ ~ ~ ~-.bm(Kimmel)Figure 11.10: These curves reflect that larger tubularssustain initial flow rates for longertime periods.perforating, or any perforation scheme less than 4 shots per foot of net pay (less than 8 shots per footin a higher rate well). These restrictions behave like bottomhole chokes if they impede the flow of thefluid in any manner. Any restriction may reduce the productivity <strong>and</strong> most are obvious.Equations of FlowAlthough usually considered to be tools of the reservoir engineer, the Darcy flow equations are alsovery useful in well completion for analyzing damage <strong>and</strong> predicting flow. The equations of flow throughporous media are basically variations <strong>and</strong> adaptations of the empirically derived Darcy’s Law.’ Asoriginally conceived, Darcy’s Law described the gravity fed flow of water through s<strong>and</strong> filters. Whenpumps were used to provide pressure, both gravity <strong>and</strong> pressure were considered.11-9
20001600- 1200*(DzBU2 800r( IyBm100s- Cumulative recoveras percent oforiginal oil inlac. that haa beenn- 0 40 80 120 160 200Flow rate. BOPD(Vogel, 1968)Figure 11.11: Example of a changing IPR curve withcumulative production.Q = A-( -+- dP P sina)w dw 1033(11 .I)where:QApk= rate of flow, cc/sec= cross sectional area of flow, cm2= flowing fluid viscosity, cp= permeability, Darcies- dp = pressure gradient, atm/cmdup = fluid density, gram/cm3a = angle of inclination of bed, a>O if flow direction is updipThe conditions of flow require special derivations of Darcy’s Law. The various forms will be addressedaccording to the conditions of flow.For flow in a horizontal direction, the force of gravity is not a significant factor as an element of drivingpressure <strong>and</strong> the gravity term drops from the equation. Other flow parameters such as single or multiplephase flow, compressible or incompressible fluid, linear or radial flow beds in series, <strong>and</strong> the effectof transients in flow, all affect the equations necessary for flow rate. Each factor will be considered inturn.For horizontal, steady state flow, the equation for linear flow is:11-10
(11.2)where:APh= the pressure differential, atm= length of flow path, cmFor engineering units of psi <strong>and</strong> ft, the equation iskAPQ = 1.127A-- ML(1 1.3)where:Qkp= rate in bbls/day= permeability in Darcies= viscosity in cpA =area in ft2AP = pressure differential in psiL = flow path length in ftFor radial flow:‘w(1 1.4)where:h = height of radial bed, cm<strong>and</strong>, in psi <strong>and</strong> ft, the equation is:h (ft) k (Darcy) ( P, - PWf) psiQ(bbl/day) = 3.07Pp (cps) log2rw(1 1.5)where:P, = reservoir pressure, psiPd = bottomhole flowing pressure, psire = drainage radiusr, = wellbore radius11-11
The units of re <strong>and</strong> r, must be the same.For horizontal flow of compressible fluid, assuming isothermal expansion <strong>and</strong> using Boyle’s Law, theequation for linear flow becomes:where:(1 1.6)P, = mean pressure =or, in psi <strong>and</strong> ftPe + Pwf2(1 1 -7)In radial flow,.. .‘W(1 1.8)or, in psi <strong>and</strong> ft:h (ft) k(Darcy) - P, (psi) . (P,- Pwf) (psi)Q(ft3/day) = 39.6 .‘ep (cps) - Pe (psi) - InrW(1 1.9)The problem with the radial flow equations for well completion is that pressure expansion is not perfectlyisothermal at the wellbore. Some error will occur because of the heat losses. In most wells, theIPR is established by using the radial flow equation:(11.10)11-12
where:9 = flow rate, BPDk = permeability, mdh = zone height, ftPpdprer,f3= average (static) reservoir pressure, psi= flowing pressure at the middle of the perfs, psi= viscosity of produced fluid, cp= radius of the drainage area of the well, ft= radius of the wellbore, ft= crude oil volume factorThe difference between P h flowing pressure at the middle of the perfs, <strong>and</strong> P , reservoir pressure, isthe drawdown. Normally, the greater the drawdown, the higher the production rate. This does not holdtrue for wells with rate sensitive skins, heavily damaged wells, or wells in which the drawdown reducesthe pressure below the bubblepoint.When a formation is damaged near the wellbore by mud, cement, or kill fluid filtrate or a wall “cake” isbuilt up, the effect of the damage on the permeability is predicted by the beds-in-series form of theDarcy equation.reIn-where:kavs = avg perm of zone with effect of damaged layerke = permeability of reservoirkdrerlr2= permeability of damaged layer= drainage radius of well= radius to inside of damage layer (usually wellbore wall)= outer radius of damaged layerThe productivity of the damaged zone is:(11.11)where:(11.12)11-13
QdQj= productivity of damaged zone, BPD.= undamaged productivity, BPD.The data for the calculations is generated from production rates at various drawdowns <strong>and</strong> is usuallyin the shape of a curve, although an ideal case would produce a straight line, as seen previously inFigure 11 .3.3-5 The relationship of production rate, 9, <strong>and</strong> the drawdown is the productivity index, PI, ofthe well:(11.13)The productivity index is valid for a well producing at steady state for a “moment in time” <strong>and</strong> willslowly change because of depletion, damage, change in reservoir behavior, or a stimulation. The PIfor a new well must be viewed as an approximation only since the value may be heavily influenced byflush production from natural fractures or thin zones with permeabilities an order of magnitude or morehigher than the rest of the matrix.The flow equations presented thus far deal mainly with liquid flow or gas flow at laminar conditions.When gas flow is considered, two specific problems may arise: unsteady state flow in low permeabilityreservoirs <strong>and</strong> turbulent flow regimes. In unsteady state flown7 the equation set forth by Rawlings <strong>and</strong>Schellhardt,loq = C(P,’- P&)”where:9 = volumetric rate of flow, McfdC = coefficient for a specific applicationn = exponent for a specific applicationP, = stabilized shut-in reservoir pressure, psiaPw~ = bottomhole flowing pressure, psiahad to be modified by C~llender,~~ to:q = C(f) (P:_ P;ywhere tdenoted that the coefficient Cwas actually a variable with respect to time. Variance fromDarcy flow is expressed by the n exponent (nA). What this means is that the multipoint flow test (flowfollowedby flow), was impractical for low permeability reservoirs.l19l2 When gas flow is in the turbulentregion, a separate set of calculations are needed to differentiate between damage <strong>and</strong> turbulenceeffect.The F~rchheimer’~ equation has been used to describe flow through porous media. In its modifiedform;14APIAL = +uVIk+BpV211-14
L, U <strong>and</strong> kare st<strong>and</strong>ard terms from the Darcy equation. The fip V2 term is a correction for non-Darcyflow where fi is called the inertia ~oefficient~~or the turbulence factor.16 fi is classed as a rock property<strong>and</strong> is related to the porosity <strong>and</strong> permeability in the rock17,18 or in the proppant packs of hydraulicfractures.15i19 In the core, is estimated by the relationship advanced by Geertsma:18= 1.5695 x lOV3/ (+5*5ko.5)In fractures, for a given fracture pack permeability K, p is described byB = b/(lOOQK)awhere the experimentally determined values of a <strong>and</strong> bare:S<strong>and</strong> Size8-1 210-2020-4040-60ab1.24 3.321.34 2.631.54 2.651.60 1.10With the formula, the fi values for fracture s<strong>and</strong> proppant may be 2 to 50 times higher than predictedby Geertsma18 for consolidated formations.lg<strong>Gas</strong> flow through a pore follows a generalized flow pattern described in Figure 11.1 2a. Low velocityflow moves the most fluid through a pore on a unit flowed per pressure drop. Increased flow velocityresults in pressure drops greater than proportional to the velocity increase.17(a) Low docity (b) Velocity (cl Intermediate, (dl High velocity,highu Mnsition turbuknt(Firoozabadi 8 Katz, 1979)Figure 11.12a:Schematic of idealized flow at various flow regimes.Evaluations of the fit of fi to permeability were made by Firoozabadi <strong>and</strong> Katz for several log-basedformulas <strong>and</strong> both the formulas <strong>and</strong> general scatter of the data are illustrated by Figure 11.12b.Decline CurvesThe actual production performance of a well may be used to estimate the occurrence of damage <strong>and</strong>also as one criteria to determine whether a stimulation or workover is economically warranted. Theproducing rates of all measured fluids are plotted on a decline curve, Figure 11.1 3.20-25 The mostcommon decline curve, which involves plotting periodic test or production results on a logarithmic axisversus time on a linear scale, is a multifunction curve.21 The data available from the curve includesestimates of reserves, well life, effects of stimulations <strong>and</strong> anomalous behavior (indicating damage).By extrapolating the curve, estimates of future rates can be obtained. It is this extrapolation, however,that often leads to false “problems” when the rate does not match the prediction. The constant per-11-15
COAREUTKHSS OF m mCOEfRcf- 0-EwdmSundvdEnorOfTOStd Estimat, fw 6bg$=mbgk+ b”m = -1.101: b - 23.33 t0.Wm = -1.201: b - 23.83 t O SboB = m bs (W’3 + bm = 1.695: b = 17.99 t 0.99bop-mlog(+)+bm = 0.810 b 1268 t230bOB=mbg(XO.’Q) + bm = 0.991; b - 1992 23.07bo8 = m log W) + bm - -1.414; b = 21.42 t 0.87m = -1.01: b - 212 :0.85*bge-mlogQ + bm = -5.lQ; b = 9.70 t 1.01anbar m. k ru .D la 1611.“8 aeaylp-(Firoozabadi & Katz, 1979)Figure 11.12b: B Equations <strong>and</strong> the Fit of /3 Permeability <strong>and</strong> Porosity Datacentage decline <strong>and</strong> the hyperbolic decline are the most common curve analysis. The hyperboliccurve is criticized by some for yielding an unrealistic high reserve estimate <strong>and</strong> well lifetime becausethe curve constantly flattens with time. Some authors recommending switching from the hyperboliccurve to the constant-percentage decline as the curve flattens to a predetermined decline value.2’Formulas for rate-time, cumulative volume, <strong>and</strong> time-rate for three types of curves from Long <strong>and</strong>Davis are listed in Figure 11 .14.21 Type curve matches of the decline curves such as described by Fetkovich,et al.,25 are another method of solution to predict rates.System PressuresThe next step in the diagnostic process is to examine the various components of the lift <strong>and</strong> surfacesystem up to <strong>and</strong> including the separator pressure. This part of the system is dominated by frictionpressures, flow rates, fluid mixtures, <strong>and</strong> back pressures. The individual factors are:1. ID <strong>and</strong> length of the tubing, <strong>and</strong> efficiency of lift system.2. Size of any restrictions or equipment in the tubing3. Producing rate, water cut, <strong>and</strong> fluid properties11-16
4. Wellhead or separator pressure.1000 1100 0(Fetkovich et al., 1987)Figure 11.13: Examples of production history curves.t-a InQ'0-. b-1.0 t-,,(:-1)a1 - IIn(1 -dl)(Long & Davis, JPT, July 1988)Figure 11.14: Decline curve equations for constant percent, harmonic <strong>and</strong>hyperbolic curves.Any restriction to flow may cut production rate if the flow rate is near the maximum rate for the tubing.Addition of water will usually reduce the flow rate through higher hydrostatic pressure values. Highwellhead or separator pressures also have an adverse affect on the production rate since it is a directbackpressure on the system. Separator pressures are usually arrived at after consideration of recoveryof gas liquids by use of PVT information. The flash calculations from the PVT data determine howmuch of the wet gas stream will remain liquid. Although a high separator pressure is always a temptationto retain more of the gas as liquids, it must be balanced by the knowledge of what effect it willhave on the well's production since it acts as a back pressure.11-17
After a separator pressure has been set, the wellhead pressure is backed out by adding the effects ofchoke, manifold, <strong>and</strong> flowline pressure losses to arrive at the operating wellhead pressure. The lossescan be measured <strong>and</strong> summed by26P,,= Psep+APh+APfl+APc(11.14)where:Pwh = Pressure at the wellheadPsep = Pressure of the first separatorAPn = Pressure drop through the flow linesAPc = Pressure drop through the chokeAPh = Pressure drop caused by hydrostatic loadThe only pressures that are easily variable after system installation are the choke setting <strong>and</strong> the separatorpressure. Modification of the other pressures usually requires a workover.If the tubing is set much higher in a well on artificial lift than the top of the perforations, the distancefrom the perfs to the pump will act as a back pressure because of the hydrostatic load. The “uphole”IPR may be calculated by?P,, (at tbg shoe) = P,, (at perfs) - G,( H, - H2)(11.15)where:GfHIH2= flowing gradient in the casing, psi/ft= distance from end of tubing to middle of perfs=tubing length, ftThe subtraction of the product of the flowing gradient times the distance to the tbg, shifts the true IPRcurve upward, Figure 11.15, by the amount of back pressure exerted by the flowing fluid.5Fluid AnalysisMany formations undergo a reduction in oil producing capacity when water influx starts. Water influxmay decrease oil production by one of four methods: (1) taking over part of the pore space formerlyoccupied by the hydrocarbon producing interval (coning), (2) establishing water in the pores of rock(water blocking) where overall flow is diminished, (3) forming scale deposits along the subsurfaceequipment, which may also limit the inflow of all fluids, <strong>and</strong> (4) requiring lift capacity. In the case ofconing <strong>and</strong> other forms of water channeling through an oil producing formation, the overall producedfluid rate will remain the same or increase slightly (if the oil has a high viscosity). When total fluidsdecrease, it is usually a sign of a waterblock or a problem with reservoir inflow (assuming lift equipmentremains adequate).In the special case of low pressure gas wells, the production may drop off completely <strong>and</strong> refuse toflow after shut-in. In most of these wells, water builds up <strong>and</strong> fills many of the pores that were formerlyflowing gas. Many of these wells can be flowed if the water layer is removed <strong>and</strong> time allowed for thegas to reestablish saturation through its original zone. In the case of large water losses from kill fluids11-18
Uphole IPR example.9. Wd(Patton & Abbott, PEI, 1980)Figure11.15: An example of the IPR curve shift necessarywhen the pump is moved up the hole. Thisexample shows the effect of a 700 psi backpressure resulting from the depth times theflowing fluid gradient.to low pressure gas s<strong>and</strong>s, it is usually necessary to reestablish gas saturation by gas injection. Inthese cases, the relative permeability to gas, Figure 11.1 6, must be raised by decreasing water saturation.0 Water Saturation -- 100Figure 11.16: <strong>Gas</strong>mater relative permeability curve.Note that the permeability to one fluiddrops sharply with an increase in the saturationof the other fluid.Waterblocks may also occur in lower pressure oil zones. The problem most frequently encountered inoil producing formations is a lack of mobility for low pressure, viscous oils. These oils usually cannotbe displaced easily by water, but water will enter enough of the pore space by fingering to reduce theoverall flow efficiency. This situation is usually encountered in low pressure oil wells which are shut-in11-19
with water in the wellbore <strong>and</strong> in other oil wells in which large volumes of kill water are lost to the formationdue to overbalance. The water production usually remains the same while the oil rate is cut by50% or more.Formations that undergo production losses on a periodic basis are usually examined for paraffin orother precipitating hydrocarbon problems. These problems are usually remedial in nature <strong>and</strong> requireregular clean-outs. If the problem is paraffin, the deposition location will depend on the pressure, thecloud point (paraffin crystallization temperature, Figure 11.17) of the oil <strong>and</strong> the rate of cooling as theoil is produced. Graphs of cloud point as a function of pressure <strong>and</strong> temperature can be drawn for predictionpurposes, Figure 11.1 8.27Bubble Point Pressure (psla)(Weingarten & Wuchner, SPE, 1988)Figure 11.17: An example of paraffin crystallization temperaturesfor several oils.(Straub et al., 1989)Figure 11.18: Illustration of a paraffin stability curve for a particularoilfield with a severe paraffin problem.Monitoring the components of produced fluids can often provide information that is not available fromany other source. Most reservoir fluids have a reasonably constant composition. When the oil gravityor water composition changes radically over a short period of time, it is usually a sign of fluid entryfrom another source, breakthrough of a flood, or a stimulation which has gone out of the intendedzone. This is also one of the most common verification techniques of a tubing or casing leak. The criticalelement in the comparison is a regular test program to monitor the composition of the producedfluid. Location of sampling points is often of critical importance. Downhole, pressurized samples are11-20
est when fluid is needed for analysis. Monitor wells or tracers are used to keep track of fluid movementin EOR proje~ts.~~1~~Periodic analysis of the produced water is a common method to detect arrival of flood fronts, coning,casing leaks, or crossflow from other zones. Normally, the chloride ion is monitored, but changes inother ions such as sulfate, calcium, or barium can also be used as natural tracers or signals thatanother water source is contributing to flow.Monitoring fluid composition is also very useful on the backflow of stimulation fluids. This may alsooptimize later stimulations by providing information on the amount of acid spending, emulsion production,sediment returns, <strong>and</strong> formation composition. Monitoring of solution pH on the returns after anacid treatment can predict the onset <strong>and</strong> cessation of production upset problems with backflowed fluidsat the tank battery.Residual monitoring for phosphonates <strong>and</strong> other classes of compounds is another common analysisfor checking the scale <strong>and</strong> other inhibitor concentration.Transient TestsWell tests may be categorized as to the type of test or their potential use in the life of the well. Thesetests depend on some type of pressure change or fluid production. The data from this testing coversmany important points about the formation, the fluid properties <strong>and</strong> the pressure remaining in the well.Few tests are absolute st<strong>and</strong>-alone tests. Many will often give much better information if combinedwith another test that will arrive at a similar result in a different manner.Transient tests are those that measure either rate or change in pressure from a formation againsttime. The analysis is based on the mathematical description of the flow system of the well. If informationis known about the formation height <strong>and</strong> fluids, the data that can be generated from a transienttest includes permeability, the flow capacity of the formation <strong>and</strong> the amount of damage that the formationmay have undergone during drilling, completion or natural damage during various phases ofproduction or injection.The production tests covered in the Inflow Performance section) are rate versus time tests that arenormally plotted on a semi-logarithmic decline curve.3o These tests are very useful for establishingtrends such as damage following a workover or long-term production damage from natural sources.The first test on most reservoirs is the drill stem test, or DST. This test involves running a drawdownon the well <strong>and</strong> producing fluid up the drill pipe while recording pressure with a downhole recorder.The information from this single test is often the only consideration whether a well is completed, yet ifthe pay zone is drilled with a high overbalance, the DST may indicate no flow even though the reservoiris productive. There are enough other conditions that affect the outcome that the DST shouldnever be used as a st<strong>and</strong> alone test. In the minimum case, a perforating run should be made prior tothe DST to improve chances of testing the zone beyond the near wellbore mudcake damage. Anexample of a DST chart <strong>and</strong> equations (from Halliburton literature) for calculating reservoir <strong>and</strong> com-11-21
pletion information are shown in Figure 11.1 9. The plotted data is in the form of a Horner plot. Thedata available from a formation test incl~de:~’I I I I I I I iml I 1 \ \ i :noI.” I.* ,.a ,.I ..” ..U ..Y *.?a ..Ulog (T + DT)/ DT(Halliburton)Figure 11.19: A Horner Plot1. Permeability: The formation permeability calculated by a formation test is the average effectivepermeability to the produced fluid.2. Wellbore Damage: Damage determination is made from the pressure fluctuations <strong>and</strong> is apparentonce the data is plotted.3. Reservoir Pressure: A mathematical determination of the static reservoir pressure.4. Depletion: If the reservoir is small enough to be affected by the volume produced by a DST, thereservoir is very small. On larger scale flow or buildup tests, reservoir size can be confirmed.5. Radius of Investigation: Since fluid is removed during a reservoir test, the formation will beaffected to some distance out from the wellbore. This distance can be calculated.6. Barrier Indications: If, during the radius of investigation tests, a limit or anomaly is detected, abarrier such as a fault or permeability pinchout is suspected.Producing gas wells are tested with a backpressure test with the data plotted as: log(Ps,? - P d) vs.log q. These charts are often called deliverability curves <strong>and</strong> four points are normally collected for calculationof the curve. The test is known as the “four-point backpressure test”?2g33v34 A graphic example,from Patton <strong>and</strong> Abbott,% of the rates <strong>and</strong> times of a four-point test along with a data plot isshown in Figure 11.20.Wells that require very long times to come to a stabilized flow are usually tested with a procedureknown as an isochronal test.34 This technique reduces the test time to 4-6 hours of flow <strong>and</strong> shut-intimes. The plot produced by the isochronal test is somewhat similar to the backpressure curve. Thechart, Figure 11.21, is constructed by plotting flowing bottomhole pressure after the same amount offlow time at each rate against that rate. This means that each pressure is plotted after flowing for 1-2 hours at that particular rate. The well is allowed to stabilize only at one rate. The modified isochronaluses the static pressure reached after each shut-in period to calculate Psi2 - Pwf2. The method maybe used in either gas or oil wells. From this information, parallel curves are constructed that representthe wells deliverability after a particular flow time. A line through the stabilized rate point is the stabilizedperformance.1 1-22
(Patton & Abbott, PEI, 1980)Figure 11.20: Example of a conventional back pressuretest.In a new well, if production does not match the expected rate, a pressure build-up or fall-off analysisshould be run to determine if the well has permeability damage, limited reservoir, low permeability, ordepletion. In many cases with lower than expected production, the well will have a lower permeabilitythan was originally thought. This is very common when permeabilities estimated from porosity or permeabilitiesmeasured to air on cleaned cores are used to establish production expectations.A sudden reduction in the production from an established well is usually a result of damage, lift problemor other mechanical problem. Damage may be caused, as illustrated in the chapter on formationdamage, by naturally occurring phenomenon associated with production, from induced problemscaused by stimulation fluids <strong>and</strong> from numerous mechanical problems not associated with any form oftrue formation damage. The build-up test will usually show the well permeability <strong>and</strong> whether or notthe formation is producing with zero or lower “skin.” The skin number is a reference to the ability of theformation in the near wellbore area to flow as easily as the formation away from the wellbore. Damagedformations, those with skins greater than zero, may be blocked with removable damage such asparaffin, scale, particles, clay damage or water blocks or unremovable “damage” such as insufficientor inadequate perforations. Negative skins indicate an improved near wellbore permeability: usuallythe result of fractures or acidizing.Near wellbore permeability <strong>and</strong> damage evaluation by pressure transient analysis is a well developed<strong>and</strong> documented tool that had its roots in the study of groundwater hydrology. Solutions to fluid flowproblems were first introduced by van Everdingen <strong>and</strong> H ~rst,~~ who used Laplace transforms to giveanalytical solutions. The first popular “method” treatment was introduced by H~rner.~~ In this work, a11-23
(Patton & Abbott, PEI, 1980)Figure 11.21: Example of rates <strong>and</strong> times from a 4 point test.simple graphical technique allowed the calculation of average permeability, level of skin damage, <strong>and</strong>average reservoir pressure. Type curve analysis was later introduced by Agarwal, et al.37For the purposes of formation testing, the following conditions are expected to be present.1. Radial flow2. Homogeneous Formation3. Steady-State Conditions4. Infinite Reservoir5. Single Phase FlowObviously, few, if any formations meet all the criteria. Tests on wells which do not meet the criteriamust be h<strong>and</strong>led by special methods. Almost all tests are affected by wellbore storage: that volume ofthe casing that must be filled or pressured up before reservoir data is meaningful.There are two major test types: drawdown <strong>and</strong> buildup. Although the methods <strong>and</strong> formulas differ, significantinformation can be gathered from each test.1 1-24
The generation of mathematical formulas on buildup <strong>and</strong> drawdown analysis is left to those texts specializingin transient pressure testing. The formulas presented here are only a working introduction tothe subject.The Horner equation:162.6 qBp tp+ AtP, = Pi+- kh l o g 7where:P, = bottomhole shut-in pressurePi = initial reservoir pressure9 =flow rateB = formation volume factorp = viscosity, cpk = permeability, mdh = reservoir thicknesstp = producing timewill yield a straight line, Figure 11.22, with a slope rn = -162.6 qBflkh. The x-axis intercept at 1 isPws = Pi.The skin is:The intercept at (fp + Af)/Af = 1 (this occurs where Af approaches infinity) is Psi = Pb <strong>and</strong> skin is:(11.16)For gas wells, Equation 11.22 offers a solution for skin while the slope in Equation 11.23 will yield permeability.where9 = flow rate, MSCF/DPi”- Pif =1,424 qu ZT(PD+ S)kh(11.17)quZTm- 1638- kh (11.18)In the case of Eqn. 11.22 <strong>and</strong> 11.23, log P2 is plotted vs. log t for the first plot <strong>and</strong> Pw2 is plotted vs.log for Pdvs. log ((f + Af)/Af) for buildup tests.11-25
where:C, =total compressibility$ = porosityr,,, = wellbore radius Iwith the value PI hr at At = 1 hr on the extension of the semi-log straight line.Econ~mides~~ presents a solution, including skin effect for well flowing pressure, Ph of:(1 1 .I 9)As shown with the Horner plot in Figure 11.22, a semilog graph of pwf vs. time will form a straight linein later time period.The skin effect can be obtained by rearranging Eqn. il.16 to:s = 1.151Pi- Pwf- log t- log-(1 1.20)Values of skin are 0 for no damage, increasingly positive value for more severe damage <strong>and</strong> negativefor an improved wellbore (includes fractures <strong>and</strong> higher permeability near the wellbore). Small negativevalues may be created by matrix acidizing, high density underbalance perforating or perforatingwith deep charges <strong>and</strong> small, near wellbore fractures developed during the drilling operation. Largernegative numbers are evidence of high conductivity fractures. Often, the P&frorn an extension of thestraight line to the pressure after one hour from start of flow (written PI hr) is used <strong>and</strong> Eqn. 11.3becomes:s = 1.151 - log- + 3.23(11.21)From the graph of Figure 11.22, permeability is obtained from the slope of the line <strong>and</strong> skin is calculated.In some reservoir/well configurations, problems may be encountered that make analysis difficult.These difficulties of wellbore storage effect, transition zone behavior, <strong>and</strong> semilog straight line behaviormay often be recognized from a log-log plot of pressure differential (Pi- P& vs. time as illustratedin Figure 11.23. According to accepted practice, the wellbore storage effects are identified by a 45”line <strong>and</strong> the transition period extends about 1.5 log cycles after the end of wellbore storage.The end of the transition zone identifies the start of the “reservoir” response test. The data thus identifiedas the straight line portion is transferred to a semilog plot of pressure vs. time <strong>and</strong> the beststraight line starting at the end of the transition period is drawn. The permeability is obtained from the11-26
I..0. .JSimU.IQDuikWtntccilIqlO(DST.(Holditch, Lee, Lancaster, Davis, 1983)Figure 11.22: A Horner Plot11MEFigure 11.23: Log-Log Diagnostic for Infinite Acting Reservoirslope of the straight line <strong>and</strong> the extrapolation of the straight line back to a time of one hour is used toobtain p1 hr for Calculation of the skin.Further stimulation of wells with large negative skin is usually not highly economic unless fracturing ofa low permeability, unfractured well is planned. In unfractured wells, there is a natural choke as thefluid nears the near wellbore area. This inward radial flow results in convergence of fluid <strong>and</strong> interferenceto some extent of the fluid in the region 1-3 ft radius next to the wellbore. If a conductive fracturecan be placed in the formation without affecting unwanted production in nearby zones, productivitycan often be enhanced. In a fractured well, flow is thought to be linear from the formation into mostparts of the fracture <strong>and</strong> a large amount of damage to the formation must be done before the productionrate will be significantly reduced. If the damage occurs in the fracture pack, however, a smallamount of damage will significantly reduce the flow capacity of the fracture <strong>and</strong> the production fromthe well. Positive skin in wells known to be fractured are usually caused from severe damage in theproppant pack, fracturing the wrong zone, or less frequently, from severe damage to the formationduring fracture stimulation.11-27
Reservoir Logging MethodsElectric logging is an extensive suite of evaluation techniques that can pinpoint information about theformation, the fluids within the formation <strong>and</strong> the fluids flowing in the wellbore. Logs may be separatedinto application classes. Open-hole logs are used to select pay zones <strong>and</strong> generally evaluate the type<strong>and</strong> quality of rock through which the well has penetrated. Cased hole logging is useful for informationgathering for reentry of wells, evaluation of production, depth correlation <strong>and</strong> use in secondary <strong>and</strong>tertiary recovery. Identification of the intervals that may contain hydrocarbons is dependent uponproper evaluation of the formation <strong>and</strong> the formation fluids. Only the basics of log interpretation will bementioned here, for more detailed reading <strong>and</strong> underst<strong>and</strong>ing of tool operation, refer to D e~an.~~A few concepts about electric line logging are in order to underst<strong>and</strong> the different logs that are available.39R, the resistivity of the formation water, is a property that affects the calculations made fromdata provided by resistivity tools. These calculations affect the estimations of water <strong>and</strong> hydrocarbonsaturations <strong>and</strong> reserves. R, is normally estimated from log <strong>and</strong> downhole sample measurementsduring the drilling <strong>and</strong> completion of the well. Its accuracy is very dependent on the sampling <strong>and</strong>measuring method. The accuracy of the R, measurement is so important in calculations that requirean absolute value of RW that entire projects can be made to seem either economic or uneconomic bythe mere shift of the R, by a few percentage points. In actual practice, knowing the value of R, is lessimportant since the formation factors, 6 for each of the zones of flushed, invaded, <strong>and</strong> undisturbedare equal <strong>and</strong> the saturations may be determined by equating the Fterms.Three basic logs are required for adequate formation evaluation. One is needed to show permeablezones, one to give resistivity of the undisturbed formation (for saturation calculations), <strong>and</strong> one torecord porosity. An example of the three tracks is shown in Figure 11.24. The log showing presence ofpermeability is usually the SP (spontaneous potential) log. The resistivity logs may be deep inductionor deep lateralog, <strong>and</strong> the porosity log may be density, neutron or sonic. Where such logs are available,interpretation concerns selecting permeable zones of a porosity acceptable to hold reserves inan area of high resistivity, indicating hydrocarbon content. Many other logs are available to help definethe myriad of special cases that formations present.As with most logs, it is advisable to use the reading from several logs <strong>and</strong> compare the data. The identificationof nonshale formations as target formations is the first step; but the second step is determiningfrom porosity logs if there is pore space available for containing <strong>and</strong> flowing fluids. The thirdrequirement then uses the resistivity logs to determine if the pore space contains water or hydrocarbon.Gamma Ray LoggingGamma ray logs use the natural radioactivity in the formation to distinguish reservoir rocks fromshales. Gamma ray logging measures the natural gamma radiation emitted by the formations. Typically,this radioactive signature remains relatively constant during the entire life of the well <strong>and</strong> is aconvenient tool for depth correlations <strong>and</strong> for determining formation types, as well as identifying individualformations in offset wells. In general, the higher the radiation signature from the rock, the lesslikely that the rock is a potential reservoir rock <strong>and</strong> the more likely that it is a shale. There are significantexceptions to this general rule, however. Many formations that contain either radioactive isotopesor volcanic debris have a high natural radioactive signature <strong>and</strong> may be reservoir.Acoustic or Sonic LoggingSonic or acoustic logs measure formation porosity. Acoustic devices measure reception <strong>and</strong> characteristicsof a sound wave emitted from a transmitter in the tool <strong>and</strong> received from the formation. Thesonic wave reaches one or more receivers in the tool after being transmitted. The travel time <strong>and</strong> theamplitude of the sound wave are the primary measurements of the tool. The velocity, which is commonlyreported on the log, is the inverse of the travel time.1 1-28
0.L./Ioesistivity Porosity0h-m x ~199002a100041010~Figure 11.24: Example of a log track sketch. Shown areSP (a permeability presence indicator),fluid resistivity (in inspected zone), <strong>and</strong>porosity.Sonic tools may be of more than one type. Some sonic tools bounce the wave off the rock face. Theamplitude <strong>and</strong> travel time of the wave is recorded <strong>and</strong> measured by a spinning transducer that is boththe transmitter <strong>and</strong> receiver in the tool. This can create an image of the borehole on logging film. Thistype of tool, often referred to as a sonic caliper or a televiewer, is useful for mapping physical surfacechanges in the wellbore. The second type of tool, <strong>and</strong> by far the most common, is the porosity measuringtool. In any solid object, there is a linear relationship between the effective porosity <strong>and</strong> thetravel time. In relatively clean (clay free) reservoir rock, the effective porosity is the intergranularporosity <strong>and</strong> excludes both fractures <strong>and</strong> large vugular porosity. Several factors can lessen the effectof porosity measurement with a sonic tool. Higher pressures, even with gas, can make the sonic toolread lower than normal porosities. For this reason, several sonic tools are generally run <strong>and</strong> compared.The response from other logs is also taken to determine which porosity log will have the greatestaccuracy.Neutron LoggingNeutron logs are another method of measuring traditional formation porosity. One popular style of thetool is a compensated neutron log which uses a neutron source <strong>and</strong> two or more neutron detectors.The source emits neutrons into the formation. The count rate of neutrons coming back to the tool isgenerally an inverse function of porosity. The tool response may be also affected by borehole conditions.To minimize this effect, the ratio of the two detectors is often taken. In this manner, the porosityvalue is much less affected by borehole conditions.Density LoggingThe density log is the third type of formation porosity measurement. Density tools utilize a gamma raysource placed a distance from the gamma ray detector. The gamma ray count rate or reception in thedetector is inversely proportional to the rock density. If the matrix density is constant, the rock density11-29
is an inverse function of porosity. This means that as porosity increases, the gamma ray increases. Itis easier for gamma rays to find their way from the source through the rock to the detector when theporosity is high <strong>and</strong> the obstructing density of the formation is lower.The gamma ray density log is different from the gamma ray tool mentioned in the first paragraph ofthis section. The gamma ray tool has no gamma ray source, only a detector that measures natural formationgamma ray radiation.Another tool of a similar nature is the natural gamma ray spectroscopy tool that breaks down the naturalgamma radiation into it’s primary radioactive components; namely, potassium, uranium, <strong>and</strong> thorium.The density log is the only gamma ray tool that utilizes both a gamma ray source <strong>and</strong> a gamma raydetector.Natural Gamma Ray Spectroscopy LogThe primary use of natural gamma ray spectroscopy logs is to measure the natural radioactive sourceelements of potassium, uranium, <strong>and</strong> thorium. This allows a direct observation of clay type, <strong>and</strong> insome cases, the occurrence of fractures. The tool uses sensitive detectors that measure variousenergy levels <strong>and</strong> the output requires mathematical modeling for processing.Induced Gamma Ray Spectroscopy LogThe induced gamma ray spectroscopy log measures the elemental makeup of rock. It is probably oneof the most complex tools in the logging suite. It utilizes a pulsed neutron source that bombards theformation with neutrons. The source is turned on <strong>and</strong> then turned off in a cycle that allows time formeasurement of gamma ray radiation returning from the rock. Information available from this type oftool includes identity of rock matrix type, porosity, <strong>and</strong> the presence of oil without the knowledge of thewater salinity value that is required for resistivity logging.Open-Hole LoggingThe open-hole logging process deals mainly with detecting difference disturbances in the formationcaused by drilling fluids. It is the invasion of drilling fluids into the formation that marks the formationas permeable on the SP log. The process of invasion, as was explained in the chapter on drilling thepay, is dependent upon the compressibility <strong>and</strong> viscosity of the fluid in the pores, the pressure differentialinto the formation, the permeability of the formation, <strong>and</strong> the efficiency of the mud filter cake.When the differential pressure is toward the formation, as it must be to maintain well control, the mudpresses against the permeable formation, forcing the liquid from the mud into the pores of the rock<strong>and</strong> str<strong>and</strong>ing the solid particles on the surface of the wellbore. This dehydration process forms themud filter cake. The liquid that enters the formation is the mud filtrate. The area of the formation adjacentto the wellbore into which the mud filtrate invades is known as the invaded zone. Invasioninvolves a rapid spurt of liquid when the formation is unprotected with a filter cake <strong>and</strong> dynamic filtrationwhile the filter cake is building. Fluid loss slows significantly after a thickness of filter cake hasbeen accumulated that is sufficient to radically reduce the amount of fluid loss into the formation.Every movement of the drillstring in <strong>and</strong> out of the well scrapes some part of the mud cake from thewellbore wall <strong>and</strong> forces the mud in the hole to reestablish the mud cake. At the same time that themud cake is being reformed, additional fluid is being lost to the formation.Proceeding outward from the wall of the borehole toward the reservoir, there are three distinct zonesof the formation. In the first few inches, there is a flushed zone in which all but the irreducible hydrocarbon<strong>and</strong> connate water have been flushed from the rock by the incoming mud filtrate. A transitionzone occurs next in which the initial fluid saturation has been mixed with the mud filtrate. The finalzone is the undisturbed formation. The assumption is often made that in the flushed zone, the formationwater has been entirely replaced by mud filtrate. Although this is not completely true, there maybe enough salt transfer between the waters to change the salinity of the remaining water to that very11-30
similar to the water-based drilling mud. This shallow invasion is the area on which shallow readingresistivity tools focus.In extremely porous <strong>and</strong> permeable s<strong>and</strong>s, the invading fluid may gravity segregate vertically as wellas progressing laterally through the rock. Low salinity filtrate (lighter weight) invading a high salinitywater s<strong>and</strong> will tend to rise toward the top of the bed. Water invading an oil s<strong>and</strong> will tend to drop tothe bottom. Successive logs that show a difference in the resistivity character of the formation fromtop to bottom may be profiling this particular occurrence.Formations such as shale <strong>and</strong> evaporite may show no mud cake at all since they have nearly zeropermeability. Shales may often spall, swell, or sluff into the wellbore, resulting in enlarged or rugoseholes. Evaporites are typically very straight-walled, unyielding formations. This character is reflectedin the caliper log track of Figure 11.25. Calipers are 3 or 4 arm tools that measure hole diameter.Some tools may also be set to give a reading of hole roundness.The presence of natural or completion induced fractures is an important item for design of stimulations,porosity estimates, <strong>and</strong> recovery <strong>and</strong> fluid loss concerns. A suite of logs based on the sonic logare used for fracture identification. Most of these tools monitor an interruption or delay in the sonictravel time in a section of the formation next to the wellbore to estimate presence <strong>and</strong> location of fractu r e ~ The . ~ reflected ~ ~ <strong>and</strong> reconstructed sonic signal from the borehole televiewer is also used forsurface fracture dete~tion.~~A good estimate of the total quantity of oil or gas in place may be obtained from logs provided adequateevaluations are made of the reservoir resistivity. The product of porosity <strong>and</strong> hydrocarbon saturation$(l - S,) is the fraction of the formation by volume that contains hydrocarbon. Both unknownscan be log derived. The thickness of the producing formation (h) can be determined by logs. However,the areal extent cannot. By matching h through several wells across a field, a relatively accurate pictureof the areal extent of a formation can be tabulated. This type of information, together with porosity<strong>and</strong> permeability relationships <strong>and</strong> the S, in all the wells, can be used to establish pay continuity.The first step in interpretation of logs is to locate the permeable zones. This is done by scanning theSP (or the gamma ray) log. The baseline is on the right <strong>and</strong> occasional swings to the left are the permeableareas. Baseline tracking of the log usually indicates shales, evaporites, or extremely low permeabilityformations. A swing to the left indicates that some invasion of mud filtrate has occurred <strong>and</strong>permeability is evident.Secondly, resistivity logs scan to determine which zones have high resistivity readings. A high resistivitymay indicate hydrocarbons, low porosity, or very fresh water. Once the resistivity <strong>and</strong> SP logs haveidentified potential zones, the porosity log is used to evaluate which sections may be hydrocarbon productive<strong>and</strong> which simply have no porosity.11-31
Although some oil does have a very slight conductance, oils as a group are essentially nonconductivewhen compared to water; thus, conductivity of a formation is proportional to: the conductivity of thewater in the pores, the amount of water in the pores, <strong>and</strong> the amount of porosity. In the simplest ofmodels, the oil resistivity <strong>and</strong> the resistivity of the solid rock matrix are assumed to be infinite.The equation between resistivity <strong>and</strong> the formation is:R, = F* Rw(1 1.22)where R, is the formation water resistivity, Fis the formation factor <strong>and</strong> R, is the measured resistivityof the formation. Although the resistivities in the flushed, invaded <strong>and</strong> undisturbed zones are different,the values for Fwill be the same. Since the formation has to be porous <strong>and</strong> have a water saturation tobe conductive,(1 1.23)where cp is the porosity <strong>and</strong> rn is a cementation exponent with a value of 2 to 2.1 5. rn reflects the tortuosityof the flow channels. If cp = 1 (no rock, all fluid) R, = R, When cp = 0 (solid rock) resistivity is nearinfinity.There are several resistivities important to log evaluation:If:R, = resistivity of rock + waterR, = resistivity of waterRt = resistivity of rock + water + oilThen:R, = RdSE , where n is the saturation exponent; about 2.(1 1.24)(1 1.25)Equation 11.26 can be used to calculate the water saturation of a hydrocarbon bearing zone when awater zone of the same salinity water is adjacent. Unfortunately, few pays are this easy to judge.Ar~hie~~ substituted Eqns. 11.22, 11.23 <strong>and</strong> 11.25 to give(1 1.26)where c = 1 .O for carbonates <strong>and</strong> 0.90 for s<strong>and</strong>s. This is the fundamental equation for the entire loggingindustry.1 1-32
In zones 1 <strong>and</strong> 2 of Figure 11.24, the water content <strong>and</strong> porosity are similar enough to use Eqn. 11.26,thusS, = Jm = 0.34 = 34%?he pore space is 34% occupied by water <strong>and</strong> 66% by some type of hydrocarbon, very likely an economicallyproductive interval.In zone 4, Eqn. 11.26 cannot be used because of the lack of an acceptable R, measurement. Zone 3,a water s<strong>and</strong>, offers an opportunity to get an acceptable R, (the assumption that water salinitychanges slowly with depth is not completely valid but should be usable unless proven wrong in anarea). From Archie’s equation, for zone 3:1-0.9JRJS0.32R, = 0.038 ohm-mZone 4 is a tight, predominately wet s<strong>and</strong>.The log tracks in Figure 11.24 shows that only zone 1 contains commercial hydrocarbons. The logs donot indicate whether the hydrocarbon is oil or gas. Further log analysis, perhaps with a pair of porositylogs may be beneficial to tell the difference between gas filled <strong>and</strong> oil filled pores.There are several methods for measuring porosity <strong>and</strong> each is affected by one or more of the formationor fluid component^.^^ It is this difference in the porosity log behavior that is useful in spotting gasor high GOR filled porosity. For example, the density log, which actually measures the solid part of therock rather than porosity, is almost unaffected by gas filled porosity, the CNL (compensated neutronlog) will show a very low value for gas filled porosity, the sonic log indicates a reading in-between the9 den. <strong>and</strong> + CNL. The EPT (electromagnetic propagation tool) is almost totally unaffected by fill materialin the pores. These responses are in a clean formation: presence of shale can shift the trackresponses radically either way. Idealized schematics of porosity measuring tool tracks are shown inFigure 11.26a. The EPT tool is shown in Figure 11.26b.Formation resistivity, Rt, is assumed to be that of the undisturbed reservoir beyond any invasion ofmud filtrate. Selecting Rt, however, is often very difficult, because of the wide range of flush zone <strong>and</strong>transition zones available in formations where permeability is not constant. No tool has been developedthat can read deeply enough to get Rt under all circumstances <strong>and</strong> still maintain good verticalresolution between the beds. In other words, the tools with a long spacing between emitter <strong>and</strong> detectorwill read deep but have problems distinguishing between thin beds. To fully evaluate formationswith these types of unknowns, three different resistivity curves are often run at the same time. One isa deep investigation tool, one is a medium depth tool, <strong>and</strong> the other is a shallow looking tool. With thethree curves <strong>and</strong> the known values of S, the reading of the deepest log can be corrected for invasioneffects to provide an accurate r,value. The flush zone resistivity <strong>and</strong> the diameter of invasion may also11-33
Responsehen Pores %EH 0 CNL OSL Q, EPTFilled0 30 0 30 0 30 0-<strong>Gas</strong><strong>Gas</strong> 6 011K<strong>Oil</strong>WaterFigure 11.26a: Response of various porosity measuring tools to poresfilled with gas, oil <strong>and</strong> water for a low clay s<strong>and</strong>stonewith @ = 20%.MudcakelnvadedmW(<strong>Oil</strong>field Review, July 1989)Figure 11.26b: Schematic of a Schlumberger EPT Tool. The EPT determines water filledporosity from measurements of the formation’s dielectric constant <strong>and</strong> conductivity.The measurements are made on returning electromagnetic wave.The tool measures attenuation <strong>and</strong> phase shift of the wave (below).be estimated. The invasion estimate is extremely useful information for designing stimulations <strong>and</strong>damage removal treatments.There is an enormous amount of difference in the contrast between fresh water muds <strong>and</strong> salt watermuds. The value of R,f(resistivity of the mud filtrate), along with the temperature of the formation, aremeasured in the hole <strong>and</strong> included in the log heading. These are the values on which many of the cal-11-34
culations from the logs are made. Most fresh water muds have Rmf values of approximately 0.4 to2 ohm-meter at surface temperatures. As the temperature <strong>and</strong> pressure conditions on the mudchange, R,f may also change. In very shallow zones where formation waters are usually fresh, R,fmay be close to R, However, in deeper zones where the formation water salinity is usually muchhigher, the values will differ widely. It is the difference in salinity that makes the transition <strong>and</strong> flushedzones easy to spot. Drilling affects the salinity of muds, especially when salt beds are penetrated. Inthese situations, saturated salt muds must be used during drilling to prevent continual dissolving <strong>and</strong>caving of these beds. R,fvalues of high salinity muds will be on the order of 0.1 ohm-meter or less atsurface temperature.Depth of InvasionThe terms necessary to describe the depth of invasion, Figure 11.27, are:flushed zoneWellbore wall includingmudcakeInvaded Zone(zone of investigation),djII,IUndlsturbed FormationRt, Rr. Sw, IIRmf fluidsIIII,IIIIId,,Figure 11.27: Elements of the invaded zone.R,f = resistivity of the mud filtrateR, = resistivity of the flushed zoneS,, = water saturation of the flushed zoneRt = resistivity of undisturbed formationR, = resistivity of connate waterS, = water saturation of undisturbed formationc$ = depth of invasion to outside of transition zoneUsing the three resistivity curves, a log track similar to Figure 11.28, can be drawn. The logs shown inthe figure are the Lateralog 8, LL8, (a conductance measurement), a medium depth induction tool <strong>and</strong>a deep induction tool. The LL8 has a depth of investigation of about 1 ft, the medium depth inductiontool, ILm, has a depth of investigation of about 2 ft, <strong>and</strong> the deep induction, ILd, has a depth of investigationof about 5 ft. In the tracks of Figure 11.28, the separation of the log tracks indicates that theresistivity of the fluid 2 to 5 ft into the formation is much less than the resistivity near the wellbore. TheSP track confirms that the zone is permeable. In the permeable zone, LL8 is reading close to R,, <strong>and</strong>ILd reads close to Rt. Because of changing conditions of saturation, neither value is exact.The deductions3’ made from the three tracks are: (1) the zone is water bearing, (2) the drilling mud isfresher than the formation brine, (3) invasion of the mud filtrate into the zone is moderate to shallowsince the ILm reading is very close to the ILd. Also available from the log is that the formations above1 1-35
Figure 11.28: Three resistivity tracks showingeffect of depth of tool investigation.<strong>and</strong> below the zone have no permeability since no fluid invasion occurred <strong>and</strong> the SP did not indicatepermeability. In wells drilled with a salt water mud that is less resistive than the formation water, theposition of the three curves would be reversed. For a more complete treatment on logs, the reader isreferred to D e~an.~~Other LogsThere are several other logs that are useful in analysis from a well completion point of view. A briefdescription of the more common logs are given in the following paragraphs.The gamma-ray log is a recording of the natural radioactivity of the formation. The log measures thegamma-rays emitted from trace amounts of uranium, thorium, <strong>and</strong> potassium present in the rock. Thegamma-ray log is a "finger print" of the formation <strong>and</strong> is used to correlate depths of formationsbetween wells <strong>and</strong> as a locator for perforating depth control. Gamma-ray logs never exactly repeat thesame tracks over an interval due to variances in measurements by the tool, logging speed, <strong>and</strong> variancesin gamma-ray emissions, but the tracks are almost always close enough to correlate depth.Depth of investigation is 6 to 12 inches <strong>and</strong> the log will operate in a cased hole. A gamma-ray trace forseveral formations are shown in Figure 11.29 (from De~an~~).As seen from this data, the gamma-rayresponse is characteristic of the natural radioactivity of a formation, but cannot normally be used topositively identify most formations unless other data is available or further analysis is made on thegamma ray emissions.The spontaneous potential or SP log is a recording of a fixed electrode at the surface <strong>and</strong> a moveableelectrode in the borehole. The fluid in the well should be a conductive mud. The log is used to detectpermeable zones.Resistivity logs are used to measure the resistance of fluid filled formations <strong>and</strong> by the differencebetween the resistance of the mud filtrate <strong>and</strong> the formation fluid, show invasion, permeability, <strong>and</strong>presence of water.1 1-36
0 50 100APIUnitsIIL IShaly s<strong>and</strong>Clean limestone11 Dolomite4(Dewan)Figure 11.29: Gamma Ray response on various formations.Lateralogs are focused resistivity logs. Advantages are the ability to operate in very salty muds,improved bed definition, <strong>and</strong> less interference from adjacent beds.Porosity logs may be one of four (or more) types: Density, Neutron, EPT (electromagnetic propagationtool) <strong>and</strong> Sonic. The tools all measure porosity but respond in different manners to the type of rock<strong>and</strong> the composition of fluid in the pores of the rock to get the porosity value; a useful series of tools tohelp identify fluid type.Three <strong>and</strong> four arm caliper logs measure the diameter of the open-hole <strong>and</strong> the multiarm (60 + feelers)caliper tools can measure the shape of the casing. The multiarm units are most useful to monitorhigh load areas for signs of collapse or buckling <strong>and</strong> have also been used to monitor casing corrosion.The st<strong>and</strong>ard three arm units are usually averaging (or minimum reading) rather than independentarm reading, thus some error may be induced in the size of the hole. Sonic calipers are also availablethat can operate in large holes or detect surface fractures.Many other logs are available <strong>and</strong> most have a use in well completion. Only the dominant logs havebeen mentioned; for more information, see the referenced books <strong>and</strong> articles.Cased Hole LoggingGeneration of well information via cased hole logs has long been a st<strong>and</strong>by of data collection <strong>and</strong> wellcompletion operations. Cased hole logs are used to evaluate flow within the casing <strong>and</strong> to gatherinformation on formation, annulus between the casing <strong>and</strong> the formation, the casing itself, <strong>and</strong> themovement of fluids within the casing. Cased hole logs have always been plagued by a high degree ofuncertainty caused by the character of the borehole <strong>and</strong> formation environment. Sm01len~~ has proposedseparation of the available logs into four regions of investigation. These regions, inFigure 11.30a, involve: Region 1 is the in-casing region made up of flowing or static fluids that may besingle or multiphase <strong>and</strong> may be moving up, down or in both directions on opposite sides of the pipe;Region 2 is the casing itself; Region 3 is the annular section between the casing <strong>and</strong> the formation;Region 4 is the formation. Smollen further separates logging tools into their application for these fourareas. There is a certain amount of information crossover from other sources since most logging techniquesrespond not only to information coming from their primary region of investigation but to data11-37
from adjacent regions as well. The listing of the logging techniques separates into primary <strong>and</strong> secondaryinvestigations with the regions mentioned in the previous paragraph as shown inFigure 11.30b. The primary region of investigation is designated by a “1” while the coincidental or secondaryregions are designated with a ii2.49 The logging techniques listed here may have differentuses as the regions change. The cement bond log, for example, is useful to determine the amount ofannular fill <strong>and</strong> the bonding between the casing <strong>and</strong> the f~rmation;~’ however, it also can be used as acasing inspection tool where the disturbances in the casing are large enough to be noticed by thedetector spacing of the tool.(Smollen, 1987)Figure 11.30a: Regions in cased hole investigation.Electric Logging Tool ResponseThe following chart is an attempt to show where each tool will operate most efficiently. It covers themost common form of the basic tool design.53Logging Toolshort spacing focused tools:micrologmicrolateraloglateralogdensitydual neutronvelocityelectromagnetic wave propaga-resistivity Yes no n0bulk density Yes Yes Yesporosity index Yes Yes Yestravel time Yes Yes noporosity index, form. fluid Yes Yes nomineral analysis Yes Yes Yesfree fluid index Yes Yes noborehole diam. Yes Yes Yes11-38
~~- Region of Investigation - KeyI Inside Casing or TubingII Casing or Tubing WallIll Annulus Between Pipe <strong>and</strong> FormationIV Formation1 Primary Area of Investigation of Logging Technique2 Secondary or Incidental Area of Investigation(Smollen, 1987)Figure 11.30b: The regions of primary <strong>and</strong> secondary investigation for the different types of genericcased-hole log surveys.11-39
The tool names were made as generic as possible. Obviously each of the wireline service companieshas it’s own unique nomenclature for it’s version.The primary objectives of any logging program are:1. Detect hydrocarbon bearing formationsa. determine water saturationb. determine porosityc. indication of permeabilityd. possibility of production2. Depth control (measured <strong>and</strong> true vertical)3. Determine lithology (correlation with known stratigraphy)When the continuous phase of the drilling fluid is oil, refined or crude, there is no electrical pathbetween the logging tool <strong>and</strong> the formation. Those tools which require an electrical circuit, such asany resistivity device, will not produce any formation related measurement. The induction tools thatare usually scaled in resistivity are in fact measuring conductivity. By inducing an electric currentwithin the formation there is in turn a current generated within a measuring coil within the tool. Thismeasured current is then proportional to the formation conductivity. It is commonly presented as the ’sreciprocal value, resistivity.The dipmeter tools use pad mounted microconductivity circuits that define formation bedding planes.The inclinometer section of the tool is reporting tool attitude which is related to borehole geometry.The acoustic devices do not have sufficient amplitude to work in a gaseous media but have no problemwith all oil systems. The scanning acoustic tool (BHTV or CAST) is adversely affected by emulsiontype systems where the interface between phases is too great a reflector (hence the problem with oilemulsion muds). This tool also operates at a much higher frequency than the porosity delineatingsonic tool.By utilization of computer processing of combinations of logging tools it is possible to obtain all of theparameters normally measured during logging in water based fluids while in oil based drilling fluidswith very few exceptions.Direct Borehole InvestigationThe inspection of a wellbore can be accomplished with two methods, the borehole televiewer, which isa sonic caliper that operates in a principle similar to sonar <strong>and</strong> the downhole television camera, whichis a closed circuit TV camera.11-40
The borehole televiewer is an acoustic device that scans the surface of the wellbore or the casing byrotating an acoustic transmitter while the tool is moved along the wellbore a ~is.~~~~’ The reflected signalis computer enhanced so that the amplitude of the reflected acoustic signal is displayed as areflected sound “photograph” of the section logged.The borehole television camera is a closed circuit, self-contained television camera that may be eitherside looking or down looking.Formation TesterFormation testers, often referred to as repeat formation testers or RFTs, are devices usually run onwireline that are very useful for establishing criteria about the productivity of the formation.52 Thetesters can give information concerning formation permeability, formation pressure, <strong>and</strong> they can beused to obtain a sample of the formation fluid. The devices work by pressing a sampling nozzle,Figure 11.31 a, into the formation by means of a setting piston that pushes against the far side of thehole. A probe on the side of the tool penetrates the mud cake <strong>and</strong> allows fluid from the formation to bepulled into the tool into flow chambers as the tool is activated. The two chambers, Figure 11.31 b, areautomatically activated every time the tool is set. They withdraw 10 cc’s of formation fluids in eachchamber. Usually one chamber has a higher flow rate than the other such as 50 cc’s per minute <strong>and</strong>125 cc’s per minute. The time to fill each of the chambers is recorded as a measurement of permeability.In one mode of operation the samples are not saved, although samples can be obtained if limitedsampling is desired. The samples taken may either be saved or discarded if repeat measurements areneeded.The Multi-Set Tester fully opened tocontact well bore wall <strong>and</strong> take samples.If malfunction occurs, the Valcorhydraulic dumpvalve automaticallyreleases pad assembly pressure,a//owing the tool to be retrieved.(Schlumberger)Figure 11.31a: A drawing of one type of repeat formatiortester, RFT.11-41
Figure 11.31b:Formation tester schematic <strong>and</strong>operation.Right: diagnostic indicationsfrom pressure chartrecording.SHOEFLOW LINE4GAGEPI.. *.:,.... .I:. '..a... .*; uacoNvxlnArco.' SAN0I .*.. ..PROBE CLOSED'.. OURINGINITIAL SETSEAL VALVESAMPLECHAMBERICHAMBER)P-YIIIMkdllClYmpmpmm(Schuitz et al.)Fluid Movement SurveysProduction logging is the technique using special logging tools to evaluate a well after completion. Thetools used for this operation may be categorized into three general groups:1. Measurement of formation properties through casing <strong>and</strong>/or tubing.2. Measurement of fluid type, flow rate or fluid movement within the casing vicinity.3. Measurement of the condition of the completion string.The tools that are used most often within a completed well include compensated neutron, gamma-ray<strong>and</strong> specialty logs such as activation or carbon/oxygen. The tools that distinguish oil from gas <strong>and</strong>water <strong>and</strong> monitor their flow rates include flow meters, temperature log, fluid density log, radioactivetracers <strong>and</strong> noise logs. Tools for monitoring the mechanical condition of a completed well includecement bond logs, casing collar logs, casing inspection logs <strong>and</strong> casing potential logs. In addition tothe direct measurements available from the previously mentioned logs, many of the tools will providedata that can be further manipulated or compared with data from other tools to indicate special conditionsor problems within the wells.The production logging tools that can differentiate between oil, gas <strong>and</strong> water in a producing well allowthe diagnosis of completion <strong>and</strong> production problems. In particular, these tools help to pinpoint gas, oil<strong>and</strong> water entries <strong>and</strong> exit from the production stream. They may also determine, in combination withother flow measurements, how much fluid is produced from a zone. The fluid identification devices canbe roughly categorized in two major groups. Those that respond directly to physical properties of well-11-42
ore fluids such as density or dielectric constant <strong>and</strong> those that respond to the physical effects causedby the actual flow of fluids such as temperature changes or noise.The pressure differential <strong>and</strong> the pressure difference between two points in a well may be measuredwith a gradiomanometer tool. This tool measures the pressure differential by measuring the expansionor contraction of a small metal bellows system filled with oil. In highly deviated wells, the pressure differencemeasured requires a correction equal to the cosine of the deviation angle in order to convertto a fluid density. Since the measurement is that of a pressure difference, a simplifying assumption ismade that the only cause of a pressure difference is hydrostatic head of the wellbore fluid. This is usuallytrue but has some exceptions if fluid flow is restricted to a small cross sectional area. Other toolssuch as the dielectric log are a measurement of electrical capacitance <strong>and</strong> is very useful for estimatingthe amount of water in the oil. The noise log is an audio log that picks up the noise frequency spectrumin a certain zone.% This is very useful for spotting areas of fluid entry, especially under high pressure.Noise logging is useful wherever a flow of fluid exists in the casing or tubing. The noise log isessentially a microphone suspended in the well. The reading of the noise log is heavily experiencedictated. A fluid sampler log is useful for obtaining PVT samples in an interval.The fluid density log operates on the same principal as a formation density tool. A source of gammaraysis positioned with respect to a detector so that wellbore fluid acts as an absorber of the gammarayradiation. A high count rate indicates a fluid of low density <strong>and</strong> a low count rate indicates a fluid ofhigh density. The advantages of the fluid density log over the gradiometer are the fact that the measurementis not affected by wellbore deviation angle nor friction effect in a high rate well.Fluid Surveys - FormationThe movement of the fluid within the formation becomes of interest to determine if the reservoir isbeing completely swept in flooding operations or whether the entire reservoir is being drained at aneconomic rate. Although these considerations are usually in the area of reservoir engineering, they doimpact well completions because of the importance of stimulations or remedial, zone sealing actionnecessary for extreme problem cases.Zone permeability variances, thief zones, <strong>and</strong> natural fracture networks in flood operations may bemapped with use of tracers in the injected fluid. Normally, a nonreactive tracer in a small concentrationis put in the water at the injection well <strong>and</strong> the produced water in the pattern producing radioactive fluidsor nonradioactive compounds that are normally absent in the water. For a tracer to be successful,it must be nonreactive, nonadsorbing, <strong>and</strong> not degradable by bacteria or other conditions in the reservoir.Monitoring how well a zone is being drained under primary recovery is usually accomplished withpressure surveys. In a well with multiple zones, each zone must be isolated with packers or test tools<strong>and</strong> a maximum pressure attained. Comparison of the measured pressure is made to initial pressurein the zone. Buildups on individual zones are also done but much less frequently. This technique isentirely dependent upon the isolation of the zone, both in the casing <strong>and</strong> the wellbore. A good primarycement job <strong>and</strong> absence of channels, fractures, <strong>and</strong> high vertical permeabilities are required.Fluid Surveys - WellboreFluid movement within the wellbore is of interest to determine where the fluid is entering or leaving thewell. Its customary use is in how much fluid an individual zone is producing or is accepting in the caseof an injection well, but some surveys can also be used to determine if zone-to-zone circulation isoccurring.Fluid entry or exit <strong>and</strong> movement leave passive traces such as temperature changes <strong>and</strong> noise <strong>and</strong>the active trace of velocity. The fluid movement logs are designed to track those changes. The temperaturelog may be used to spot fluid entry or exit from a formation as shown in Figure 11.32. Thefluid gradient across the formation is usually a straight line. If an anomaly occurs, there may be fluidmovement into or out of a zone or, in some cases, fluid movement behind the pipe in a channel in the1 1-43
cement. The noise log is often used with other logging methods as a correlation technique <strong>and</strong> israrely a st<strong>and</strong>-alone log because of interferences.-1 I(Smith, Steffensen, 1975)Figure 11.32: Temperature log scan showing fluid injection location.Tracking the velocity patterns in a well, by spinner surveys (rotating propeller or vane), radioactivetracer, or other methods have been accepted as a method of assigning quantitative numbers to theamount of fluid entering or leaving a particular spot in the wellbore. Both logs are severely limitedunless full flow moves through the measuring area. <strong>Gas</strong> <strong>and</strong> solids also prove troublesome for thetools.Spinner surveys use the fluid movement to drive a propeller or turbine, with the impeller speed beingproportional to the amount of velocity. By moving the tool from top to bottom in an interval, the differencevelocity of the fluid at each place can be correlated into an estimate of how much fluid was enteringor exiting in a given area. The spinner survey tools may be constructed to measure the full fluidmovement by devices that divert all the fluids into the spinner cage or only measure the velocity of fluidsthat flow past the tool. Because of velocity variances across the diameter of the well, especially ineven slightly inclined wellbores, the full diameter of the flowing fluid must be measured to achieveaccurate results, Figure 11.33.Radioactive tracer profiling can also give an indication of the relative velocity of fluid at any point in thewellbore. The tool works by ejecting a small, measured portion of radioactive tracer into the fluid flowingpast the tool <strong>and</strong> detecting the tracer with a counter. The time between ejection <strong>and</strong> detection in awellbore of known diameter <strong>and</strong> for a given ejectoddetector spacing can be used to calculate thevelocity. The tool is a st<strong>and</strong>ard test in some injection wells, but like the spinner survey, the velocitygradients across the wellbore can make accurate measurement difficult unless very careful guidelinesare followed.In an investigation that proved the fallacy tools that do not divert the full flow into a measuring area,Marathon showed in a full-size test facility with one, two <strong>and</strong> three-phase flow-in-pipe, that high ratesof flow up the high side of the pipe (in an angled or inclined wellbore) could be totally missed by any ofthe profiling tools.39 In the most severe case, using a gas cut fluid, the gas would lift liquid up theupper side of the casing <strong>and</strong> water without gas would flow down the lower side of the casing. For atool that measures only part of the stream, the tool might read production or injection in the same wellat the same flow conditions depending on placement of the tool in the wellbore. The angle of deviationthat caused problems started at a few degrees: this covers virtually every well ever drilled. Dresseralso has shown problems with the tool indicating that the radioactive tracer could actually movecounter to the flow of fluids or would plate out on the wall, pipe or formation.39 Modifications to theseproduction tools has made the technique more usable <strong>and</strong> more accurate. In the spinner surveys, afull opening petal basket to divert all of the flow through a small area has heightened accuracy considerably.The tracer profiling tools have also been made much more accurate with the addition of an armthat comes out from the tool <strong>and</strong> injects tracer into the main flow of fluid. By these changes, some ofthe uncertainty in the application <strong>and</strong> interpretation of production surveys has been reduced. The fulldiverting spinner survey is probably more accurate than the side arm tracer tool.t11-44
(Smollen)Figure 11.33: An illustration of a problem with a productionlog in an inclined wellbore. The segregation offluids leads to gas moving along the top of thewellbore, setting up a circulation of liquids upalong the upper side <strong>and</strong> then some liquidscoming down along the lower side of the wellbore.The effect is to show much less production(or even injection).Temperature logs are logging tools with temperature sensitiveThey react very quickly tochanges in the temperature of the wellbore fluids <strong>and</strong> may be used in open holes or cased completions.The primary reasons for running a temperature log are:1. Finding the cement top after a recent cementing operation.2. Finding a lost circulation zone in a currently drilling well., 3. Finding fluid entry <strong>and</strong> exit points in production <strong>and</strong> injection wells.4. Estimating the top of the fracture near the wellbore immediately after fracture stimulation.Undisturbed formation temperature increases predictably with depth. The increase in the temperaturewith depth is known as the geothermal gradient <strong>and</strong> is usually in the range of 1-2OF/lOO ft. Geothermalgradients will vary from place to place <strong>and</strong> should be obtained before working in an area. From thegeothermal gradient <strong>and</strong> the surface temperature, the temperature at any depth may be estimated byextrapolating the curves or using the relationship Tfo-ation = Tsudam + (depth x geothermal gradient).Obviously, the only temperature that varies seasonally is the surface temperature so the value youused for surface temperature in the equations is actually the mean annual surface temperature, whichwill usually range from 60-70°F. Seasonal surface temperatures do not penetrate deeply into theground <strong>and</strong> can be ignored for most logging operations. The only notable exception is the permafrostzone that exists near polar regions. The seasonal temperature effect on fluids can be substantial whenlarge volumes of fluids are injected.Estimation of the formation temperature from openhole logs can be made provided it is rememberedthat a logging run in a currently drilling well is made in fluid which has been circulated, thus the wellboreis cooler than the surrounding formation. In a well that is not being circulated, several runs canbe made in the same hole <strong>and</strong> a plot can be constructed of temperature versus time (from which, theundisturbed formation temperature can be estimated).11-45
Although the cement bond log is now commonly used for determining the cement top on completion,the temperature log was formally used for this purpose. The advantage of the temperature log is that itis cheaper <strong>and</strong> dem<strong>and</strong>s less rig time. The temperature log measures the temperature rise producedby the exothermic chemical reaction that takes place when cement is curing.Loss or entry of fluid from or into the wellbore also can be seen with a temperature log provided thereis substantial difference between the temperature of the wellbore fluids <strong>and</strong> the temperature of the formation.A graph of this type of information was shown in Figure 11.32. This same type of anomaly canbe seen in liquid entry <strong>and</strong> gas production where the temperature log is used to note points of fluidentry.If more than one zone is taking water in an injection well, it is sometimes difficult to judge from thetemperature profile which zone is taking a percentage of injection water. Although there are relationshipsthat establish methods of quantitative determination with the temperature log, a tracer injectionlog or a spinner log that measures the full flow across the entire pipe is recommended for this operation.Channels behind the pipe that are experiencing fluid flow may also be spotted with a temperature logprovided the log is of the special type known as a radial differential temperature tool (RDT) that scanssegments of the wellbore for differences in temperature.= The operating principle of this log relies onthe probability that the temperature in the channel is different from the temperature in the surroundingformation. If the fluid is channeling from above or below, it is very probable that a temperature differentialwill be present. Such a log track is shown in Figure 11.34.(Cooke, 1978)Figure 11.34: Radial temperature scan of a well with a gaschannel downward to the oil zone.Noise LoggingNoise log measurements are made at various preselected or spaced depths in the well. At each stop,the amplitude of the noise in a number of frequency b<strong>and</strong>s is determined <strong>and</strong> plotted on a log. Theseindividual point readings may be joined together by straight lines to give the appearance of a continuouslog such as the one shown in Figure 11.35. The noise log is one of the few tools that can distinguishbetween the entry of gas <strong>and</strong> liquid into the wellbore. Noise logging is governed by two basicprinciples. A change in noise level indicates a change in volumetric flow rate, <strong>and</strong> change in relativenoise level in different frequency b<strong>and</strong>s indicates changes in the phase make-up of the fluid mixture.11-46
*NImD30 1.1110 27113 2 310 27l3 6 -I0 LnO o EX.4Ccoo 8.43U O E16m’623.Zm( COM 0llS.m nba*mrtr-zawl5.1%6 1.71b 1396 1.716 1 . 7 1f,7210 27180 U1m sman 737UIO 1.43ldo 1.43an 737500 7.uPO 8.91sm ~.ynm842%TOTAL 1W.71(Britt, 1976)Figure 11.35: Noise log track showing estimation of fluid production location.Borehole SurveysInspection of the wellbore for fractures in openhole sections or the tubular integrity is availablethrough both direct <strong>and</strong> indirect examining tools. Fracture location, orientation, <strong>and</strong> width can beaccomplished with direct inspection tools such as downhole television cameras, sonic calipers (theborehole televiewer), impression packers5’ <strong>and</strong> multifingered calipers, <strong>and</strong> by indirect tools includingcollar locators, sonic inspection devices (circumferential microsonic <strong>and</strong> acoustic devices, sonic log,cement bond long) <strong>and</strong> some other electronic logs. These devices are useful, within limitations, fordetecting fractures <strong>and</strong> other information, but only at the surface of the casing or openhole.The downhole television camera relays a closed circuit video signal that can be a very detailed inspectionof the surface of casing or borehole. The cameras are usually oriented in the tool so that they aredownlooking, although only an angled mirror is necessary for side inspection. Cameras may run in gasor fluid-filled boreholes depending on their design <strong>and</strong> are very useful for verification or fractures orperforations <strong>and</strong> inspection of visible wellbore damage, perforations or junk in the hole, Figure 11-36a.The cameras have very severe limitations, however, since they must supply their own light-source <strong>and</strong>can only work in very clean water if they are submergible.Impression packers are inflatable, soft rubber covered bags that capture a record of perforations, casingsplits, couplings <strong>and</strong> other surface details on the rubber skin, Figure 11 .36b.59MappingThe use of maps is an important <strong>and</strong> yet often overlooked method of spotting anomalous behavior in awell in relation to other wells in the field.60 Maps may be based on almost any variable in the productionsequence: fluid cuts, pressures (Figure 11.37), kh, etc. Most maps are constructed by posting thevariable by the well location <strong>and</strong> drawing “contour” lines through points of the same value. Another11-47
(Courtesy of Arnoco Production Co.)Figure 11.36a: A photo of a perforation taken by a side looking televisioncamera at a depth of 2046 ft. The well was filled withwater.(Hutchison, Worfd <strong>Oil</strong>, Nov. 1974)Figure 11.36b: Inflatable packer impression showing threads <strong>and</strong> aperforation through the threads of a coupling in cas-common map is the stick or profile map that is useful for matching formation tops, determining formationdip <strong>and</strong> thickness or tracing pinchouts, Figure 11.38.Two of the most useful maps are the GOR map <strong>and</strong> the iso-pressure map. The GOR map is developedon a field base map with the GOR of each well posted at the well location <strong>and</strong> the points of like GORconnected by iso-GOR lines. A high GOR producer in an area of low GOR wells (assuming a consistentstructure) can signal a gas channeling problem. The same principle is effective in construction ofa WOR map with edge or bottom drive reservoirs. The iso-pressure map is usually constructed withreservoir or flowing bottomhole pressures. With this map, identification can be made of wells that areboth over <strong>and</strong> under produced.11-48
NWSE(Slatt & Hopkins, JPT, Feb. 1990)Figure 11.37: A stick or cross section map across part of a field. Eachdark vertical line is a well.(Slatt & Hopkins, JPT, Feb. 1990)Figure 11.38: A map of flow units (layers) in a field.Each dark vertical line represents a well.Overlays of the maps may often spotlight reasons for anomalies or production problems, e.g., lowpressure are usually consistent with high GOR incidences; a high GOR in a region of normal pressuremay signal gas entry from an outside source.11-49
Completion <strong>and</strong> Lift AnalysisWhen a formation shows a large, unexplained skin damage <strong>and</strong> well records show that acidizing orchemical treating has historically performed poorly, there is a good possibility a reservoir feed-in problemcaused by inadequate lift or poor perforations. In the case of suspicious perforations, it is muchmore economical to reperforate several intervals with a through-tubing gun than to acidize or otherwisechemically treat formations. Problems with lift equipment rank very high among the reasons forlow producing rates in many wells. Lift equipment problems can usually be seen by the height of thefluid in the well as judged by sonic instruments. A high fluid level in a well results in large back pressureson the formation with a net decrease in the pressure differential that forces fluids toward thewellbore. In almost any application, the height of the fluid above the pump must be controlled to establishan optimum completion.How well a properly designed lift system is working may also affect the fluid level <strong>and</strong> the productivityof the well. Analysis such as the dynamometer test for rod pumped wells <strong>and</strong> performance curvescombined with fluid height measurements are often useful in spotting problems with artificial lift equipment.Production <strong>and</strong> Operations InformationInformation recovered from producing operations is one of the very best sources of diagnostic data - ifit is recorded. The following is a partial list of information generated by visual exams.1. Location of deposits on tubing. When the tubing is pulled, note the location of paraffin, asphaltenes,scale, bacteria, rust <strong>and</strong> other deposits. Samples of material from freshly pulled wells arevaluable for tests of solvents. The location is needed to calculate volumes, overflushes <strong>and</strong> spottinginformation. Measure deposit thicknesses to estimate rate of deposition or growth.2. Character of corrosion attack areas. Presence <strong>and</strong> location of pitting, local corrosion, erosion<strong>and</strong> wear areas. Post-mortum examinations can often specify reasons for failure <strong>and</strong> methods ofprevention - IF there is a sample to examine. Also note presence of bacterial slime, the odor ofH,S <strong>and</strong> color changes of coatings. If the tubing is coated, note location <strong>and</strong> number of holidays(holes), cracks, <strong>and</strong> general condition.3. Stains on outside of tubing indicate liquid levels. Circular markings indicate fluid entry points.Erosion is an indication of s<strong>and</strong> entry with the fluid stream or extremely high velocity flow. Wearareas show tubing movement that is common with rod pumped wells without tubing anchors, orless often, in thermal wells due to stretch caused by temperature cycling. Running a freshlypainted tailpipe across from perforations or the site of an expected leak will show strong fluidentry points. The soft paint will show discoloration or marking where fluids impinge on the pipe.Erosion of the paint shows strong flow or entry of solids in the fluid stream.4. Water cut <strong>and</strong> salinity changes can signal breakthrough of floods, natural water drives, leaks, orload fluid recovery. Water cut may also be coincidental with onset of emulsion upsets, s<strong>and</strong> production,<strong>and</strong> drawdown pressure changes.5. GOR changes may be caused by leaks, excessive drawdowns, depletion <strong>and</strong> fracturing becausegas rate tests are often infrequent <strong>and</strong> inaccurate so repeat tests are useful.6. Stimulation fluid <strong>and</strong> kill fluid backflow effects often reflect character of the formation <strong>and</strong> the formationfluids. Presence of surface emulsions, sludges <strong>and</strong> precipitates indicate fluid incompatibilitiesthat may occur downhole. Strength of returning acid can signal the need for less acid orlower strength acid. Iron contents in returned spent acids may be indicative of corrosion or highnative iron contents in the formation. Background data is needed before corrosion is predicted.Slow cleanup of wells after stimulation is an indication of “temporary damage” such as paraffin11-50
precipitation by cool stimulation fluids, salinity shock from a higher or lower salinity brine,trapped water or gas in the pore space, etc.7. Monitoring pH when recovering spent acids can identify the end of the recovery period. A rise inpH above 6 is often coincidental with the end of emulsion upsets in tank batteries following acidtreatments. Presence of fines <strong>and</strong> dissolved iron is also an important emulsion factor in predictingemulsion problems following an acid treatment.8. Pressure effects while injecting fluids can help locate depth of damage in the formation. If thepressure declines sharply when the acid hits the formation, the damage is very shallow - probablyface plugging. If pressure declines slowly, the damage is deep or the damage is slowly solublein the acid. If pressure increases when acid hits the formation, damage is being created,solids are being carried by the acid or the reservoir is very limited. If pressure remains constant,damage is not reactive with acid, the well is not damaged, or another problem such as limitedperforations are limiting the fluid entry <strong>and</strong> masking the effects of the acid.9. Examination of recovered perforating guns can give an idea of how well the perforating chargesfired. The roundness <strong>and</strong> placement of the hole is important; the size of the hole in the gun is notimportant.10. Condition of seals on stingers <strong>and</strong> other seal assemblies can show evidence of seal degradation,cyclic wear, or lack of contact.11. Recovered logging tools, especially those with centralizers can yield samples of casing wallcoating such as scale, sludge, or bacteria. Depth or origin of the deposit cannot be gauged.12. Well production behavior may give clues to problems with fluid heading, excessive drawdownsor other factors. Nonsteady state behavior should be investigated.Rock Mechanics Information From LogsDerivation of formation in-situ properties can be important because of the effect of the stresses ondrilling rate, perforating penetration, fracture azimuth (global or compass direction), height, <strong>and</strong> eventhe ease of fracturing."'-'j4 Although it is possible to determine the stress values from carefully prepared,oriented core, the use of such processes is costly <strong>and</strong> is limited by depth <strong>and</strong> other factors. Theuse of full waveform sonic logs offers some information that, when coupled with information from othersources such as core work or indentation (hardness) tests, can give reasonable values of in-situstresses. Elastic wave propagation in rocks provides a means to determine the dynamic mechanicalproperties of rocks. The sonic wave velocity increases in a material as that material's strength <strong>and</strong>hardness increases.65 Full waveform sonic logs are generated by a tool with a generator <strong>and</strong> a set ofreceivers at various points up to 12 ft away. The sonic signal enters the formation from the liquid filledborehole (the tool is centralized) <strong>and</strong> spreads radially as a compression wave. At every point of theborehole, the traveling wave generates a signal that goes back through the fluid to the receivers in thetool. The velocity of the signal is a function of the density of the formation. With selective processing<strong>and</strong> tool calibration, the difference between pipe signal <strong>and</strong> formation signal can be distinguished.(The behavior of the return signal is also the basis for the cement bond log in cased holes.) The characterof the waveform will vary as the formation varies.65A second wave, generated by the compression wave as it moves through the formation, is the shearwave. This wave results from molecular friction in response to the initial compression wave. The shearwave is actually a second compression wave whose arrival at the receiver follows that of the initialcompression wave. A trace of the wave recording is shown in Figure 11 .39.65 The compression <strong>and</strong>shear wave velocities are picked from the log <strong>and</strong> used to calculate various in-situ parameters.11-51
. 1Time (XS)Figure 11.39: Shear wave recordingI(Tubrnan et al.General equations relating sonic waves to elastic properties are available in theTheseequations may provide estimates of the in-situ properties but the measurements may be affected bywater salinity <strong>and</strong> saturation, formation fluid type, unconsolidated sediments <strong>and</strong> the other factors thataffect log quality.649 Kp VzE- Young's Modulus3K+pV,2'K = p - 4/3 , Bulk Modulus(1 1.27)(1 1.28)M = 112, Poisson's ratio(1 1.29)or, in travel time3Afi-4At;E = ($)[ At: - At:x 1.34 x 10¹⁰(1 1.30)11-52
K = p( 3At: - 4At; 1~1.34~ 10lo3At: - At:(11.31)(1 1.32)whereE = Young’s modulusK = Bulk modulusV, = Compressional velocity, (Wsec)Vs = Shear velocity, (Wsec)p = Bulk density, (g/cc)At, = Compressional travel time (pseclft)Ats = Shear travel time (psec/ft)p = Poisson’s ratioSince rock density is a direct relationship between the volume of void spaces in the rock <strong>and</strong> thematrix material, for a particular lithology, the higher the density of the rock, the stronger the rock <strong>and</strong>the lower its porosity.64 Other tools that are useful in rock property analysis are the hardness tester orindentation tool68169 <strong>and</strong> the resistivity logs.64A widely accepted equation for calculation of closure stress uses Poisson’s ratio calculated from shearto compressional ve~ocities.~~s, = -ss,+P - 1-2Ps1-P l-p P(1 1.33)where:Sh = Horizontal closure stressp = Poisson’s ratioS, = Vertical overburden stress (usually 1 psi/ft)Sp = Stress due to formation pressureWhen formation pressure is in a range of normal to 0.6 times normal, Sp is equal to the pore pressure.7oExamples of the correlation of measured closure stress <strong>and</strong> log derived closure stress gradientsare shown in Figure 11.40.Mechanical PropertiesThe effect of in-situ stresses becomes very important in consideration of the effect of mud weight onformation stability. The classic cube segment affected by stresses,11-53
SFE 1 calculated <strong>and</strong> measured values'is converted to radial coordinates<strong>and</strong>Oz= Po+2p((a,-oy)
(1 1.38)where=,=YPoisson’s ratio (about 0.25 for most cores)A multiplier (0.6)Overburden pressurePore pressureMud hydrostatic pressure(1 1.39)The pore pressure <strong>and</strong> the overburden are usually constant over then intervals <strong>and</strong> test times so theonly variable is the mud hydrostatic pressure. As the mud weight increases, the tangential stressdecreases <strong>and</strong> radial stress increases, <strong>and</strong> as mud weight decreases, the tangential stress increases<strong>and</strong> radial stress decreases.62Basic Logging Tool ResponseThere are a number of useful logs that are available for initial <strong>and</strong> remedial investigation of wellbores,formations <strong>and</strong> flow. The following paragraphs illustrate the more common logging tools.Resistivity logging is useful in formation correlation from well to well <strong>and</strong> also in the identification <strong>and</strong>distinction of hydrocarbons from water in the formation. The formation resistivity is a property of therock that indicates how resistive the total rock package is to the flow of electrical current. The first typeof resistance logging is electrical logging <strong>and</strong> the second is induction logging. Electric logs are the firstform of logging that was developed for subsurface application <strong>and</strong> was originally meant to map subsurfaceore deposits. It measures resistivity when passing a current between electrodes. The currentis passed <strong>and</strong> the resulting voltage or potential is measured between the other electrodes. One electrodeis at the surface <strong>and</strong> the other is at the end of the logging cable downhole. The measured voltagecan be converted in resistivities by estimating the current flow pattern in the reservoir. This flowpattern is a function of such things as electrode spacing, borehole size, drilling mud or kill fluid salinity,<strong>and</strong> such minor things as logging speed <strong>and</strong> instrument design. A series of readings of resistivitybecomes the familiar log response of resistivity.The depth of investigation that can be reached with this type of tool is the radial depth that the electriccurrent processes in the formation. It is related to spacing of the tool <strong>and</strong> the design of the receptors.A microresistivity device has a depth of investigation of a few inches, while the deep laterolog mayinvestigate several feet deep.Induction resistivity is obtained by inducing a current into the formation using specially placed coils inthe logging tool. These coils produce a magnetic field which causes current to flow in the formationaround the wellbore. These currents create a magnetic field that causes a small current to flowthrough measurement coils in the tools. Part of the problem with these dual magnetic fields <strong>and</strong> coils11-55
is what is called direct coupling, <strong>and</strong> this must be avoided. As a general rule, most induction toolshave an investigation depth of a few feet.The SP log, or spontaneous potential log, is not a resistivity measurement, but is instead a very simplemeasurement of voltage that measures the difference between the fluid salinity in the wellbore <strong>and</strong> thesalinity of another fluid in the formation rock. The primary use of the SP is as an indicator of permeability.By combining various resistivity measurements with knowledge of the porosity <strong>and</strong> knowledge of theresistivity of the water in the formation, the identification of oil in gas-bearing formations is possible.Gamma Ray LoggingGamma ray logs use the natural radioactivity in the formation to distinguish reservoir rocks fromshales. Gamma ray logging measures the natural gamma radiation emitted by the formations. Typically,this radioactive signature remains relatively constant during the entire life of the well <strong>and</strong> is aconvenient tool for depth correlations <strong>and</strong> for determining formation types, as well as identifying individualformations in offset wells. In general, the higher the radiation signature from the rock, the lesslikely that the rock is a potential reservoir rock <strong>and</strong> the more likely that it is a shale. There are significantexceptions to this general rule, however. Many formations that contain either radioactive isotopesor volcanic debris have a high natural radioactive signature <strong>and</strong> may be reservoir.As with most logs, it is advisable to use the reading from several logs <strong>and</strong> compare the data. The identificationof nonshale formations as target formations is the first step; but the second step is determiningfrom porosity logs if there is pore space available for containing <strong>and</strong> flowing fluids. The thirdrequirement then uses the resistivity logs to determine if the pore space contains water or hydrocarbon.Acoustic or Sonic LoggingSonic or acoustic logs measure formation porosity. Acoustic devices measure reception <strong>and</strong> characteristicsof a sound wave emitted from a transmitter in the tool <strong>and</strong> received from the formation. Theconic wave reaches one or more receivers in the tool after being transmitted. The travel time <strong>and</strong> theamplitude of the sound wave are the primary measurements of the tool. The velocity, which is commonlyreported on the log, is the inverse of the travel time.Sonic tools may be of more than one type. Some sonic tools bounce the wave off the rock face. Theamplitude <strong>and</strong> travel time of the wave is recorded <strong>and</strong> measured by a spinning transducer that is boththe transmitter <strong>and</strong> receiver in the tool. This can create an image of the borehole on logging film. Thistype of tool, often referred to as a sonic caliper or a televiewer, is useful for mapping physical surfacechanges in the wellbore. The second type of tool, <strong>and</strong> by far the most common, is the porosity measuringtool. In any solid object, there is a linear relationship between the effective porosity <strong>and</strong> thetravel time. In relatively clean (clay free) reservoir rock, the effective porosity is the intergranularporosity <strong>and</strong> excludes both fractures <strong>and</strong> large vugular porosity. Several factors can lessen the effectof porosity measurement with a sonic tool. Higher pressures, even with gas, can make the sonic toolread lower than normal porosities. For this reason, several sonic tools are generally run <strong>and</strong> compared.The response from other logs is also taken to determine which porosity log will have the greatestaccuracy.Neutron LoggingNeutron logs are another method of measuring traditional formation porosity. One popular style of thetool is a compensated neutron log which uses a neutron source <strong>and</strong> two or more neutron detectors.The source emits neutrons into the formation. The count rate of neutrons coming back to the tool isgenerally an inverse function of porosity. The tool response may be also affected by borehole condi-11-56
tions. To minimize this effect, the ratio of the two detectors is often taken. In this manner, the porosityvalue is much less affected by borehole conditions.Density LoggingThe density log is the third type of formation porosity measurement. Density tools utilize a gamma raysource placed a distance from the gamma ray detector. The gamma ray count rate or reception in thedetector is inversely proportional to the rock density. If the matrix density is constant, the rock densityis an inverse function of porosity. This means that as porosity increases, the gamma ray increases. Itis easier for gamma rays to find their way from the source through the rock to the detector when theporosity is high <strong>and</strong> the obstructing density of the formation is lower.The gamma ray density log is different from the gamma ray tool mentioned in the first paragraph ofthis section. The gamma ray tool has no gamma ray source, only a detector that measures natural formationgamma ray radiation.Another tool of a similar nature is the natural gamma ray spectroscopy tool that breaks down the naturalgamma radiation into it’s primary radioactive components; namely, potassium, uranium, <strong>and</strong> thorium.The density log is the only gamma ray tool that utilizes both a gamma ray source <strong>and</strong> a gamma raydetector.Natural Gamma Ray Spectroscopy LogThe primary use of natural gamma ray spectroscopy logs is to measure the natural radioactive sourceelements of potassium, uranium, <strong>and</strong> thorium. This allows a direct observation of clay type, <strong>and</strong> insome cases, the occurrence of fractures. The tool uses sensitive detectors that measure variousenergy levels <strong>and</strong> the output requires mathematical modeling for processing.Induced Gamma Ray Spectroscopy LogThe induced gamma ray spectroscopy log measures the elemental makeup of rock. It is probably oneof the most complex tools in the logging suite. It utilizes a pulsed neutron source that bombards theformation with neutrons. The source is turned on <strong>and</strong> then turned off in a cycle that allows time formeasurement of gamma ray radiation returning from the rock. Information available from this type oftool includes identity of rock matrix type, porosity, <strong>and</strong> the presence of oil without the knowledge of thewater salinity value that is required for resistivity logging.11-57
<strong>References</strong>1.Mach, J., Proano, E., Brown, K. E.: “A Nodal Approach for Applying Systems Analysis to Flowing<strong>and</strong> Artificial Lift <strong>Oil</strong> or <strong>Gas</strong> Well,” SPE 8025.2.3.4.5.6.7.8.9.10.11.12.13.14.15.16.17.18.19.Brown, K. E., Lea, J. F.: “Nodal Systems Analysis of 011 <strong>and</strong> <strong>Gas</strong> Wells,” J.P.T., (Oct. 1985),pp. 1751 -1 763.Gilbert, W. E.: “Flowing <strong>and</strong> <strong>Gas</strong>-Lift Well Performance,” API, Spring Mtg., Pacific Coast District,Los Angeles, May 1954.Smith, R. V.: “Practical Natural <strong>Gas</strong> <strong>Engineering</strong>,” Pennwell Publishing Co., Tulsa, OK (1 983).Duggan, J. 0.: “Estimating Flow Rate Required to Keep <strong>Gas</strong> Wells Unloaded,” J. Pet. Tech.,(Dec. 1961) 1173.Turner, R. G., Hubbard, M. G., Duckler, A. E.: “Analysis <strong>and</strong> Prediction of Minimum Flow Rate forContinuous Removal of Liquids from <strong>Gas</strong> Wells,” J.P.T. (Nov. 1969) p. 11 75.Smith, R. V.: “Sound <strong>Engineering</strong> Improves Natural <strong>Gas</strong> Production,” Pet. Eng. Intl. (Feb. 1989),pp. 35-44.D’Arcy, H.: “Les Fountaines Publiques de la Ville de Dijon,” 1856.Patton, L. D., Abbott, W. A.: ‘The Well Inflow System: Applications,” Pet. Eng. Int. (Nov., 1980),p. 56, 58, 60, <strong>and</strong> 64.Rawlins, E. L., Schellhardt, M. A.: “Back-Pressure Data on Natural <strong>Gas</strong> Wells <strong>and</strong> Their Applicationto Production Practices,” Bureau of Mines Monograph 7, (1935).Long, 0. R., David, M. J.: “A New Approach to the Hyperbolic Curve,” J.P.T., (July 1988) pp. 909-919.Patton, L. D., Abbott, W. A.: “The Well Outflow System: Tubing Performance,” Pet. Eng. Int.,(March 1981), pp. 96-1 07.Forchheimer, P.: “Wasserbewegung durch Boden,” Zeitz ver Deutsch Ing. (1 901) 45, 1731,Green, L., Duwez, P.: “Fluid Flow Through Porous Metals,” J. Appl. Mech. (March 1951) p. 39.Holditch, S. A., Morse, R. A.: “The Effects of Turbulence on the Behavior of Hydraulically Fractured<strong>Gas</strong> Wells,” SPE 5586, 50th Annu. Fall Mtg., Dallas, Sept. 28-Oct. 1, 1975.Cornell, D., Katz, D. L.: “Flow of <strong>Gas</strong>es Through Consolidated Porous Media,” Ind. <strong>and</strong> Eng.Chem. (Oct. 1953), p. 2145.Firoozabadi, A., Katz, D. L.: “An Analysis of High-Velocity <strong>Gas</strong> Flow Through Porous Media,”JPT, (Feb. 1979), pp. 211-216.Geertsma, J.: “Estimating the Coefficient of Inertial Resistance in Fluid Flow Through PorousMedia,” SPEJ, (Oct. 1974), pp. 445-450.Cooke, C. E., Jr.: ‘Conductivity of Fracture Proppants in Multiple Layers,” J. Pet. Tech., (Sept.1973), 1101-1107.11-58
20. Fetkovich, M. J.: “Decline Curve Analysis Using Type Curves,” J. Pet. Tech., (June 1980), 235-236.21. Long, 0. R., Davis, M. J.: “A New Approach to the Hyperbolic Curve,” J.P.T. July 1988, pp. 909-91 9.22. Gentry, R. W., McCray, A. W.: ‘‘The Effect of Reservoir <strong>and</strong> Fluid Properties on ProductionDecline Curves,” J. Pet. Tech., (Sept. 1978) (1 327-1 341).23. McNulty, R. R., Knapp, R. M.: “Statistical Decline Curve Analysis,” SPE 10279, Annual Mtg., SanAntonio, Oct. 5-7, 1981.24. Bailey, W.: “Optimized Hyperbolic Decline Curve Analysis of <strong>Gas</strong> Wells,” <strong>Oil</strong> & <strong>Gas</strong> J., (Feb. 15,1982) 118.25. Fetkovich, M. J., Vienot, M. E., Bradley, M. D., Kiesow, U. G.: “Decline Curve Analysis UsingType Curves-Case Histories,” SPE Form. Eval., (Dec. 1987), pp. 637-656.26. Patton, L. D., Abbott, W. A.: “The Systems Approach to Well Behavior,” Pet. Eng. Int. (July1980), pp. 90-94.27. Straub, T. J., Autry, S. W., <strong>King</strong>, G. E.: “An Investigation into Practical Removal of Downhole Paraffinby Thermal Methods <strong>and</strong> Chemical Solvents,” SPE 18889, Prod. Oper. Sym., Okla. City,March 13-1 4, 1989.28. Widmyer, R. H.: “Use of Monitor/Observation Wells in the Monitoring <strong>and</strong> Evaluation of <strong>Oil</strong>Recovery Projects,” J. Pet. Tech., (Aug. 1987), pp. 967-975.29. Gesink, J. C. J., Van den Bergen, E. A., de Monchy, A. R., Rijnders, J. P., Soet, J.: “Use ofGamma Ray-Emitting Tracers <strong>and</strong> Subsequent Gamma Ray Logging in an Observation Well toDetermine the Preferential Flow Zones in a Reservoir,” J.P.T., (April 1985), pp. 711-719.30. Arps, J. J.: “Analysis of Decline Curves,”Trans., AIME, (1944) 160, 228-247.31. Review of Basic Formation Evaluation, Johnston-Macco, Schlumberger.32. Greene, W. R.: “Analyzing the Performance of <strong>Gas</strong> Wells,” J.P.T., (July 1983), pp. 1378-1 384.33. Barron, W. C.: “Simple Method Determines <strong>Gas</strong> Flow Rate,” Pet. Eng. Int., (May 1988), pp. 52-56.34. Patton, L. D., Abbott, W. A.: The Systems Approach to Well Testing (Feedback),” Pet. Eng. Int.(Sept. 1980), pp. 80-90.35. van Everdingen, A. F., <strong>and</strong> Hurst, W.: “The Application of the Laplace Transformation to FlowProblems in Reservoirs,’’ Trans., AIME (1949) 186, 305-324.36. Horner, D. R.: “Pressure Buildup in Wells,” Proc., Third World Pet. Cong., The Hague (1951)Sec. II, 503-523.37. Agarwal, R. G., Al-Hussainy, R., <strong>and</strong> Ramey, H. J., Jr.: “An Investigation of Wellbore Storage <strong>and</strong>Skin Effect in Unsteady Liquid Flow: I . Analytical Treatment,” SPEJ (Sept. 1970) 279-290.11-59
38. Economides, M. J., Nolte, K. G.: Reservoir Stimulation, Schlumberger Educational Services,1987.39. Dewan, J. T.: Essentials of Modern Open-Hole Log Interpretation, Penn Well Books, 1983,Tulsa.40. Vogel, C. B., Herolz, R. A.: ‘The CAD, A Circumferential Acoustical Device for Well Logging,” J.Pet. Tech., (Oct. 1981), 1985-87.41. Setser, G. G.: “Fracture Detection by Circumferential Propagation of Acoustic Energy,” SPE10204, Annual Mtg., San Antonio, Oct. 4-7, 1981.42. Suau, J., Gartner, J.: “Fracture Detection from Well Logs,” Log Analyst, (1 980) 21, No. 2,3.43. Hirsch, J. M., et al.: “Recent Experience with Wireline Fracture Detection Logs,” SPE 10333,Annual Mtg., San Antonio, Oct. 4-7, 1981.44. Koerperich, E. A.: “Evaluation of the Circumferential Microsonic Log - A Fracture DetectionDevice,” Soc. Prof. Well Log Anal., June 4-7, 1975.45. Morris, R. L., Grine, D. R., Arkfled, T. E.: “Using Compressional <strong>and</strong> Shear Acoustic Amplitudesfor the Location of Fractures,” J. Pet. Tech., (June 1964), 623-32.46. Zemanek, J. et al.: “The Borehole Televiewer - A New Logging Concept for Fracture Location<strong>and</strong> Other Types of Borehole Inspection,” J. Pet. Tech., (1969), 762-74.47. Archie, G. E.: “The Electrical Resistivity Log as an Aid in Determining Some Reservoir Characteristics,”SPE-Trans. (1 942), pp. 54-62.48. Hunt, E., Ebinger, C. D.: “Use of New Tools, Techniques, Enhance Fracturing Results,” O.G.J.(March 27, 1989), pp. 33-41.49. Smollen, J. J.: “Cased-Hole Logging - A Perspective,” The Log Analyst, March-April 1987,pp, 165-1 75.50. Fertl, W. H., Pilkington, P. E., Scott, J. B.: “A Look at Cement Bond Logs,” SPE Reprint Series,No. 5a, 95-105.51. Clerke, E. A., Van Akkeren, T. J.: “Borehole Televiewer Improves Completion Results in a PermianBasin San Andres Reservoir,” SPE Production <strong>Engineering</strong>, (Feb. 1988), pp. 89-96.52. Schultz, A. L., Bell, W. T., Urbanosky, H. J.: “Advancements in Uncased-Hole, Wireline FormationTester Techniques,” J.P.T, (Nov. 1975), pp. 1331-1 336.53. Conversation with Gil Feather, Amoco, July, 1991.54. Britt, E. L.: “Theory <strong>and</strong> Applications of the Borehole Audio Tracer Survey,” S.P.W.L.A. AnnualSymposium, June, 1976.55. Wages, P. E.: “Interpretation of Post Fracture Temperature Surveys,” SPE 11 89, 57th AnnualMtg., Sept. 26-29, 1982, New Orleans.56. Dobkins, T. A.: “Methods to Better Determine Hydraulic Fracture Height,” SPE 8403,54th AnnualTech. Mtg., Las Vegas, Sept. 23-26, 1979.11-60
57. Smith, R. C., Steffensen, R. J.: “Interpretation of Temperature Profiles in Water Injection Wells,”J.P.T. (June 1975), p. 777-784.58. Cooke, C. E.: “Radial Differential Temperature (RDT) Logging - A New Tool for Detecting <strong>and</strong>Treating Flow Behind Casing,” SPE 7558, 53rd Annual Mtg., Houston, Oct. 1-3, 1978.59. Hutchison, S. 0.: “Impression Tool Defines Downhole Equipment Problems,” World <strong>Oil</strong>, (Nov. 4-7), 74-80.60. Anderson, J.S.: ”Pressure Mapping as an Aid to Underst<strong>and</strong>ing Reservoir Drainage,’’ SPE22962, Asia Pacific Conference, Perth, Australia, Nov. 4-7, 1991.61. Warpinski, N. R., Northrop, D. A., Schmidt, R. A.: “In Situ Stresses: The Predominant Influenceon Hydraulic Fracture Containment,’’ J.P.T., pp. 653-664 (1 984).62. Van Eekelen, H. A.: “Hydraulic Fracture Geometry: Fracture Containment in Layered Formations,”S.P.E.J., pp. 341 -349, (1 982).63. Coates, G. R., Denoo, S. A.: “Mechanical Properties Program Using Borehole Analysis <strong>and</strong>Mohr’s Circle,” SPWLA Paper Presented at the 22nd Annual Logging Symposium, June 23-36,1981.64. Teufel. L. W.: “ln-Situ Stress State in the Mounds Test Well as Determined bv the AnelasticStrain‘Recovery Method,” SPE 13896, Low Permeability <strong>Gas</strong> Symposium, Dknver, May 19-22,1985.65. Tubman, K. M., Cheng, C. H., Cole, S. P., Toksoz, M. N.: “Synthetic Full-Waveform AcousticLogs in Cased Boreholes, II Poorly Bonded Casing,” Geophysics, vol. 51, no. 4, (April 1986)pp. 902-913.66. Onyia, E. C.: “Relationships Between Formation Strength, Drilling Strength, <strong>and</strong> Electric LogProperties,” SPE 181 66, 63rd Annual Technical Conference, Houston, October 2-5, 1988.67. Dresser Atlas Log Interpretation Charts (1 979).68. Kowalski, J.: “Formation Strength Parameters from Well Logs,” SPWLA Sixteenth Annual LoggingSymposium, June 4-7, 1975.69. Van der Vlis, A. C.: “Rock Classification by a Simple Hardness Test,” Proc. Second CongressIntl. Soc. Rock Mech. Belgrade (1970), pp. 23-30.70. Holt, R. M., Ingsoy, P., Mikkelsen, M.: “Rock Mechanical Analysis of North Sea Reservoir Formations,”SPE Formation Evaluation (March 1989), pp. 33-38.71. Kimmel, J. W.: “Larger ID Tubulars Boost Deep <strong>Gas</strong> Well Production,” Southwest <strong>Petroleum</strong>Short Course, Lubbock.11-61
Chapter 12: Chemical <strong>and</strong> Thermal StimulationWhen the formation will not produce at a rate equal to the expectations for the project, a stimulationshould be considered. There are two controls on the application of a stimulation treatment:1 If permeability damage in the near wellbore area is blocking the production or injection of fluids,<strong>and</strong>2. If the permeability is low <strong>and</strong> the reservoir pressure is still high.If either of the conditions are met <strong>and</strong> there are sufficient reserves remaining so that the increase inproduction or injection will pay for the total cost of the stimulation, then the treatment can be justified.Condition number one is the basic argument for a chemical treatment to remove damage. Conditionnumber two is the justification for fracturing (a few formations that cannot be fractured are chemicallytreated to improve initial permeability). Current technology offers several methods of increasing productionfrom an existing wellbore, the two most common of which are hydraulic fracturing <strong>and</strong> matrixtreating. This chapter covers the basic principles involved in matrix treating <strong>and</strong> some of the morecommon treatments. Matrix treating may involve any of a series of operations. They divide into chemical<strong>and</strong> physical treatments.Chemical stimulation is a collection of acid, gas, surfactant, reactant <strong>and</strong> solvent based treatmentsthat are intended to remove permeability damage or improve the natural matrix permeability throughnonfracturing methods. Physical treatments include perforating, perforation breakdown by nonproppantfracturing (limited in this concept to linking perforations, small explosive detonations, <strong>and</strong> operationssuch as underreaming).The type of treatment selected will depend on the type <strong>and</strong> extent of the permeability damage or thepermeability increase necessary to meet design criteria. The most efficient use of a chemical stimulationtreatment, as far as the well’s productivity is concerned, is to remove formation damage in a nonfracturedwell or remove damage to the fracture proppant pack in a fractured well. The limit on matrixstimulating an undamaged well can be seen by an examination of darcy law for radial flow throughbeds in series.where:re = drainage radius, ftr, = wellbore radius, ftrlK,K2= radius of zone of improved permeability, ft= permeability of improved zone, md= average reservoir permeability (unstimulated), md12-1
Example 12.1For a 15 md undamaged reservoir permeability on a 660 ft drainage area with a 6 in. wellbore, improvingthe permeability of the first 6 in. out from the wellbore face to a permeability of 1000 md would givean average permeability of:Kavg =600In- 0.51 10 1 660-In- +-In-1000 0.5 15 1Kavg =7.19(0.001) (0.693) + (0.067) (6.49)Kavg = 16.5 mdThe productivity increase from a stimulation that produces this type of perm response would be:-=0, 16.5 (7.19)Q, 15 (6.49)= 1.21If original productivity, Q,, were 100 BPD, then the improvement, Q2,would be 21 BPD or 21%.Example 12.2If the well had a zone of severe permeability damage of 0.005 md due to a mud cake, the effect ofeven a 1/4 in. thick cake on the face of the formation would be:Kavg =600In- 0.481 0.5 1 660In- + -Ino.0050.48 15 0.5= 0.84 md<strong>and</strong> the effect on productivity would be:If Q, had been 100 BPD, the production through the damage, QP, would be 5.6 BPD or only a few percentof the well’s potential. If the damage in this example were removed, the increase would be over1000% of the damaged rate. Therefore; the rate of increase possible in treating a damaged welldepends on the amount of initial damage.12-2
The basic equation shows that the increase in total flow rate at a given reservoir driving pressure isabout 10 to 20% for a well with undamaged permeability, even if the permeability of the first few inchesof the formation is raised almost to infinity. This does not mean that chemical stimulations to removedamage are not useful: when damage removal is considered, the improvements in productivity of thewell may jump several times. The key to the use of chemical stimulations is whether or not the formationis damaged <strong>and</strong> if the damage can be removed.Selecting a C<strong>and</strong>idate WellBefore any stimulation treatment is considered for a well, some kind of pretreatment analysis shouldbe run to determine the need for that stimulation <strong>and</strong> the cause of permeability reduction if the well isdamaged. Descriptions of several of these methods are given in the chapter on diagnostics. If abuildup test, for example, indicates that the deliverability of a well is impaired by formation permeabilitydamage, then an analysis of well history <strong>and</strong> formation characteristics should be made to determinethe type of permeability damage <strong>and</strong> its probable depth. If the damage can be removed by acid,a stimulation to remove or bypass the effects of the damage may be chosen. Blindly trying an acidtreatment as a last-hope technique will usually result in large expense with little or no results. Poorperforations, for example, will look like damage even on a buildup test but cannot be improved withacidizing. A good evaluation is critical. Unfortunately, no test or set of tests can usually pinpoint thetype of damage; a deductive evaluation is usually required.There are three basic types of chemical stimulation designs that encompass the vast majority of treatments:wellbore cleanup, matrix treatment, <strong>and</strong> fracture acidizing. The choice between matrix treating<strong>and</strong> fracturing may best be made after reviewing the type of damage <strong>and</strong> the materials available forremoval. To achieve economical damage removal <strong>and</strong> select the right treatment, two factors must beconsidered: the type of the damage <strong>and</strong> the extent of the damage. Removing the damage, regardlessof the treatment method used, depends on removing the damage throughout all the wellbore contact.If the damage covering only part of the wellbore is removed, the treatment results will reflect a muchsmaller production increase. For this reason, almost all damage removal treatments need to bediverted away from the undamaged area to the damaged area.Evaluation of StimulationsBeyond the usual need for quality control in application of a treatment, there is also a need to determinehow well the treatment worked. Although there are a myriad of ways to evaluate a treatment,what is needed most is an accurate assessment of what the well is capable of producing. Secondaryevaluations can then be made to optimize treatment techniques on a basis of money spent versusresults achieved. Difficulties encountered include variations in treatment action resulting from well-towelldifferences of the formation.With the potential limits in mind, the needed data are:1. an accurate assessment of what the well could make,2. accurate knowledge of what the well is producing now,3. the best idea possible of how the treatment affects the well’s performance on a step-wise basis.The third element is often the most difficult to obtain. The most accepted way is use of a simulator thatcombines treatment design with reservoir inflow <strong>and</strong> an economic module to forecast return on investment.The problem is that models usually treat formations as homogeneous; a necessity if the location,size <strong>and</strong> parameters of the formation flow paths are unknown. The only way out of this ignorance(classic lock of information) is to spend the time <strong>and</strong> money to find out what is needed, at least tosome level of satisfaction based on your bank account <strong>and</strong> your patience. Most companies are simplynot willing or able or determine every piece of needed information, hence, assumptions <strong>and</strong> approximationsare what we use.12-3
Selective StimulationThe diversion of stimulation treatments or even diversion of heat during thermal operations requiresthe use of diverting agents or processes to keep the fluid from going entirely into the zone of highestpermeability. Injection of any clean fluid into a formation is analogous with the flow of electricity; bothelectricity <strong>and</strong> fluid flow follow the path of least resistance. Given equal wettability of the pores, thefluid will preferentially flow through the larger pores of the formation where the effects of trapped fluidattractions at the wall are at a minimum. In this type of a system, injection of any fluid into a reservoirwill result in fluid flow into <strong>and</strong> through the easiest penetrated sections. For many reasons, this type ofinjection is not acceptable. To prevent its occurrence, some type of removable diverting process isneeded to evenly apply the treatment volume.Diverting vs. Fluid Loss ControlThe difference between diverting a stimulation treatment <strong>and</strong> establishing fluid loss control on a stimulationtreatment may be very similar in some cases <strong>and</strong> widely separated in others. Practicallyspeaking, diverting consists of allowing some of the treatment volume to penetrate the zone beingdiverted <strong>and</strong> then slowly or rapidly diverting the remainder of the treatment volume to another zone.The usual objective is to evenly treat the entire zone. Diverting is needed for permeability variations ormay be needed to seal off fractures. Fluid loss control is concerned with minimizing the volume of fluidlost from a fracture treatment. Both diverting <strong>and</strong> fluid loss techniques may be used in either matrixtreating or fracture treating <strong>and</strong> in some cases, may use the same materials. For the purposes of thisdiscussion, fluid loss control will concern fracturing’ while diverting will focus on matrix treating.2C<strong>and</strong>idatesMultiple pay zones require diverting since even thin separate zones are rarely of a similar permeabil-Also, multiple treatments in the same single stimulation require the use of diverters for properseparation or fluid loss controL5The permeability variances are typically determined by grain size <strong>and</strong> sorting, mineral growth, bondingof the grains <strong>and</strong> the presence of natural or induced fractures. When a formation is composed uniformlyof a similar size s<strong>and</strong>, without severe mineral growth in the pores, the permeability to a singlesaturating fluid is at a maximum. Poorly sorted formations, those having a wide range of different s<strong>and</strong>sizes, are lower permeability because the smaller grains fill in the open spaces in the matrix aroundthe larger grains. Mineral growths such as clays in the pores also reduce the area open to flow.Pressure within the formation can also dictate the route of fluid movement. Given two separate intervalswith contact to the same wellbore, one may have a much higher pressure than the other, resultingin more difficulty in injecting into the higher pressure zone. If the higher pressure zone has been controlledduring drilling (no crossflow) <strong>and</strong> is controlled by the injection pressure during the treatment,the major injection of fluid will be into the lower pressure zone. The treatment may be very successfulin removing damage, but only in the lower pressure zone. On a buildup test, the well will still appear tobe damaged. The higher pressure zone (possibly the most productive) will remain damaged <strong>and</strong> maynot contribute significantly to flow. A similar problem is realized when two zones are treated <strong>and</strong> onehas been previously stimulated. The previously stimulated zone, especially one in a producing wellthat has been hydraulically fractured, is probably at a lower pressure because of depletion <strong>and</strong> willaccept fluid from the wellbore much more readily than an unstimulated zone.Although the advantages of a more even stimulation treatment are readily apparent (e.g., more completeprocessing <strong>and</strong> drainage of a pay), the advantages of either fluid loss or diverting in matrix treatingcan be overstated, particularly where large permeability variations exist. In normal operations, thevariance in permeability that can be easily treated by a diverting agent are about one order of magnitudeof permeability lower than the highest permeability section of a well. This means that if the maximumpermeability is 100 md, then the lowest permeability zone that can be effectively diverted to witha large amount of fluid is about 10 md unless complete fluid loss control is established in the highpermeability zones. By using extremely efficient diverting or fluid loss materials (e.g., mechanicaldiverting in a well with a good cement job <strong>and</strong> no fractures), it is possible to slowly drive fluid into12-4
lower permeability sections. However, pay zones with permeabilities varying over two orders of magnitudeare rarely known to contribute from the zones of the lowest permeability before the highest permeabilityzones are depleted. This phenomenon has been proven in several areas of secondaryrecovery operations where 20-year old waterflood patterns (40-acre spacing) have been drilled in anin-field drilling operation <strong>and</strong> virgin pressures were found in the middle of the pattern in the lowest permeabilitypays. In this example, the permeability variation was from about 50 md to less than 1 md.These wells had been repeatedly treated with diverted <strong>and</strong> undiverted stimulation treatments. Theseprocedures made little difference in the low permeability sections in the 40-acre spacing.Diverter OperationThere are several types of diverters, techniques for diverter usage, <strong>and</strong> various kinds of mechanicalapparatus that control fluid flow or fluid pressure within a wellbore. The diverters are described bywhether the diverter is mechanical (a downhole tool) or chemical.Limited Entry (Pressure Differential Diverting)Limited entry is the act of placing only a few perforations in the pay. With the limited entry technique,several pays may be treated in one operation.6i7 The process may be accomplished by using balls instages to seal off perforations after stages of a treatment or by using back pressure developed by flowthrough a limited number of perforations. When using back pressure, the pays are perforated with thehigh permeability zones receiving only a few perforations <strong>and</strong> lower permeability zones being shotwith several perforations. In this manner, each zone is forced to take a share of the total fluid. Thisprocedure has some special applications in single treating of several stringers of a formation: however,the limited number of perforations may create high perforation friction (800 to 1500 psi differentialpressures are often necessary for effective operation). In some treatments, the horsepowernecessary to overcome the perforation friction will be about 30 to 50% of the total horsepower used onthe job. For comparison of pressure drop, the flow rates through perforations at various pressures are-12-5
presented in Figure 12.1. Flow from the reservoir into the wellbore is also restricted in limited entrycompletions <strong>and</strong> the well may appear to be damaged.8s9IA0 .. DcP90.4367(Scott et al.)Figure 12.1: A nomograph method of determiningperforation induced friction.Mechanical DivertingIf a rig is available or if coiled tubing can be used, packers <strong>and</strong> selective injection wash tools oftenpresent the best method of matrix stimulation diversion, provided that the cement job is adequate toisolate the annulus <strong>and</strong> the well is not fractured. Most mechanical diverting tools are severely limitedbecause they function only at the face of the formation.lo Fractures, high permeability streaks <strong>and</strong>even channels in the cement will defeat mechanical attempts to divert fluid flow.The mechanical diverters include selective injection packers, packer <strong>and</strong> plug sets, <strong>and</strong> other isolationtechniques that protect a section of the well from fluid pressure. The selective injection packers orstraddle cup packers isolate a section of perforations for <strong>and</strong> makes sure at least one of the perforationsin the straddled interval is open. The first requirement of mechanical methods is that the cementsheath must be in good condition so that fluids do not channel behind the pipe. The benefits ofmechanical methods include positive opening of perforations <strong>and</strong>, usually, effective breakdown of theformation. The process is particularly suited for small volume treatments. The tools can be obtainedwith almost any length of perforated tubing between the isolation cups or packers. As little as 2 in. oras much as 50 ft or more may be built into the apparatus at the surface.12-6
Disadvantages to the process, besides the required use of a rig, are leaks produced by wear on thecups <strong>and</strong> seals during multiple sets of the packer <strong>and</strong> the density segregation of different fluids in thetubing at very low pump rates. Wiper plugs to separate fluids are useful if there is enough room in theperforated tubing to catch the plugs without restricting fluid flow.Isolation packers are the most versatile mechanical diverting devices because they can be used <strong>and</strong>reset numerous times on the same run. The packoff seal is provided by cup seals, Figure 12.2, orpacker elements, Figure 12.3. Cup packers allow faster sets <strong>and</strong> higher flow rates while hydraulic setpackers allow better seals inside the wellbore. Packer <strong>and</strong> plug sets, Figure 12.4, are a commonapproach to separation of multiple zones where a fracture stimulation is planned.1 nuRRlAFlR 1temain open Mile running in.Ikve valve is jayed inocked closed position. Fluidumped into annulus will flowE rouah annular bvpass oflength of tool. -’(Baker)Figure 12.2: Schematic <strong>and</strong> operational sequence of a packer using cup seals.IThrough tubing bridge plugs are devices that can be run through a tubing string on a wireline <strong>and</strong>opened in the casing below the tubing to provide a place to start a cement or s<strong>and</strong> plug.” A fewthrough tubing plugs are marginally effective without added s<strong>and</strong> or cement. The plugs are usually ofthe petal basket, corrosion resistant fabric skin (resembles up-side down umbrellas) <strong>and</strong> bag typedesigns. Plugs are set with wireline with from one to four or more runs required to set a plug. Cementis then applied with a bailer. The limits on through tubing bridge plugs are dependent upon the design<strong>and</strong> materials of construction. Models of the plug are available with vents <strong>and</strong> some, such as the bag<strong>and</strong> fabric covered basket can be used in highly deviated wellbores. Inflatable plugs for both wireline<strong>and</strong> coiled tubing application are currently available. These plugs will hold some pressure differentialbut are a good base for s<strong>and</strong> or cement.Ball sealers are a special method of controlling fluid flow.I2 These are small vinyl rubber covered ballswith a neoprene or syntactic foam center. The balls come in various densities <strong>and</strong> are designed toplug a perforation that is taking fluid. By dropping several balls at once, a section of pay may be iso-12-7
Figure 12.3:(Scott et al.)Selective injection packer usingcompression extended elements.lated, allowing the next section treated without closing off part of the wellbore. The limitations, like themechanical devices, include the necessity of a good cement job. Additional requirements are round,burr free perforation entry holes that will provide a good seal with the pipe. Also required is a littleunderstood quantity called “ball action”. “Ball action” refers to the ability of the ball to flow to <strong>and</strong> seaton a perforation. The more fluid that a perforation is taking, the more likely the chance to seat a ballsealer. For this reason, a well with a few perforations is easier to “ball off than a well with many perforationsthat are taking the same quantity of fluid.To travel with a fluid, the ball must be kept in suspension with the part of the fluid that is movingtowards the Perforation. Density differences between the ball <strong>and</strong> the fluid are the major reason forseparation. Density differences of as little as 0.05 (gramskc) are sufficient at low liquid flow velocitiesto allow the ball to sink into the rat hole or float up <strong>and</strong> remain under the packer. For best application,the fluid should be in turbulent flow or the density of the ball should match the density of the fluid. Aflow rate sufficient to keep the ball suspended with the liquid in the tubing will probably be too slow tokeep the same ball suspended in the same liquid in the casing unless the density of ball <strong>and</strong> fluid arethe same. Although the flow rate will be the same, the velocity in the casing may be lower by a factorof 6 to 10 than in the tubing. This reduction in velocity is often enough to allow the balls to separatefrom the fluid. To overcome the loss mixing in the casing, the density of the ball should be as close toneutral as possible (within 0.05 g/cc). An example would be using a 1.1 g/cc density ball in 15% HCI(density = 1.145 g/cc).The rate of fluid flow into the perforation controls the attraction of a ball. The inflow of fluid sets up avortex around the entrance hole, which aids in attracting solid particles such as ball sealers. Althoughexperiments have shown that a little as 0.05 bbl/min is necessary to seat a ball sealer, the chances ofattracting <strong>and</strong> seating the ball increase with the flow rate into the perforation.12-8
(Clementz et al., 1982)Figure 12.4: An example of an isolation techniqueusing a retrievable packer <strong>and</strong> a retrievablebridge plug.The final factor in ball action is the number of shots per foot that are open to fluid flow. The best ballaction is seen when there are few holes in the section, forcing a high rate of fluid injection into theopen perforations. This maximizing of flow contrast increases the flow velocity into the perf <strong>and</strong> thusthe vortex around the perf. Most operators that use ball sealers successfully perforate at one shotevery other foot up to a limit of 4 shots per foot depending upon the permeability of the formation. Athigher permeabilities, usually over 100 md, the higher number of shots per foot can be used. At anygiven permeability, as the number of shots per foot goes up, the success with balls goes down. Guidelinesfor use of ball sealers are shown in Figure 12.5.A second velocity factor affecting balls is the downward component of velocity during pumping at highrates <strong>and</strong> especially with balls that are significantly heavier than the treating fluid. If the end of the tubingis spotted just above the perforations, a heavier ball will tend to retain the downward velocity of thefluid <strong>and</strong> be carried into the rat hole. Spotting the tubing 40 to 100 ft above the top of the perforationswill allow the balls to spread out <strong>and</strong> slow to the velocity of the fluid in the casing.Once the ball has been seated on the perforation there is little problem with the ball popping-off aslong as treatment pressure is toward the formation. Even high velocity flow immediately past the ballwill not dislodge the ball from the perforation.The number of balls which are necessary to treat a pay zone depend upon the number of open perforationsplus some excess number of balls. Estimates on number of balls needed for a successful operationrange from 30% to 100% in excess of the number of perforations.The balls are dropped in sets of one to a more than a dozen in most operations <strong>and</strong> are intended to“ball-off’ a section of perfs that are taking fluid <strong>and</strong> divert the injection to other perforations. Injectionof ball sealers into the treating fluid is done on the high pressure side of the pump through ball injectors.The best devices for ball injection are the positive displacement rod or plunger units. Star-wheel12-9
Completion Length(perfed interval)Remarks on Use of Straddle Packers for DivertingO-20ftGood petformance with spacing on 1 ft tor breakdown. Spacing on 1 to 3 ft foracidizing or solvent inj.20-100ftSpacing on 2 to 4 ft for breakdown or injection.> 100 ftSpacing 4 to 10 ft for injection. Perf breakdown less effective because of largespacing. Number of sets per trip should be less than 50. Cup or seal life isshortened by burrs around the perforations.Perfs per ftRemarks on Use of Neutral Density Ball Sealersc1 to2Best results from ball sealers. Use minimum 30% excess balls. Petformancelessened by low perm, heavy balls, or low injection rate. Best results occurwhen injection rate divided by the number of perforations is no more than0.05 bbl/min/perf.3 to 4Marginal performance. Use 100% excess balls. Balls will not work well at thisshot density in low permeability formations.>4Ball sealers are not recommended.IBuoyant ball sealers with a density less than the carrier fluid are not recommended unless an interfacetreatment is used.Ball sealers heavier than 0.1 g/cc over the density of the carrier fluid are not recommended.Figure 12.5: Selection Chart for Selective Injection PackerlBall Seal-devices that depend on gravity feed of the ball to the slots in the wheel are less reliable <strong>and</strong> are notpractical for buoyant ball sealers.Selection of the ball is usually confined to picking the density, although some size variation may alsobe possible. The common ball sealer size is 7/8" diameter. Although this size is adequate for most0.25" to 0.5" entrance holes produced by deep penetrating charges, the 7/8" balls are too small to beused in the 0.75" to +0.9" holes produced by big hole charges with optimum casing/gun clearance.Ball sealers also should not be used in most wells that have been reperforated, particularly if both perforatingguns were zero degree phased. Ball sealers should not be used after a large volume proppantfrac because of possible casing hole enlargement by abrasion the pr~ppant.'~In tests with tubing spotted above the perforations, the buoyant ball sealersl4 performed very poorly inselectively shutting off perforations when used in a single fluid treating system with the packer setimmediately above the perforations. The buoyant balls (0.9 <strong>and</strong> 0.95) floated past perforations takingas much as 0.1 BPM. Even when the ball entered the vortex created by the perforation flow, there wasonly a small chance of seating the ball. Once the balls were seated, there was no problem keepingthem on the perforation as long as flow was maintained. Whenever the pump was stopped, the ballsimmediately came off the perforations. As the hole diameter increases from the norm of 0.4" toward0.6" or larger, the st<strong>and</strong>ard 0.75" or 0.87" balls may become wedged in the hole.Heavier density balls are commonly used in fracturing operations where a very large amount of mixinggoes on <strong>and</strong> flow rates are extremely high. Ball densities from 1.1 to 1.3 are available. Some operatorsfeel the heavier weights are necessary to prevent the balls from flowing back to the surface oncethe treating pressure has been released <strong>and</strong> the well comes back on flow.When the well flows back after a treatment with either lightweight ball sealers or neutral density ballsealers, a ball catcher should be installed in the line to assist in catching the balls prior to flowing thewell fluids through the choke. A device of this type is shown in Figure 12.6.1512-10
(Gabriel & Erbostoesser, SPE)Figure 12.6: A ball sealer catcher to prevent choke blockage.Chemical DivsrtersThe chemical diverters include a wide range of products that are designed to work in one of threemethods; filling the perforation, sealing the perforation, or promoting diversion by means of viscosity.The fill-type diverters, which include such materials as naphthalene, benzoic, graded salts, s<strong>and</strong>, <strong>and</strong>other large particulate material are designed to completely fill the perforation tunnel <strong>and</strong> create a secondpack within the tunnel that will divert the flow of fluid into the formation. A sketch of fill diverteroperation is shown in Figure 12.7. The flow of fluid into the perf is not completely stopped, but thetreating pressure is raised by resistance of flowing through the fill in the perforation tunnel <strong>and</strong> thetreating fluid may be diverted to another perforation. Diversion with this type of a product is possibleeven where the permeability of the diverter system is higher than the permeability of the formation,since the area of the perforation has been reduced from the perforation tunnel wall area to theentrance area of the perf. These types of diverters do have a lower limit on the formation permeabilityat which they are effective. The permeability of the Yill” matrix must act as a restriction in the amountof flow that a perforation will take. In very low permeability, non-naturally fractured formations (k c 10md), these diverters will not work well since the permeability of the diverter pack will still be muchhigher than the permeability of the formation. The exception is natural fractures that open wider attreating pressure. The approximate effective permeability limits for various diverter packs <strong>and</strong> an estimationof where they are effective is contained in Figure 12.8. Loading information for the number ofpounds per gallon <strong>and</strong> pounds per perf is also reported. This data was established using a laboratorymodel of the flow system <strong>and</strong> takes into account the approximate permeability of the formation. Examplesof the rate of fluid flow reduction for 100 mesh s<strong>and</strong>, granular salt, benzoic acid <strong>and</strong> naphthaleneare shown in Figure 12.9.16 Note that the final fluid flow after treating is not zero. The data shown inthe figure demonstrate that the larger particulate diverters all have a “pack permeability’’ that allows areduction in fluid flow into a zone but does not stop the flow entirely.The second type of chemical diversion is forming a seal on the face of the formation. The diverters inthis category include organic resin dispersions <strong>and</strong> particulates up to 10 to 70 microns. The permeabilityof the barrier created by these materials is nearly zero. These materials are most effective onmatrix fluid loss from either matrix or frac treatments but lose effectiveness when the formation is naturallyfractured. The products form a thin seal, Figure 12.10, by trapping of the micron-sized solid particlesagainst the permeable face of the formation when the liquid enters the formation. The organicresin slurry uses oil soluble, organic material in a water suspension to form a “mud-cake” or seal onany surface where fluid injectionLike any fluid leakoff control additive, the speed withwhich resin products can control leakoff is dependent upon their concentration, Figure 12.11 , <strong>and</strong> theamount of leakoff. The barrier or dehydration cake (similar to a mud cake) formed is very thin butimpenetrable to flow toward the formation. A density of 1.04 g/cc allows easy placement without separationproblems. The drawback with the organic resin slurries are that they are concentration <strong>and</strong> sur-12-11
Diverter 1Figure 12.7: Diverting with a fill type diverter. Although the diverterpack has a higher permeability than the formation, a flowresistance can still be created since the exposed area ofthe diverter filled perforation is much smaller than theexposed area of the open perforation.As formation permeability decreases, the effect of fill typediverting is lessened.I 1 IDecompositionConcentrationSolubleo;;;/T 2; In UseI'Not suitable"Will not fill a perforation, acts only on or in matrix of formationI "'May be only marginally effective at best.I I 1 I114 to 1112 to 1114 to 10.032 to 0.1*...Figure 12-8: Guidelines for Diverter Usage in Non-Fractured Formations.*1 to 2.5112 to 5 gal fluidper 1000 gal fluid114 to 10 Ib per1000 gal fluid10 to 30 Ib per1000 gal fluidface area dependent <strong>and</strong> do not work exceptionally well in fractures (where the surface area that mustbe sealed is extremely large).The diverter should not be readily soluble in the liquid being used for transport. <strong>Oil</strong> base diverters suchas most organic resin dispersions, for example, cannot be used in acid containing mutual solvents. Inthese cases, an inert carrier fluid should be used for the diverter stage carrier. Clean up of the resinbarriers normally proceeds easily since almost all of the material is halted at the face of the formation<strong>and</strong> the layer of resin will not hold pressure when the differential is from the formation toward the well-12-12
(<strong>King</strong> & Hollingsworth, SPE 8400)Figure 12.9: Flow reductions (in s<strong>and</strong> packs) possible with various diverters.(<strong>King</strong> & Hollingsworth, SPE 8400)Figure 12.10: Photograph of the barrier formed by dehydration(by leakoff) of organic resin slurry whileflowing water through a s<strong>and</strong> pack.bore. Most of the organic resins are soluble in either condensate or crude oil <strong>and</strong> will be removed relativelyeasily from the surface of the formation. A second type of small particulate solid that may beused as a slurry contains inorganic material. The micron sized inorganic particulates will damage theformation to some extent <strong>and</strong> their clean up depends on either removal by reverse pressure or slowdecomposition of the inorganic particle. Caution is advised in using this type of a product.When naturally fractured formations are treated, a particle type diverter followed by or mixed with a filtercake type diverter should be considered if complete shutoff of the zone is necessary.12-13
- 54HUIYUz3 a8EW54 YIGH PERMEABILITY RANGEM1 gaL/1,000 gal. ‘U10 gal R, #y) gaLloo05 gal. Il, WO gal.1 TOTAL VOLUME WATER T~ROUGH PACK (cc’s)0 60 120TOTAL VOLUME WATER THROUGH PACK (gallwrtlft.4(<strong>King</strong> & Hollingsworth, SPE 8400)Figure 12.11: The fluid leakoff control provided by organic resin slurriesis dependent on resin concentration as shown in thepilot. Note that the concentration affects only the speedof leakoff control, not the shutoff potential.Viscous gels are a third method of diverting that can be effective in the wellbore, on the face of the formationor in the formation. The viscous gels that are available at the current time, are usually polymer19v20or surfactant gelled waters or foams.21 They make injection of the fluid into the zone moredifficult because of the viscous fluid’s resistance to flow. By consideration of the Darcy Law, one onlyhas to increase the viscosity of a fluid from-one to 100 centipoise, for example, to see that these fluidsradically reduce the amount of fluid lost to the formation. Drawbacks to the viscous polymer fluids arethe insoluble debris that are in most polymer systems <strong>and</strong> the residue remaining after breakdown.Cleanup of deeply placed polymer systems can also be slow unless a properly functioning breaker isused.Foamed systems, where a gas phase is dispersed in a liquid phase, diverts by being difficult to flowthrough the f~rmation.~’-~’ <strong>Gas</strong>-in-water foam is an emulsion <strong>and</strong> are more viscous than the unviscosifiednormal treating fluids. At least part of their resistance to flow comes from a process governingdroplet or bubble deformation, known as the Jamin effe~t.2~ This effect describes the difficulty in forcingthe droplet or bubble to deform sufficiently to flow through the pore, Figure 12.12.It is not unusual to see a combination of two or more of the described systems or products to achievebetter fluid loss control, especially where formation permeability variances are large.2426The carrier fluid for a chemical diverter is of prime imp~rtance.~~ The carrier fluid must be inert to theproduct <strong>and</strong> should not modify the size of the product. In most stimulations the diverter or fluid lossadditive must be carried by the treating fluid. This adds another limit to the selection of the diverter.interface TreatmentsThe interface technique is a procedure for directing placement of fluids or divert er^.'^ This processuses a heavy fluid <strong>and</strong> a lighter, normally immiscible fluid. A brief list of the fluid densities available forthis work is shown in Figure 12.14.12-14
- w-HIGHq-PERM EABl LlTY4Water WaterWater +LOW PERMEABILITY(Penny)Figure 12.12: Mechanism of fluid loss control during an immiscible phase injectionDiverters or ball sealers with a density between the two fluids may also be used. If a diverter is used<strong>and</strong> the density of the two fluids are selected correctly, the diverter must be localized at the interfaceof the fluids. The treatment can be used with or without tubing in the well when immiscible fluids areused, although the control of the interface is made easier if the tubing is spotted through the zone tobe treated. When the tubing extends through the zone, the position of the interface in the annulus canbe controlled by injecting heavier fluid into the tubing <strong>and</strong> lighter fluid into the annulus.The position of the interface may be monitored by the use of a gamma ray tool in the tubing if theannular fluid (upper fluid) is tagged with a tracer that is not soluble in the second fluid.The position of the interface does not identify the injection site of the fluid unless injection rates intoboth annulus <strong>and</strong> tubing are equal <strong>and</strong> there is only one zone taking fluid. If only one of the fluids isbeing injected, <strong>and</strong> the other side shut in, the position of the interface only signifies that injection intothe reservoir is taking place either above or below the interface depending on which fluid (annular ortubing) is being injected.DiverterlFluid Loss Control StagesPlacement of the materials within the treating volumes of a stimulation treatment requires informationon the extent of leakoff into the formation at vmious times. In an acid fracturing treatment, the use offluid loss additives must occur early <strong>and</strong> frequently during the job for an optimum operation. Acidincreases the permeability of the formation by reaction <strong>and</strong> thus increases both the number <strong>and</strong> theseverity of fluid leakoff sites. To produce deeply penetrating acid fractures, initial acid leakoff must bestopped <strong>and</strong> all subsequent deterioration of the fluid loss additive on those sites must be minimized.Acid fracturing requires more fluid loss control than a fracturing treatment or other type of non acidstimulation. In stimulations that use acid, the fluid loss additive is added on a regular basis either inclosely spaced stages or continuously in small quantities.Placement of the stages is often done without much formation information <strong>and</strong> normally accounts for awaste of a large amount of the treating volume, especially in the later part of the job. The optimumplace for a stage in an acid fracturing job is when the bottom hole injection pressure begins to declineduring a steady rate treatment. In fracturing, this pressure decline is most often caused by a reductionin back pressure <strong>and</strong> signals a reduction in the amount of fluid traveling down the length of a fracture.This indicates leakoff (usually severe) through the walls of the fracture.In matrix acidizing, the diverter stage should be pumped when the acid causes a reduction in injectionpressure by increasing the permeability (or removing damage) in the zone into which it is flowing. Thispressure reduction may often be seen on the surface pressure recorder as a slow decrease followedby a stable pressure when the damage has been removed. The diverter stage should be pumpedwhen the pressure begins to decline; this will allow the acid in the tubing to continue going into the12-15
FluidPressureUnit DepthDensityFigure 12.14: Gradients <strong>and</strong> Densitiestreated zone to finish the cleaning job <strong>and</strong> then divert the next volume of acid to a new zone. If thediverter is properly selected <strong>and</strong> placed, the surface pressure should rise slightly as acid is injected ina damaged zone then decline as a new interval is cleaned up.Practically, <strong>and</strong> especially in deep wells, this method of treating is difficult due to the large volume ofacid in the tubing <strong>and</strong> the slow rate of displacement. The best method of designing diverter stages for12-16
these deeper wells is to examine treating reports <strong>and</strong> pressure charts of jobs on offset wells or wellswith similar damage conditions. Select volumes for acid stages which approximate the quantity of acidneeded to reduce the injection pressure. The quantity of diverter <strong>and</strong> the volume of diverter stage maybe selected by examining treating reports to see if the diverter stages were effective. To place thestages in the exact spot in the treatment where fluid loss control is needed would require advanceknowledge of the exact leakoff behavior of the formation. This information is not available for any butthe most homogeneous formations. The position of the first stage in the job may be approximated byexamining the treating records of an offset well. In wells with damage, there may not be enough consistencybetween wells to make this process useful.If the well is shallow <strong>and</strong> the injection rate is high or the treatment is fairly large, the surface pressurecan be monitored to know when to start a stage. An illustration of this technique is shown inFigure 12.1 5. This example dramatically shows the fluctuation of injection pressure <strong>and</strong> fluid loss in afracturing well. It is interesting to note that the 100 mesh s<strong>and</strong> used as a fluid loss control in this examplehas a pack permeability of 200 to 800 md, yet is able to reduce leakoff through open natural fracturesin a formation with a matrix permeability of 1 to about 15 md. The effective contrast is betweenthe fracture flow capacity <strong>and</strong> the s<strong>and</strong> pack, not between the s<strong>and</strong> pack <strong>and</strong> the formation.\ fhlfllYG F01YA1101: -ACIDI---?ADI1I\IE A U PAD STAGECONSISTS Of 1000CA1 WITW 1 ))( fllfIfSH SAND EACH ACIDSIACE. 1500 SAL~ ~ ; ; ; o I o ; 15 r ao ' as ' 40 ' ' 41 ' 'TIYI. IlNUltSYI(Coulter et al., SPE)Figure 12.15: Plot of bottom-hole pressure change during constant pump ratetreatment of Strawn Reef Formation.HCllHF Treatment DiversionHCI/HF treatments pose a special problem for diverting since in most cases, an HCI preflush isneeded prior to the HCI/HF acid injection. If the HCI is not ahead of the HCVHF acid in each zone itenters, damage from reaction of HF with calcium carbonate (results in CaF2, a precipitate) or formationwaters may occur. The easiest <strong>and</strong> most effective way to divert HCVHF jobs is to treat each stageas a separate treatment. The HCI <strong>and</strong> HCVHF acids are followed by a stage of 2% NH4CI water with afluid loss additive. Salt should not be used as a diverter in HCI/HF acid, because it will create asodium fluoride precipitate.RecommendationsThe suggested loading rate of diverter materials for matrix operations were shown previously. Theseloading rates are only a guide; actual use may have to be tailored to achieve optimum performance.Very large (over 1 Ib/gal) loadings of flake diverters should be avoided due to potential bridging problemsin the tubing.The common diverters are listed in the Appendix 12.A.12-17
CleanupRegardless of the type of material that is injected as a fluid loss or diversion additive, very carefulthought must be given to cleaning the material from the formation or the fracture pack.28 If the materialcannot be removed easily during the course of the well clean up, much or all of the advantages producedby the stimulation will be completely lost. Common solvents are available for almost all of thecommercially available diverters <strong>and</strong> fluid loss additives used in well stimulation.Cleanout of diverters from the well is often best accomplished by backflow at high pressure differentialsor extended production. In tests on drilling mud <strong>and</strong> diverters on s<strong>and</strong>stone cores it has beendetermined that approximately 80% of the initial permeability is usually attained when the core wasbackflowed at a pressure differential at least equal to the pressure used to place the mud or diverter.Final cleanup may depend on the diverter used <strong>and</strong> the type of overflush. In most cases, the overflushshould be a solvent for the diverter.The worst problem encountered in removal of fluid loss control additives is in the drilling additives.Lost circulation material (LCM) has been a historic problem because of drillers’ insistence on usingcheap materials to control fluid loss sites. In non pay sections the removal of these materials is of littleimportance; however, when the fluid loss zone occurs in a pay, additives such as paper, leather, grain,plastic, or other insoluble materials absolutely should not be used. Techniques for control of the mostsevere fluid loss zones are a~ailable.~’Packoff TechniquesPackoff techniques are normally used to isolate producing perforations from a treatment on other perforationswhere bridge plugs <strong>and</strong> other mechanical devices are impractical. These packoff techniquesinclude particulate fill <strong>and</strong> gelled plugs.Crosslinked gelled plugs of several thous<strong>and</strong> centipoise viscosity are typically high concentrationpolymer pills at a loading rate of 100 Ibs or more of polymer per 1000 gal of water. The polymer ispumped with a time or temperature delay crosslinker that will render a solid plug. The polymer systemcan be stabilized for long time stability. Problems with the gelled plugs have been with failure of breakingsystems <strong>and</strong> cleanup of residue. Bacterial degradation may also be a problem.Technology of BridgingThe size range of particles necessary for control of fluid entry into a formation will depend on the poresize range or fracture size in the formation. Data from gravel packing studies has shown that spherescan be bridged on an opening twice their diameter.30 In other tests, particles as small as 1/3 the openingdiameter may rapidly form bridges on an opening. In large particle concentrations such as s<strong>and</strong>slurries, bridging may even occur with particles as small as 1/6 the opening diameter. In general, thelarger the particle, the faster the bridge is formed <strong>and</strong> the more stable it is. Use of polymer gels totransport the particles or a second bridging material may also have an effect on bridging3’ As particlesize decreases in relationship to opening size, the ease of forming a bridge also decreases. Morerapid bridging can usually be achieved when a wide range of sizes are used. The larger particles willbridge off on the opening <strong>and</strong> the smaller particles will bridge off on the remaining openings betweenthe large particles <strong>and</strong> the original opening. This analogy works for pores or natural fractures.Depth of DiversionOnce the fluid enters the formation, regardless of the point of entry, the path of the fluid will be thepath of least resistance. The natural tendency will be to flow toward the region of lowest pressurethrough the most permeable path available. For this reason, the near wellbore is most affected by theaction of the diverter. Without barriers to flow between the high perm <strong>and</strong> lower perm areas, mostdiversion attempts will simply open new channels of permeability from the affected perforations to thezone of highest perm.12-18
Chemical Stimulation TechniquesAcidizingOf the four most widely used acids, hydrochloric acid (also referred to as muriatic) is the most importantdue to its high carbonate dissolving capacity <strong>and</strong> low cost.Hydrochloric acid reacts with carbonate formations to form water, carbon dioxide gas, <strong>and</strong> calciumchloride, as shown in the following schematic.HCI Acid + CaC03 Limestone -+ w2°Water + CO2 Carbon Dioxide+ CaC12 Calcium ChlorideAt bottomhole pressures, the CO2 produced is dissolved in water <strong>and</strong> remains trapped until the pressureis lowered.One thous<strong>and</strong> gallons of 15% HCI acid will dissolve 1840 Ibs of limestone (10 cubic ft3 if porosity =O).32 The products formed are 2000 Ibs of calcium chloride, 8010 Ibs (6600 st<strong>and</strong>ard ft3) of carbondioxide gas, <strong>and</strong> 333 Ibs (40 gallons) of water. The total volume of water remaining after completespending of the acid would contain 15% (by weight) calcium chloride. Limestone dissolved by 4 m3 of15% HCI would be 884 kg with 961 kg calcium chloride, 187 m3 CO2 at st<strong>and</strong>ard conditions <strong>and</strong>160 kg (0.15 m3) water produced.The reaction for dolomite is similar to the reaction for carbonate, but slower at temperatures of under200°F (93°C).HC1+ MgCa (CO,) , 'H,'O + CO, + CaCl, + MgCl,Acid DolomiteWater Carbon Calcium MagnesiumDioxide Chloride Chloride<strong>Gas</strong>The reaction of 1000 gallons of 15% hydrochloric on dolomite would consume 1700 Ibs of rock (9.6 ft3if porosity = 0) <strong>and</strong> produce 1000 Ibs calcium chloride, 870 Ibs magnesium chloride, 6600 st<strong>and</strong>ard ft3of carbon dioxide, <strong>and</strong> 40 gallons of water. Dolomite dissolved by 4 m3 of 15% HCI would be 817 kgwith 480 kg calcium chloride, 41 8 kg magnesium chloride, 187 m3 CO2 at st<strong>and</strong>ard conditions, <strong>and</strong>160 kg (0.1 5 m3) water produced.As better inhibitors have been developed, the higher concentrations of hydrochloric acid have comeinto greater use. The use of 28% HCI for fracturing provides about twice the dissolving capacity at lessthan twice the cost of 15% HCI. The 28% HCI is normally used for acid fracturing in carbonates.Although HCI reacts readily with the calcium <strong>and</strong> magnesium carbonates, other acid reactions occurduring the treatment that can create damage if not anticipated. Iron, contained in such forms as rust,pyrite, pyrrhotite, siderite, magnetite, <strong>and</strong> hematite, is a prime problem reactant with HCI because ofthe possibility of iron hydroxide precipitation from spent acid. Normally, only magnetite <strong>and</strong> hematite(+3 valence states) are troublesome since they precipitate at a pH of 2.2; however, the other iron compounds(+2 valence states) can also precipitate if the acid spends completely (pH 2 7) Before selectionof an iron sequestering agent, a good underst<strong>and</strong>ing of the iron precipitation problem should beacquired. Other possible reactants with HCI include iron sulfide (a corrosion product present on tubularsin sour gas areas) <strong>and</strong> HCI-soluble scales <strong>and</strong> clays.12-19
HWHF: HCI/HF is a mixture of hydrochloric <strong>and</strong> hydrofluoric acids. This combination is used exclusivelyin s<strong>and</strong> reservoirs that contain very little calcium. Acids containing hydrofluoric are not used incalcium containing reservoirs since one of the reaction products, calcium fluoride, is a precipitate.HF + CaCO, + CaF, + H,O + CO,Hydrofluoric Calcium Calcium Water CarbonAcid Carbonate Fluoride DioxideThe calcium fluoride is an insoluble product <strong>and</strong> cannot be removed with normal treating processes.To minimize harmful by-products when designing an HCI/HF acid stimulation, it is necessary to use ahydrochloric acid preflush <strong>and</strong> a gas, HCI acid, ammonium chloride water, or hydrocarbon afterflush.In dry gas reservoirs or elsewhere that oil would create relative permeability effects, the HCI/HF acidshould be followed by ammonium chloride water or gas. HCI/HF acid treatments should not be precededor followed by waters weighted with sodium chloride, calcium chloride, or potassium chloride.These salts, although relatively inert, can react with any unspent hydrofluoric acid to form insolublefluoride precipitates. A water solution of ammonium chloride can be used as a preflush or afterflush forHCVHF acids without creating insoluble by-products.In formations where the calcium content is low (i.e., less than 1 O%), a preflush of hydrochloric acid isrequired to remove the calcium which is in the pore throats. In formations of over 15% calcium compounds,HCI/HF acids should not normally be used.The reaction schematic for HF on an idealized clay is shown below.HydrofluoricAcidHF + A1,Si,'0,6(OH), + H,Si'F, + AlF, + H,'O"Clay"Hexafluro Aluminum WaterSilicic FluorideAcidThe most common concentration of HCVHF is 12% HCI <strong>and</strong> 3% HF. In formations that can be damagedby HF by-products, half strength HCVHF, 6% HCI <strong>and</strong> 1.5% HF, is popular. HF acid spends rapidlyon clays <strong>and</strong> silts. In formations containing 10% clays, the HF acid will probably penetrate nofurther than about 8 in. from the wellbore <strong>and</strong> removes approximately 120 Ib (54.5 kg) of clay per1000 gallons of the HCI/HF mix before being completely spent. If damage due to clay or to completionfluids extends deeper than the live HCI/HF acid can reach, it is advisable to consider an in situ HF acidor a fracture treatment with proppant <strong>and</strong> water or oil-base fluid. HCI/HF is also veryuseful for removing drilling mud cakes <strong>and</strong> dispersing mud.HF Acid Spending RatesRecently, work by Gdanski has illustrated potential problems with HCI/HF by-products when zeolites(a reactive mineral) <strong>and</strong> a few other, highly reactive clays or minerals are encountered. In the work,Gdanski shows that aluminum from the minerals precipitates as the acid spends (pH rises). The precipitationseems to be affected by both the aluminum concentration <strong>and</strong> the pH: themselves a functionof HF acid content <strong>and</strong> total acid content, respectively. To minimize potential precipitation <strong>and</strong> formationdamage, the HF content is reduced <strong>and</strong> HCL is increased when acidizing some formations. Typicalof the acids is an 7-1/2 to 10% HCL with a 1% HF.Acetic <strong>and</strong> Formic: Organic acids are used in stimulations where their slower reaction time <strong>and</strong> easeof inhibition are required. The acids most frequently used are formic <strong>and</strong> acetic. The carbonate dissolvingcapacity of the 10% organic acids is regulated by a reaction equilibrium between the reactants,the product CO2 "gas" <strong>and</strong> the pressure. At pressures of over 500 psi, <strong>and</strong> up to about 1 60°F,10% acetic will dissolve approximately 420 Ibs of calcium carbonate per thous<strong>and</strong> gallons(202 kg/4 m3), while the 10% formic will dissolve roughly 750 Ibs of calcium carbonate per12-20
~1000 gallons (360 kg/m3). At atmospheric pressure, the 10% acetic will consume 740 Ibs of calciumcarbonate per thous<strong>and</strong> gallons (355 kg/4 m3) <strong>and</strong> the 10% formic will dissolve 940 Ibs of calcium carbonateper 1000 gallons (451 kg/4 m3). Since the spending rate of the organic acid <strong>and</strong> total materialconsumed is controlled by an equilibrium with temperature <strong>and</strong> pressure as two of its controls, liveacid will usually be returned to the surface following a treatment with organic acid (especially at temperaturesbelow 160°F).On a basis of cost per Ib of carbonate dissolved, the acetic acid is roughly five times the cost of thehydrochloric, while the formic acid is about three times the cost of HCI acids. In high-temperature formations,the cost factor between organics <strong>and</strong> HCI acid narrows due to the cost of special inhibitorsnecessary for HCI acids at high temperatures.Formic <strong>and</strong> acetic acids are not normally used at over 15% strength due to solubility limits of calciumformate or calcium acetate, the chief byproduct. The reaction schematic of formic acid is shown below.HCOOH + CaCO, + Ca(COOH), + CO, + 'H,'OFormic Limestone Calcium Carbon WaterAcid Formate DioxideThe reaction of acetic acid is similar except calcium acetate is formed instead of calcium formate.Although the organic acids may be used by themselves for stimulation at high temperatures, it is oftenadvantageous to use the acids in a mixture with hydrochloric acid.SolventsSolvents cover a broad range of materials that dissolve <strong>and</strong> disperse deposits <strong>and</strong> damage problemsin the well. The most common solvent is fresh or brine water, used to remove salt, or as a base fluid tocarry surfactants, alcohols, mutual solvents <strong>and</strong> other products. Alcohols are a special class of solventssince they have solubility in both oil <strong>and</strong> water. Hydrocarbon solvents are also used with regularity.35-38These materials include crude oil <strong>and</strong> condensate, plus refined oils such as diesel, kerosene,xylene <strong>and</strong> toluene. The reasons for the use of solvents are that acid has little or no effect on maydamaging deposits. Selecting a solvent usually requires some testing with the damage deposit. A fewselected organic solvents are shown in Figure 12.1 6.FluidUsed to RemoveMethyl aicono IDieselKeroseneTolueneXylene (meta)Xylene (para)Xylene (ortho)Xylene bottomsNaphtha<strong>Oil</strong><strong>Gas</strong>olineFigure 12.16: Common Organic Solvents Used in Treating12-2 1
<strong>Gas</strong>esAlthough not usually considered as treating fluids, carbon dioxide gas <strong>and</strong> nitrogen gas are beingincreasing used as additives to stimulation treatments <strong>and</strong> by themselves to help remove damage.<strong>Gas</strong>ses in an injected fluid provide assistance in fluid recovery by expansion in the reservoir when thesurface treating pressure is released. The exp<strong>and</strong>ing gases not only propel liquids from the reservoir,they also provide a gas lift to produce the fluids up the tubing. <strong>Gas</strong> injection can also help restore gassaturation in water blocked gas wells by driving the water out of the pores of the formation. A specialuse of carbon dioxide gas has been in CO2 “huff <strong>and</strong> puff treatments where the CO2 is injected into aheavy oil zone to swell the oil <strong>and</strong> reduce oil viscosity as well as providing driving energy to producethe oil.Su rfactan tsHundreds of chemicals are available as surfactants, <strong>and</strong> each has a use in removing or preventing adamage problem. Surfactants are used in concentrations of 5 ppm to 1 % or more in a carrier fluid thatmay be water, acid, or oil. Their properties are such that they congregate at the high energy interfaceor surface <strong>and</strong> influence the formation <strong>and</strong> stability of emulsions, foams, sludges, surface tension,particle suspension, surface wetting, scale growth, paraffin precipitation, <strong>and</strong> film interactions. Surfactantsare common in most treatments but tend to be overused. Surfactants should be selected on thebasis of carefully run, lab or field tests <strong>and</strong> only the essential surfactants used in any job. Surfactantscan react with each other when several types are mixed.ReactantsReactants are a group of materials that enter into chemical reactants with materials in the well but arenot acids. These materials include bactericides, oxidizers such as bleach <strong>and</strong> chlorine dioxide, chelatingagents, <strong>and</strong> others. They usually have a limited number of specific purposes <strong>and</strong> must be matchedvery carefully with well conditions. Their use in the oilfield is steadily increasing.Treatment TypesA wellbore cleanup treatment is used to remove cement residue, drilling mud particles, scale, <strong>and</strong> perforationdebris which cause injection face damage. Solvents such as diesel, xylene, kerosene <strong>and</strong>alcohols are common as well as the mineral <strong>and</strong> organic acids. The acids used in these stimulationsare normally hydrochloric acid, HCI-HF acid (a mixture of hydrochloric <strong>and</strong> hydrofluoric acids) <strong>and</strong>,less frequently, organic acids such as acetic <strong>and</strong> formic. The concentration of these acids for thecleanup treatment varies from 3% to 15%. The wellbore cleanup treatment, using either acid or solvent,is administered in the form of a soak or a slow injection, <strong>and</strong> the volume of the treatment is onlyslightly larger than the tubular volume across the treatment zone. The solvents such as xylene areoften useful if there is paraffin, asphaltene or oil sludge damage. Alcohols <strong>and</strong> mutual solvents areused to break emulsions, strip oil coatings, remove water blocks <strong>and</strong> alter wettability.After the stimulation or cleanout has been accomplished, the solvent or acid should be produced fromthe wellbore by either swabbing, pumping, displacement with nitrogen, or allowing the reservoir fluidsto backflow the material. Only in injection wells which h<strong>and</strong>le large (>500 bbl/day) volumes of watershould the treatment be displaced into the formation without attempting to backflow. Note: Some wellscannot be backflowed <strong>and</strong> the treating fluids must be injected into the reservoir <strong>and</strong> displaced withoutreturn.Matrix treating is normally used to increase the permeability of the formation immediately surroundingthe wellbore or to remove permeability damage that is beyond the injection face. Matrix treating withsolvents is useful for removing almost any hydrocarbon base damage in the pores. The reaction rateof solvents in the matrix is usually slow <strong>and</strong> is limited by the amount of solvent that can be injectedinto the pores to contact the damage. In matrix acidizing, the acid is also often used as a carrier totransport surfactants such as clay stabilizers or emulsion breakers. The minimum volume of acidwhich should be used in a s<strong>and</strong>stone matrix acidizing treatment will depend upon the type <strong>and</strong> depth12-22
of damage, the permeability of the formation <strong>and</strong> the general response of the acid on the formation.Large acid volumes on high permeability s<strong>and</strong>stones can be beneficial.39Overflush volumes on low permeability zones should be only to the perforations. If large volumes ofacid or overflush are used on low permeability zones, the formation may be damaged since acid reactionproducts may come out of solution before the acid leaves the formation.Damage RemovalDuring pumping in matrix acidizing, as in any treating procedure, useful data on treating effectivenesscan be deduced from surface pressure recorders. It should be remembered with any surface pressure,especially during changeovers from one fluid to another, that the pressure shown on the recorderreflects the injection pressure of the fluid currently at the perforations minus the hydrostatic pressure.The friction pressure, if any, increases the surface pressure. Any change in density of fluid in the tubingwill change the surface pressure at constant injection rate. Thus, any change that an injected fluidmakes on the formation will not be indicated by the pressure recorder until the newly injected fluidreaches the perforations, usually several minutes after the pumping begins. With most acid systems inpermeability damage removal treatments, the pressure recorder may register a small rise (comparedto water or preflush injection) as the acid enters the formation followed by a gradual decrease to somestabilized pressure. The timing <strong>and</strong> the sharpness of the surface pressure drop is determined by depth<strong>and</strong> amount of the damage <strong>and</strong> the reactiveness of the acid toward that damage. For example, calciumcarbonate scale damage can be removed relatively quickly while particle stabilized emulsions,deep clay damage <strong>and</strong> thick scale deposits are removed very slowly.Viscous stable emulsions <strong>and</strong> water blocks clean up very slowly <strong>and</strong> may require soaking or a slowinjection with the mutual solvent/acid system. Emulsion breaking in the pores of the formation is vastlydifferent from a simple beaker demonstration showing breaking of the emulsion by surfactants. Breakingemulsions (<strong>and</strong> removing water blocks) requires contacting each droplet of the emulsion with thetreating fluid. A long cleanup time, or even repeat treatments in the case of a large amount of emulsion,is normal. For more information, see the description of on emulsions in the chapter on formationdamage.If a continuous pressure rise is noted during the injection of a clean fluid, this may be an indication ofdetrimental acid reactions occurring in the formation. These acid reactions may include formation ofsludges, release of migrating particles, clay swelling, creation of emulsions, or other reactions. If thepressure climbs sharply <strong>and</strong> continuously for several minutes, pumping should be stopped <strong>and</strong> thewell backflowed. Samples of this backflow should be caught for analyses of iron content, acidstrength, <strong>and</strong> presence of emulsions <strong>and</strong> solids.40 If the formation cannot be broken down, the locationof the perforations should be checked. If the perforations appear to be at the right depth, reperforatingis suggested.In most instances of acid creating damage in oil wells, emulsions or sludges are usually at fault. Thesludge or emulsions formed between acid <strong>and</strong> a few crude oils are worst when iron <strong>and</strong> asphaltenesare present <strong>and</strong> are very viscous <strong>and</strong> stable.41142In gas wells, the most likely damage from an acid treatment will be water blocks created by the spentacid. If water blocks are known to form in the subject formation, either mutual solvents or alcoholsshould be added to the entire treatment.If the injection pressure climbs rapidly during the treatment <strong>and</strong> the well will not backflow, formationdamage, or mechanical problems may have occurred. Checks of the mechanical equipment (includingpacker location) <strong>and</strong> reactivities of oil, acid (with additives), <strong>and</strong> formation water should be made.If the surface pressure decreases rapidly during the treatment or the well goes on LLvacuum” (i.e.,takes fluid rapidly with hydrostatic pressure only), (1) matrix permeability is being increased (or damageremoved), (2) natural fractures are being enlarged, or (3) the formation has been fractured. This12-23
ehavior is very common on low pressure wells <strong>and</strong> is the cause of large losses of fluid to the formati~n.~~Backflow: After completion of a treatment, the returns in most cases are flowed back to a pit or tankas rapidly as possible. The rapid flow carries suspended particles, emulsions, <strong>and</strong> spent acid thatwould be difficult to produce without substantial driving energy. In the case of slow backflow from areservoir with low driving energy, the recovery of fluids may be aided by swabbing, nitrogen gas orCO2 gas in the fluid or preflush, or by artificial lift. Regardless of the recovery method, in mostinstances the stimulation fluids should be recovered as rapidly as feasible. Only with some unconsolidatedformations or in proven instances of migrating fines caused by high flow rates should a slowrecovery technique be used. Migrating fines may be identified with a laboratory test that plots permeabilityresponse with increasing <strong>and</strong> decreasing driving pressure <strong>and</strong> flow rate.Reaction Rate FactorsTemperatureAcid reaction rate on most acid soluble materials increases with temperature because of a lowering ofviscosity. Hydrochloric acid reacts with limestone almost instantaneously <strong>and</strong> is affected in the temperaturerange of 60°F (16°C) to 200°F (93°C) only by the transfer of the acid to the formation <strong>and</strong> thetransfer of soluble by-products away from the reaction site. As the treatment temperatures increase,the viscosity of the acid is lowered, allowing the acid to move into smaller pores <strong>and</strong> cracks. Also athigher temperatures the reaction by-products are more readily soluble in the HCI acid which aids inthe transfer of by-products away from the reaction site.PressureThe reaction rate of acid is reduced as the pressure rises from atmospheric to about 500 psi(3450 kPa). Any pressure increase above 500 psi has very little effect on the rate of reaction of theacid with the formations. Since nearly all acidizing treatments are performed at pressures over500 psi, the effects of pressure changes will not enter into the treatment design.Area Volume RatioArea-to-volume ratio is the major factor controlling spending time of the acid on a particular formation.The area-to-volume ratio is the surface area of the formation which is in contact with a given volume ofacid. The ratio is inversely proportional to the width of the fracture or the pore diameter if the treatmentis a matrix acidizing treatment. Area-to-volume ratios may range up to 20:l in a 1/10 in. wide fracture,200+:1 in an open hairline crack, <strong>and</strong> on the order of 30,OOO:l in a matrix with a porosity of 20% <strong>and</strong> apermeability of 10 md. At high area volume ratios, the acid spending time is short <strong>and</strong> the penetrationof live acid is greatly reduced. For this reason, live acid will penetrate farther in an open hydraulicfracture than in a hairline fracture or through the matrix.Acid ConcentrationInitially, 15% HCI was picked as a st<strong>and</strong>ard acid strength because of the poor performance of the firstinhibitor, sodium arsenate, in higher concentrations of acid. As inhibitors were improved, the higherconcentrations of acids were used in fracturing for their higher dissolving capacity. In matrix treating ofs<strong>and</strong>stones, 15% HCI is usually the upper concentration limit.Hydrochloric acids of 5, 7-1/2, <strong>and</strong> 10% strength are used as damage removal treatments in s<strong>and</strong>stoneformations. These weak acids, when coupled with a surfactant, will frequently remove the acidsoluble damage with much less tubular corrosion than the higher strength acids.Acid SelectionSelection of the acid for the stimulation is very often dictated by the damage <strong>and</strong> the composition <strong>and</strong>temperature of the formation. In the majority of stimulations, HCI acid is used because of its low price,12-24
lack of insoluble by-products, <strong>and</strong> high dissolving capacity. For reaction on clay, silt, <strong>and</strong> low calciumcontent s<strong>and</strong>stone, a mixture of HCI acid <strong>and</strong> HF acid is used. In high temperature formations (temperaturesabove about 220°F) where HCI reacts very quickly <strong>and</strong> is difficult to inhibit, an organic acidmay be considered as a substitute.Formation CompositionThe composition of the rock is important for determining the method of treatment as well as type <strong>and</strong>strength of acid. If a formation has very little carbonate but is rich in clay minerals, then an HCI/HFacid mixture may be the optimum stimulation for increasing impaired permeability in the immediatearea of the wellbore.AdditivesAcid additives are specially developed chemicals that modify the chemical or physical behavior of theacid in reactions with produced fluids, the formation, or reaction by-products. The additives may besurfactants, alcohols, hydrocarbon solvents, salts, polymers, <strong>and</strong> other compounds. They are formulatedto solve a particular problem, yet may have other uses besides the primary function. The briefadditive descriptions that follow are intended to provide a brief look at the individual classes of materials.SurfactantsSurfactants are multifunction chemicals which are added in small volumes to acid to accomplish a certaintask. Some surfactants may help acid penetrate the formation more easily while others may act assolubilizing agents or clay stabilizers. The amount <strong>and</strong> type of surfactant to use depends upon the formation<strong>and</strong>, in some cases, upon individual well characteristics.One serious problem with surfactants is adsorption onto clay surfaces in the formation.44 Surfactantswhich adsorb heavily should be avoided. This can usually be accomplished by knowledge about theformation <strong>and</strong> the particular surfactant <strong>and</strong> the composition <strong>and</strong> behavior of backflow fluids after atreatment.Surfactants can be classified into four major groups. The division in which a surfactant belongsdepends upon the water-soluble group of the surfactant. The divisions are:1. Anionic2. Cationic3. Nonionic4. AmphotericAnionic surfactants have a negatively charged water-soluble group on the end of the molecule. Examplesare the sulfate <strong>and</strong> sulfonate compounds. The major applications of anionics are as nonemulsifying,retarding, <strong>and</strong> cleaning agents.Cationic surfactants have a positively charged water-soluble group. An example is quaternary ammoniumchloride. The major uses of the cationics are as nonemulsifiers, corrosion inhibitors, <strong>and</strong> bactericides.Most nonionic surfactants contain polymers as the water-soluble group <strong>and</strong> hence have no charge.Examples of the nonionics are polyethylene oxide <strong>and</strong> polypropylene oxide. Major uses of nonionicsare as nonemulsifiers <strong>and</strong> foaming agents.12-25
Amphoteric surfactants are organic molecules with a water-soluble group which may be either positive,negative, or have no charge. The particular charge of the water-soluble segment of an amphotericsurfactant depends upon the pH of the system. Amphoterics have only very limited usage withinthe petroleum industry at the present time.Mixing surfactants may cause reactions between some surfactants of oppositely charged classes tothe extent of rendering some surfactants inactive or damaging. Mixing of the surfactants cannot beavoided in most cases, since the corrosion inhibitors are usually cationic, while many other acid additivesare anionic; however, concentration ranges have been established by the service companies forsurfactant mixing so that maximum performance of each surfactant can be achieved.Fluorocarbon surfactants are usually less adsorptive than normal hydrocarbon base surfactants butcan cause severe emulsion problems if used in the wrong concentrations. Fluorocarbons may workadequately in the range of 5-100 ppm <strong>and</strong> are diluted usually with alcohol or water. Over use of anysurfactant may change the behavior of any surfactant <strong>and</strong> cause damage.WettabilityWettability is a term used to indicate whether a formation can be preferentially coated with oil or water.This information may be determined from laboratory tests on the produced oil. Additives which converta formation surface from oil-wet to water-wet will speed considerably the reaction between the acid<strong>and</strong> the soluble material. These surface preparations may be cleaners, solubilizers, or other water-solublematerials which can strip oil <strong>and</strong> water-wet the surface. Reservoirs are characteristically waterwetor oil-wet (a function of the natural surfactants in the crude oil) <strong>and</strong> the condition of the reservoir inquestion should be known before planning a treatment. Removal of oil film from scale deposits is alsoimportant for speeding the reaction of acid in removing the scales. Surfactant influences how the wettedsurface will behave since the water-soluble, charged end of the surfactant is adsorbed on the formationleaving the oil-soluble group to influence wettability. In general, cationics (positively charged)adsorb on s<strong>and</strong>stone (negatively charged) <strong>and</strong> anionics (negatively charged) adsorb on limestones<strong>and</strong> dolomites (positivelyClay Control Additives: If a formation contains swelling or disintegrating clays which may cause permeabilityreduction, a clay control process may be warranted. These treatments, generally either polymer,51152zirconium o~ychloride,~~ or hydroxy aluminum,54 work in different ways, but all seek toisolate or stabilize the clays to prevent breakup of the clay platelets. The optimum clay stabilizer <strong>and</strong>amount of stabilizer solution will depend upon the characteristics of the individual formations.Surface Tension Reducers: A surface tension reducer aids in the recovery of fluids by decreasingthe amount of energy necessary to push the fluid past gas <strong>and</strong> liquid boundaries.Demulsifying Agents <strong>and</strong> Nonemulsifying Agents: These chemicals are oil-soluble surface activeagents <strong>and</strong> are normally carried in a water or acid medium at concentrations of 0.1 % to 5%. Nonemulsifyingadditives prevent the formation of emulsions during an acidizing stimulation <strong>and</strong> demulsifiersare designed to break emulsions. Special mixtures of HCI <strong>and</strong> nonemulsifying agents are marketed asnonemulsifying acids to stimulate formations containing emulsion-causing crude^.^^?^' Proper concentrationof the demulsifier or nonemulsifier in the treatment is critical. Too high a concentration ofdemulsifier or nonemulsifier can turn some products into very good emulsifiers. For this reason, circulationof the acid tanks (which remixes the additives) before injection is a must. If a mutual solvent isused in the treatment, neither a demulsifier or a nonemulsifier may not be needed.Antisludge Additives: Some crude oils react chemically with hydrochloric acid to form semi-solidparticles referred to as sludge!1s42157 This formation of the acid-oil sludge begins almost immediatelyafter contact between the crude oil <strong>and</strong> the acid. The tendency toward formation of sludge is affectedby the concentration of the acid <strong>and</strong> other variables <strong>and</strong> is best determined by laboratory testing.Higher strength acids <strong>and</strong> low API gravity oils have a greater tendency toward sludge formation.12-26
Sludge may form in the wellbore or in the formation <strong>and</strong> can completely plug flow channels in the producingformation. Sludge is extremely difficult to remove because it is insoluble in most treating fluids.Alcohols: By including certain alcohols or certain mixtures of alcohols in an acidizing treatment, it isoften possible to take advantage of their many surfactant qualities at a lower cost than buying a set ofindividual surfactants such as a penetrating agent <strong>and</strong> an emulsion breaker.59i59 Also, alcohols do notadsorb in the formation like most surfactants, hence they remain with the treating solution in the formation.Alcohols are normally used at concentrations of 5% to 40% by volume in the treating fluid. Theadvantages of alcohols are quick cleanup with less emulsions <strong>and</strong> water blocks.Mutual SolventsMutual solvents may be the most useful additive in s<strong>and</strong>stone acidizing <strong>and</strong> damage removal treatments.Mutual solvents aid in lowering surface tension, breaking emulsions <strong>and</strong> water blocks <strong>and</strong>have been used to reduce surfactant adsorption in the formation.5s6o The mutual solvent should beconsidered whenever the possibility of creating emulsions <strong>and</strong> water blocks exists.Acid Thickeners: Thickening of acids may be desirable to control leakoff, to inhibit mixing with otherfluids, or to promote differential etching in fract~ring.~”~~ The products are occasionally used in matrixtreating, but are usually reserved for fracturing. Guar-gum polymers <strong>and</strong> some synthetic polymers areoften used as inexpensive thickeners in acid but since the acid acts as a breaker, their performance ispoor. Gelling agents designed for acid may be polymer, surfactant system or crosslinked polymer. Viscositiesof polymer <strong>and</strong> surfactant gelled acids are about 20 to 50 cp or slightly higher, while thecrosslinked acid viscosity may be over 100 cp.Inhibitors: Acid inhibitors slow the acid reaction on the steel piping in the well system <strong>and</strong> usuallykeep tubular damage to a minim~m.’~ Before any acid stimulation is planned for well, the condition ofthe tubular goods should be known. If the casing <strong>and</strong> tubing are in poor condition or if the condition isunknown, the use of a workover string should be considered. All acids used in stimulation should beinhibited to protect the tubular goods as well as the service trucks <strong>and</strong> tanks. The inhibition protectsthe steel by adhering to the metal <strong>and</strong> forming a very thin coating which the acid will not readily penetrate.This film will break down with time so the acid should be flushed out the lines <strong>and</strong> well tubulargoods after an acidizing job.Since corrosion inhibitors are usually cationic surfactants, adsorption in s<strong>and</strong>stone reservoirs will stripthe acid of inhibitor very rapidly. When live acid is returned from the formation, corrosion on tubularscan be severe. To minimize this problem, the acid concentration should be only high enough to consumethe damage. If live acid will be returned to the wellbore, the acid should be flushed out as rapidlyas possible.iron Control Agents: Hydrochloric acid reacts with iron in tubing, rust, iron scale, siderite or chlorite,to form iron compounds such as gelatinous iron hydroxide as the pH of the spent acid rises above 2.0(a relative acid strength of less than 1 % HCI).w$E Sequestering agents are added to acid to preventthe iron precipitation as the acid spends. To determine if a sequestering agent is needed, samples ofthe returned acid from a treatment should be analyzed for total iron content <strong>and</strong> the source identified.Suspending Agents: During an acid reaction on any acid-soluble material, fine particles which maybe acid-insoluble or slowly acid-soluble are released <strong>and</strong> carried through the fracture with the flow ofthe acid. When the fluid movement stops or slows sufficiently, the particles may fall out of suspension<strong>and</strong> plug the fracture. The use of a suspending agent (normally a soap or foaming surfactant) in theacid will aid in keeping the particles in solution until produced from the well.12-27
Wash DesignWellbore Cleanup <strong>and</strong> Acid WashRemoval of some scales, coatings, sludges, <strong>and</strong> other near-wellbore damage can often be accomplishedwith an acid soak or with low strength acid wash.The basic procedure for an acid “soak” or “spot” is to run tubing completely below or to a point in thelower half of the open-hole or perforated completion interval <strong>and</strong> pump the acid down the tubing,allowing it to st<strong>and</strong> over the completion zone. Washing is often done on carbonate formations of highpermeability to reduce cement <strong>and</strong> drilling mud damage. This is also effective in reducing breakdownpressure on wells to be fractured by reducing cement <strong>and</strong> perforation damage. If no packer is used, itis most important that the fluid density of the acid be the same as the density of the fluid in the hole orthe acid will float up or become dispersed in the wellbore fluid. Acid density can be increased withweighting materials such as calcium chloride if necessary. After the acid is spotted at the perfs, thewellbore fluid-acid interface will seek a common level inside the tubing <strong>and</strong> in the casing tubing annulusif the wellbore fluid is kept fully loaded on the tubing <strong>and</strong> annulus at the surface.To “wash” the completion zone, the acid should be pumped past the open hole or perforations by displacingit from the tubing (the acid should not be completely displaced from the tubing; this will minimizemixing with the displacement fluid), allowing the wellbore fluid-acid interface to rise in theannulus. Then the acid can be allowed to “U-tube” back into the tubing by bleeding back some of thedisplacing fluids from the tubing while simultaneously pumping fluid back into the annulus. This displacementof acid back <strong>and</strong> form from the tubing to the annulus should be done several times, so thatthe completion interval is subjected to most of the unspent acid.After the acid has been washed back <strong>and</strong> forth several times, the well fluid-acid interface can be displacedto near the top of the completion interval by pumping into the tubing. If a packer is not used,then the annulus should be shut-in to hold the interface at this level or it can be held at that point bysetting the packer (provided the well does not go on “vacuum”). Then all of the acid below this point<strong>and</strong> in the tubing can be pumped into formation with minimum pressures.Solvent Wash of Injection WellsIn many injection wells there are layers of oil sludge built up over the open-hole or perforations whichprevent the well from taking injection water. These sludge layers often contain too much organic compoundsfor a mutual solvent <strong>and</strong> acid to effectively remove. To properly treat these cases, a solventsuch as toluene or xylene may be necessary. Although other solvents can disperse oil, xylene <strong>and</strong> toluenehave been found to be the most consistent at solubilizing or dispersing most of the organic materialsfound in injection well sludges.After washing <strong>and</strong> acidizing, the wellbore fluids should be backflowed or unloaded with nitrogen, ifpossible. There is normally too much debris (s<strong>and</strong>, silt, undissolved oil <strong>and</strong> trash) remaining after atreatment to flush the treatment into the formation (Note: This does not apply in injection wells wherethere is no sludge).In instances of very severe sludge buildup, mechanical scrapers <strong>and</strong>/or jetting nozzles on tubing havebeen used successfully to clean wellbores.Perforation BreakdownPerforation breakdown treatments with acid have been used to try to open up the perforations prior toproduction or further stimulation. These treatments have had very mixed results. A better approach tobreaking down (opening) perforations is the perforation breakdown tool offered by several companies.The device is basically a perforated nipple between two packers.35 The packers isolate a few feet ofperforations at a time <strong>and</strong> an acid is pumped down the tubing <strong>and</strong> through the perforated nipple toopen the perforations. Although water or oil could be used to open the perfs, the acid can remove anyperforating debris <strong>and</strong> most cement <strong>and</strong> mud damage.12-28
The spacing between the packers should be as short as possible since only a few perforations in eachtreated interval will be opened before the fluid pressure is lost. The volume of acid pumped into eachsection may vary but 25 gallft is usually adequate. This tool should not be used on perforations withinabout 10 ft of any water contact due to the possibility of fracturing the zone into the water. If the treatmenthas to be shut-in for a time exceeding about six hours, consideration should be given to breakingdown the perfs with KCI or NH4CI water instead of acid.Extreme Overbalance PerforatingAn alternate method of breaking down perforations is to use a very high overbalance of a gas drivenclean fluid at the time of perforating. Details are given in the chapter on perforating.Matrix Acidizing DesignBefore designing an acidizing treatment, review the well’s production history <strong>and</strong> determine if thepotential benefits are worth the stimulation attempt.36 The success ratio for matrix acidizing treatmentsin the industry is low - estimates range from 30-50% - <strong>and</strong> many wells are damaged by poorlydesigned or unneeded acid treatments. Heading the list of acidizing failures are wells that are indiscriminatelyselected for acidizing because of a wild hope of increasing production. Effective use ofacid treatments requires careful examination of the well <strong>and</strong> its production history. A commitment todesigning a job on the basis of individual well requirements <strong>and</strong> controlling the quality of the treatmentwill insure better results.A great many acid jobs fail because the “formation damage” that has been treated is actually faultyperforations. If the number, size or location of the perforations is in doubt, the well should be reperforated<strong>and</strong> tested before being acidized.Obtaining the Required InformationFigure 12.17 is a worksheet that can be used in designing a treatment <strong>and</strong> illustrates the type of informationnecessary for treatment design. Section I of the figure must be filled in from well records orfield experience before the acidizing treatment can be designed. The items likely to cause the mostdifficulty are average undamaged permeability <strong>and</strong> permeability of the highest permeability zone. Theaverage undamaged permeability can be obtained from buildup tests or from an average of core permeabilities.A core permeability average will likely be much lower than a permeability calculated froma buildup test since a core permeability will not reflect the contribution of any natural fractures. If acore permeability is used, it is best to use results of liquid permeability tests for oil <strong>and</strong> water wells <strong>and</strong>of gas permeability tests for gas wells. A core’s permeability to gas or air is often several fold higherthan its permeability to liquid if there is no correction for slippage <strong>and</strong> turbulence. A buildup permeabilityprobably reflects closely the true permeability of the formation <strong>and</strong> should be used whenever possible.Actually, kh is the result from the buildup test <strong>and</strong> the accuracy of kwill depend on which h isused; i.e., the perforated height or the total interval thickness. For purposes of this procedure, the net(perforated) zone height should be used except in severely restricted, limited entry completions whereless than 50% of the net pay has been perforated. In that case, the perforated zone height should beused. The permeability of the zone of highest permeability is a measure of the permeability of any thiefzones, fractured zones, or leakoff zones that may exist in the formation. If there are no thief zones orstringers of high permeability, then this value should be set the same as the average undamaged permeability(k,,). If there is a history of rapid leakoff from the zone, an approximate permeability may becalculated from leakoff rates or, if available, from core analyses of the high permeability zone on thiswell or immediately offset wells. The well’s stimulation history should be investigated since inducedfractures can act as leakoff zones.Carbonate content <strong>and</strong> porosity are available from core data. Zone thickness <strong>and</strong> formation temperatureare available from log data. The type of damage in the rock is best ascertained by examining well<strong>and</strong> workover histories. If there is no damage but the formation does respond readily to acid, the formationcan still be matrix acidized; however, matrix acidizing an undamaged formation will increasethe production rate only slightly.12-29
I. Information Neededformation temperatureavg. undamaged permeabilityperm. of high perm zonecarbonate contenttype of damageavg. porosity (net pay)net pay thicknesstbg. vol + csg below packeropen hole diam. if not casedFmdmd%decimalftbblin.II.Design Information1.2.type of damagetype of acidif damage not acid soluble,select a solvent(Figure 12.19)(Figure 12.18)3.type of solvent (Figure 12.19)4.5.6.volume of acid/solventacid vol.solvent vol.additivesadditivesadditivesadditivesstages <strong>and</strong> divertinga.no. stagesb.type diverterc.divt. quant.d.Vol. stagese.S.1. P./ballsf S. I .P./spacing(Figure 12s.18)(Figure 12.20)(Figure 12.20)(Figure 12.21)(Figure 12.22)(Figure 12.23)(Figure 12.24)(Figure 12.25)(Figure 12.26)(Figure 12.26)(Figure 12.27)(Figure 12.27)7.Nitrogen or CO gas use?decision based on (Figure 12.28)volumes set after contact withservice company engineer8.Ovem us hovemush typevol. of fluid(see page 34)(Figure 12.29)Figure 12.17: Chemical Stimulation Design Work Sheet12-30
~~Designing the TreatmentSection I I of the worksheet is filled out with the help of Figures 12.18 through 12.27.The acid is usually selected (Figure 12.18) on the basis of the formation mineralogy, the formationtemperature <strong>and</strong> the type of damage in the s<strong>and</strong>stone. For s<strong>and</strong>stones with total carbonate contentbelow 10-1 5%, the best acid at temperatures below 250°F is usually HCVHF (HCVHF acid in thisreport refers exclusively to 12% HCI + 3% HF). At formation carbonate concentrations greater than15%, acids containing HF are usually not recommended because an insoluble precipitate - calciumfluoride, CaF2 - may form. At temperatures greater than 250"F, the HCI is typically replaced with formicacid or acetic acid.Temperature(" F)QOO200-250250-350>350Less tl li an 5%Treatment50 ga'/n15% HCIfollowed byHCllHF35 gallit10% HCIfollowed byHCVHF35 gaVft10% formicacid, formiclHC1,orformic HF35 galin10% formicacid, or formic/HF200-250250-350>3505% to 10% 10% to 15% I Over 15%50 gaVft 15%HCI followedby HCllHF35 gaVft7.5% HCI &10% formicacid followedby forrnidHF35 gallft 10%formic acidfollowed byformicRlFTemperature I Treatment I I Treatmentm258350by perforationwash withHCVHF50 gaVft 7.5% 250-350 50 gal/ftHCI & 10% 10% 7.5%formic acid HCI & 10%formic acidformic acid10% formicacidFigure 12.18: Carbonate ContentFigure 12.19 lists common types of formation damage <strong>and</strong> recommended solvents for treating them.The type of damage may be what ultimately dictates which acid is used. However in dealing with insolubleprecipitates, other limitations may take precedence (for example, even if there is drilling muddamage, HCI/HF should not be used if the s<strong>and</strong>stone is limy; a better approach is a small fracturetreatment). The volume of acid (Figure 12.20) used in a matrix acid treatment varies with the permeability.(The depth of damage is also important; however it usually cannot be determined.) In low permeabilityzones where injection is very slow, it is advisable to use small volumes of acid to avoid(1) corroding the tubing because of long acid residence time, (2) fracturing the s<strong>and</strong>stone with theacid, or (3) precipitating acid reaction products out of the spent acid during the long period necessaryfor recovering the spent acid. On formations with permeabilities less than 0.1 md, acid is recommendedonly for perforation breakdown. Acid may even be replaced here by a clean 2% KCI waterSelecting additives is the biggest challenge in treatment design. Figures 12.21 through 12.25 list recommendedadditives <strong>and</strong> surfactants for various conditions. Selecting some additives such as mutualsolvents precludes using other additives such as demulsifiers, nonemulsifiers, alcohols, or surfacetension lowering surfactants. The use of other additives, such as iron sequestering additives dependsupon the amount of rust or iron scale in the tubing. If excessive rust or iron scale is present, a pretreatmentcleanout may be required. Do not use clay control additives unless the formation has demonstrateda sensitivity to produced waters or to waters that will be used in the treatment. Clay control12-31
additives often reduce permeability by as much as 50%. There is a common test that purports to showwater sensitivity by injecting a one normal sodium chloride brine <strong>and</strong> following it with distilled water.However unless sodium chloride brine followed by fresh water is to be used in the well, it is not a validtest to demonstrate need for a clay control treatment. Sometimes in the area near the wellbore in anunfractured well, the increase in velocity caused by converging radial flow will result in the productionof formation fines that can reduce the permeability. In such cases, a clay-control additive may be useful.If the fines are moving throughout the entire formation, however, a clay control treatment will notbe effective.Figure 12.19: Solvents for Common Damage Conditions in S<strong>and</strong>stonesNitrogen gas may be useful if the formation is a gas zone with permeability below about 20 md <strong>and</strong> isnot naturally fractured. Whether to use nitrogen gas in the treatment can be decided with the aid ofFigure 12.26. The nitrogen supply company can help decide how much nitrogen gas to use. The volumewill be based on bottomhole pressure, depth <strong>and</strong> the size of the treatment.12-32
Figure 12.20: Suggested Acid VolumesAdditiveCorrosion InhibitorClay Control AgentFriction Reducer' Silt SuspenderIron Control AgentUsealways used when acidizinguse only if problem clays may existuse in high rate fracturing treatmentswhen clearing drilling mud or when acid reaction produces more than 10% siltUse only if analysis of previous acid backflow shows >1500 ppm total iron. Alsoneeded where >10% chlorite, magnetite or siderite exists. Rusty tbg. must becleaned or redaced before acid.Figure 12.21 : Specific Purpose Acid AdditivesThe overflush volume is usually minimized since acid spends fairly rapidly in the formation matrix <strong>and</strong>a large overflush would unnecessarily contribute more load fluid to recover. The recommended overflushvolumes are given in Figure 12.27. The type of overflush fluids depends upon the acid <strong>and</strong> theformation. For HCI treatments, one can use filtered produced water, 2% KCI water, 2% NH4CI water,gas (in a gas well), or oil (in an oil well) - as long as the fluid is CLEAN. For HCllHF acid, acceptableoverflushes are clean 2% NH4CI water, oil, gas or HCI. If an HCI afterflush is used, 5% to 7-112% HCIis usually adequate.12-33
I Additive I Use IIMiscible/mutual Solvent I use when emulsions <strong>and</strong> sludges - . present may - replace . many surtactants 1Alcoholto remove water blocks, helps recover water or spent acid, breaks someemulsionsAntisludgeprevents sludge in oils where a proven sludge tendency existsNonemulsifierprevents emulsions, testing m<strong>and</strong>atory not needed when mutual solvent isusedDemulsifierbreaks emulsions, testing m<strong>and</strong>atory not needed when mutual solvent isusedFigure 12.22: General Purpose Acid AdditivesAdditiveMutual solventSurf. Tens. loweringDispersantsFoamersUseneips remove water blocks in oil zoneshelps remove water blocks in oil zoneshelps solvent penetrate paraffin <strong>and</strong> sludgesused in combination with gas to help unload wellFigure 12.23: Solvent AdditivesAverage UndamagedPermeability X ZoneThickness*, k,h10 to 100 md tt100 to 1000 md ft>loo0 md ft or natural fracturesRecommendationsTwo stages; put diverter in last third or tirst stage, or use perforationwash tool.Three stages; put diverter in last third of stages one <strong>and</strong> two, or useperforation wash tool.Four stages; put diverter in last third of stages one, two, <strong>and</strong> threeor use perforation wash tool.Figure 12.24: Number of Stages for a Matrix Acid TreatmentAfter the worksheet has been completed, pressure calculations will need to be added <strong>and</strong> a workoverform completed.12-34
Thermal stimulation may be accomplished by electric resistance heating, hot oil, water injection orcontrolled circulation, gas burners, in-situ combustion, exothermic reactions or steam injection.Electric heat generation devices have been used in areas producing viscous crudes to lower the oilviscosity or where the paraffin cloud point (precipitation point) is nearly the same as the bottom holetemperature. Both continuous <strong>and</strong> intermittent heaters are available for specific applications. The totalquantity of wells heated by electrical resistance heating is small; the expense of electricity <strong>and</strong> powerlosses are the chief reasons.The response from wells in California <strong>and</strong> the USSR shows varied response depending upon s<strong>and</strong>thickness <strong>and</strong> amount of damage in the reservoir. In California, a 13" API crude oil with a viscosity ofover 3500 centipoise at the wellbore temperature of 80°F was successfully produced after the temperatureat the wellbore was increased to 140" (viscosity dropped to 210 centipoise). Payout time of thecapitol cost of equipment was approximately two years.Electric heaters currently available may be of several types. Usually the power ratings are between 9-60 kilowatts (20,000-500,000 BTU/hour). These heaters may deliver heat generation in excess of2OO0F, although the depth penetration of the heat into the wellbore is limited, especially as fluids flowtoward the wellbore.<strong>Gas</strong> burners are suitable for heating wellbores to much higher temperatures <strong>and</strong> for initiating firefloods <strong>and</strong> fire flood clean up around the wellbore. A gas burner involves injection of gas down thetubing while air is injected down the casing/tubing annulus. The gas is ignited by an ignition system atthe tool creating extremely high temperatures. If the zone is a fire flood, the flame is exposed to theformation <strong>and</strong> if the thermal properties of the gas are to be exploited without a fire flood, the tool usesa shield to protect the casing from heat damage. Heat is transferred by air flowing around the heatshield <strong>and</strong> into the formation.Hot water circulation is a simple method of wellbore heating, but it is not usually effective because thetubing <strong>and</strong> casing become a shell <strong>and</strong> tube exchanger: the returning fluid robs heat from the injectedfluid. Methods that make the process work are insulated tubing <strong>and</strong> dual tubing strings. Bull heading(no circulation) is also an effective method of getting heat to bottom hole although formation damageis severe.66Stimulation of oil wells by combustion is an outgrowth of fire flood technology. The familiar combustionfront is initiated at the wellbore by a burner <strong>and</strong> propagated into the formation to a distance of approximately10-20 ft. The cleaned formation surrounding the wellbore serves as a pathway of improvedpermeability to the returning fluids when the well is put back on production.Hot water <strong>and</strong> steam injection provide effective well stimulation. Steam is the more widely used of anyof the high capacity thermal methods <strong>and</strong> is capable of millions of BTU input into a formation. Use ofhot water in stimulations have met with only limited success because of heat transfer problems. Cyclicsteam injection over a period of weeks or months may provide roughly the same productivity increaseas a fire flood.Chemical Heat GenerationHeat may also be produced either downhole or at the surface by the use of exothermic reaction^.^^-^'The most common heat producer involves the reaction of sodium nitrite with another salt, such asammonium nitrate or ammonium chloride, to produce heat <strong>and</strong> nitrogen gas?8 The advantage of thisreaction over other exothermic reactions is that it may be controlled by buffers that affect the pH of thesystem. By control of the mixing <strong>and</strong> the buffers, the point at which maximum heat is generated can bepredicted <strong>and</strong> controlled. Maximum temperatures recorded with the process are in excess of 400°F<strong>and</strong> the total heat available depends upon the volume of the reactants. The process offers some treatingversatility, since the buffered reactants can be combined with aromatic solvents in a slightly stabi-12-37
lized emulsion that will provide a heated solvent at a predetermined place in the ~ellbore.~’ The mainapplication in the technical literature has been in paraffin removal.A second heat generation process, specifically for acid, is addition of ammonia to hydrochloric acid.The reaction of the acid with the ammonia generates an immediate heat rise.71 The need for heatinghydrochloric acid is rare but has application in fracturing a cool, low reactivity dolomite, prevention ofparaffin precipitation, removing high viscosity oil coatings from an acid reactive surface, as an aid inbreaking emulsions, <strong>and</strong> to minimize tubing contraction caused by injecting cool acid in a hot well.<strong>References</strong>1. Williams, B. B.: “Fluid Loss from Hydraulically Induced Fractures,” Journal of <strong>Petroleum</strong> Technology,(July 1970), 882-888.2. Harrison, N. W.: “Diverting Agents - History <strong>and</strong> Application,” Journal of <strong>Petroleum</strong> Technology(May 1972), 593-598.3. Ellenberger, C. W. <strong>and</strong> Aseltine, R. J.: “Selective Acid Stimulation to Improve Vertical Efficiencyin Injection Wells - A Case History,” Journal of <strong>Petroleum</strong> Technology (Jan. 1977), 25-29.4. Best, B. W. <strong>and</strong> Miller, L. 0.: “Optimum Use of Diverting Agents in Well Stimulation Treatments,”Stimulation, 101-1 03.5. Webster, K. R.; Goins, W. C., Jr. <strong>and</strong> Berry, S. C.: “A Continuous Multi-stage Fracturing Technique,”Journal of <strong>Petroleum</strong> Technology (June 1965), 619-625.6. Stipp, L. C. <strong>and</strong> Williford, I?. A.: “Pseudolimited Entry: A Send Fracturing Technique for SimultaneousTreatment of Multiple Pays,” Journal of <strong>Petroleum</strong> Technology (May 1968), 457-462.7. Lagrone, K. W. <strong>and</strong> Rasmussen, J. W.: “A New Development in Completion Methods-The LimitedEntry Technique,” Journal of <strong>Petroleum</strong> Technology (July 1963), 695-702.8. Streltsova-Adams, T. D.: “Pressure Drawdown in a Well with Limited Flow Entry,” Journal of<strong>Petroleum</strong> Technology (Nov. 1979), 1469-1 476.9. Jones, L. G. <strong>and</strong> Slusser, M. L.: “The Estimation of Productivity Loss Caused by Perforation -Including Partial Completion <strong>and</strong> Limited Entry,” Paper SPE 4798, presented at the Second Midwest<strong>Oil</strong> <strong>and</strong> <strong>Gas</strong> Symposium, Indianapolis, March 28-29, 1974.10. Hushbeck, D. F.: “Precision Perforation Breakdown for More Effective Stimulation Jobs,” PaperSPE 14096, Int. Mtg. Pet. Eng. Beijing, March 17-20, 1986.11. Ande, T. J. <strong>and</strong> Perkins, D. B.: “Thru-Tubing Plugback Tools <strong>and</strong> Services,” Amoco New Orleans<strong>Engineering</strong> Report, November 16, 1987.12. Brown, R. W.; Neill, G. H. <strong>and</strong> Loper, R. G.: “Factors Influencing Optimum Ball Sealer Performance,”Journal of <strong>Petroleum</strong> Technology, (April 1963), 450-454.13. Crurnp, J. B. <strong>and</strong> Conway, M. W.: “Effects of Perforation-Entry Friction on Bottom Hole TreatingAnalysis,” Journal of <strong>Petroleum</strong> Technology (Aug. 1988), 1041-1 048.14. Erbstoesser, S. R.: “Improved Ball Sealer Diversion,” Journal of <strong>Petroleum</strong> Technology, (Nov.1980), 1903-1 91 0.12-38
15. Gabriel, G. A. <strong>and</strong> Erbstoesser, S. R.: “The Design of Buoyant Ball Sealer Treatments,” PaperSPE 13085 presented at the 59th Annual Technical Conference <strong>and</strong> Exhibition, Houston,September 16-1 9, 1984.16. <strong>King</strong>, G. E. <strong>and</strong> Hollingsworth, F. H.: “Evaluation of Diverting Agent Effectiveness <strong>and</strong> CleanupCharacteristics Using a Dynamic Laboratory Model - High Permeability Case,” Paper SPE 8400,54th Annual Fall Mtg, Las Vegas, September 23-26, 1979.17. Hill, A. D. <strong>and</strong> Galloway, P. J.: “Laboratory <strong>and</strong> Theoretical Modeling of Diverting Agent Behavior,”Journal of <strong>Petroleum</strong> Technology (July 1984), 11 57-1 163.18. Houchin, L. R., Dunlap, D. D., Hudson, L. M. <strong>and</strong> Begnaud, P. C.: “Evaluation of <strong>Oil</strong>-SolubleResin as an Acid-Diverting Agent,” Paper SPE 15574 presented at the 61 st Annual TechnicalConference <strong>and</strong> Exhibition of the Society of <strong>Petroleum</strong> Engineers, New Orleans, October 5-8,1986.19. Coulter, A. W., Crowe, C. W., Barrett, N. D. <strong>and</strong> Miller, B. D.: “Alternate Stages of Pad Fluid <strong>and</strong>Acid Provide Improved Leakoff Control for Fracture Acidizing,” Paper SPE 6124 presented at the51 st Annual Fall Technical Conference <strong>and</strong> Exhibition of the Society of <strong>Petroleum</strong> Engineers ofAIME, New Orleans, October 3-6, 1976.20. Dill, W. R.: “A Gel Diverting Agent Used in Acidizing Treatments,” Halliburton Services, Production<strong>Engineering</strong>, 1978, 11 1-1 15.21. Burman, J. W. <strong>and</strong> Hall, B. E.: “Foam as a Diverting Technique for Matrix S<strong>and</strong>stone Stimulation,”Paper SPE 15575 presented at the 61st Annual Technical Conference <strong>and</strong> Exhibition of theSociety of <strong>Petroleum</strong> Engineers, New Orleans, October 5-8, 1986.22. Penny, G. S.: “Nondamaging Fluid Loss Additives for Use in Hydraulic Fracturing of <strong>Gas</strong> Wells,”Paper SPE 10659 presented at the SPE Formation Damage Control Symposium, Lafayette,March 24-25, 1982.23. <strong>King</strong>, G. E.: “Foam <strong>and</strong> Nitrified Fluid Treatments - Stimulation Techniques <strong>and</strong> More,” PaperSPE 14477 presented as a Distinguished Lecture during the 1985-86 SPE Distinguished LecturerProgram.24. Schriefer, F. E. <strong>and</strong> Shaw, M. S.: “Use of Fine Salt as a Fluid Loss Material in Acid FracturingStimulation Treatments,” Paper SPE 7570 presented at the 53rd Annual Fall Technical Conference<strong>and</strong> Exhibition, Houston, October 1-3, 1978.25. Miller, B. D. <strong>and</strong> Warembourg, P. A.: “Prepack Technique Using Fine S<strong>and</strong> Improves Results ofFracturing <strong>and</strong> Fracture Acidizing Treatments,” Paper SPE 5643 presented at the 50th AnnualFall Meeting, Dallas, September 28-October 1, 1975.26. Fry, W. C. D., Boney, C. L., Atchley, J. W. <strong>and</strong> Whitsett, F. T.: “The Use of 100 Mesh S<strong>and</strong> forImproving Acid Efficiency,” Paper presented at the Southwest <strong>Petroleum</strong> Short Course, Lubbock,79-82.27. Dill, W. R.: “Effect of Bridging Agents <strong>and</strong> Carrier Fluids on Diverting Efficiency,” Journal of<strong>Petroleum</strong> Technology (Oct. 1969), 1347-1 352.28. Pye, D. S. <strong>and</strong> Smith, W. A.: “Fluid Loss Additive Seriously Reduces Fracture Proppant Conductivity<strong>and</strong> Formation Permeability,” Paper SPE 4680 presented at the 48th Annual Fall Meeting ofthe Society of <strong>Petroleum</strong> Engineers of AIME, Las Vegas, September 30 - October 3, 1973.12-39
29 Canson, B. E.: “Lost Circulation Treatments for Naturally Fractured, Vugular, or Cavernous Formations,”Paper SPE/IADC 13440 presented at the SPE/IADC 1985 Drilling Conference, NewOrleans, March 6-8, 1985.30.Coberly, C. J. <strong>and</strong> Wagoner, E. M.,: “Some Considerations in the Selection <strong>and</strong> Installation ofGravel Packs for <strong>Oil</strong> Wells,” Journal of <strong>Petroleum</strong> Technology (Aug. 1938), 1-20.31. Mahajon, N. C. <strong>and</strong> Barrow, B. M.,: “Bridging Particle Size Distribution: A Key Factor in theDesign of Non-Damaging Completion Fluids,” SPE 8792, 4th Symposium on Formation DamageControl, Bakersfield, January 28 & 29, 1980.32.33.34.35.36.Super X Acid Technical Report, Dowell, DWL1313-26M-966.McBride, J. R., Rathbone, M. J., <strong>and</strong> Thomas, R. L.: “Evaluation of Fluoroboric Acid Treatment inthe Gr<strong>and</strong> Isle Offshore Area Using Multiple Rate Flow Test,” Paper SPE 8399 presented at the54th Annual Fall Technical Conference <strong>and</strong> Exhibition, Las Vegas, September 23-26, 1979.Gdanski, R.: “AICI3 Retards HF Acid for More Effective Stimulations,” <strong>Oil</strong> <strong>and</strong> <strong>Gas</strong> Journal (October1985), pp. 11 1-1 16.Jefferies-Harris, M. J., Coppel, C. P.: “Solvent Stimulation in Low Gravity <strong>Oil</strong> Reservoirs,” JPT(February 1969), pp. 165-1 75.<strong>King</strong>, G. E., Holman, G. B.: “Hydrocarbon Solvents: An Alternative to Acid for Removing SomeFormation Damage,” SPE 141 36, presented at the 1986 Internat. Mtg. on Pet. Eng., Beijing,March 17-20, 1986.37 * Douglass, B. C., <strong>King</strong>, G. E.: “A Comparison of Solvent/Acid Workovers in Embar Completions -Little Buffalo Basin Field,” SPE 151 67, presented at the Rocky Mountain Regional Mtg., Billings,MT, May 19-21, 1986.38.39.Minter, R. B., Davis, E. E., Conway, E. E.: “An Acid-Solvent Stimulation Technique for Low GravityCrudes,” SPE 31 89, 41st Calif. Reg. Mtg., October 28-30, 1970.Gidley, J. L.: “Acidizing S<strong>and</strong>stone Formations - A Detailed Examination of Recent Experience,”Paper SPE 141 64 presented at the 60th Annual Technical Conference, Las Vegas, September22-25, 1985.40. <strong>King</strong>, G. E., Holman, G. B.: “Quality Control at Well Site Optimizes Acidizing Economics,” <strong>Oil</strong> <strong>and</strong><strong>Gas</strong> J. (March 18, 1985), pp. 139-1 42.41. Jacobs, I.: “Asphaltene Precipitation During Acid Stimulation Treatments,” SPE 14823, FormationDamage Symposium, Lafayette, 1986.42. Moore, E. W., Crowe, C. W., Henrickson, A. R.: “Formation Effect <strong>and</strong> Prevention of AsphalteneSludges During Stimulation Treatment,” J. Pet. Tech. (September 1965), pp. 1023-1 028.J43. Holditch, S. A.: “Factors Affecting Water Blocking <strong>and</strong> <strong>Gas</strong> Flow from Hydraulically Fractured<strong>Gas</strong> Wells,” Paper SPE 7561 presented at the 53rd Annual Fall Technical Conference <strong>and</strong> Exhibitionof the Society of <strong>Petroleum</strong> Engineers of AIME, Houston, October 1-3, 1978.44. <strong>King</strong>, G. E., Lee, R. M.: “Adsorption <strong>and</strong> Chlorination of Mutual Solvents Used in Acidizing,” SPEProd. Eng. (May 1988), pp. 205-209.12-40
45. Anderson, W. G.: “Wettability Literature Survey - Part 1 : Wettability Measurement,” Journal of<strong>Petroleum</strong> Technology (November 1986), pp. 1246-1 262.46. Anderson, W. G.: “Wettability Literature Survey - Part 2: Wettability Measurement,” Journal of<strong>Petroleum</strong> Technology (November 1986), pp. 1246-1262.47. Anderson, W. G.: “Wettability Literature Survey - Part 3: Wettability Measurement,” Journal of<strong>Petroleum</strong> Technology (November 1986), pp. 1246-1 262.48. Anderson, W. G.: “Wettability Literature Survey - Part 4: Wettability Measurement,” Journal of<strong>Petroleum</strong> Technology (November 1986), pp. 1246-1262.49. Anderson, W. G.: “Wettability Literature Survey - Part 5: Wettability Measurement,” Journal of<strong>Petroleum</strong> Technology (November 1986), pp. 1246-1262.50. Anderson, W. G.: “Wettability Literature Survey - Part 6: Wettability Measurement,” Journal of<strong>Petroleum</strong> Technology (November 1986), pp. 1246-1262.51. Woodroof, R. A. <strong>and</strong> Anderson, R. W.: “Synthetic Polymer Friction Reducers Can Cause FormationDamage,” Paper SPE 6812 presented at the 52nd Annual Fall Technical Conference <strong>and</strong>Exhibition of the Society of <strong>Petroleum</strong> Engineers of AIME, Denver, October 9-12, 1977.52. McLaughlin, H. C., Elphingstone, E. A., <strong>and</strong> Hall, B. E.: “Aqueous Polymers for Treating Clay in<strong>Oil</strong> <strong>and</strong> <strong>Gas</strong> Producing Formations,” SPE 6008, New Orleans, October 3-6, 1976.53. Veley, C. D.: “How Hydrolyzable Metal Ions React with Clays to Control Formation Water Sensitivity,”J. Pet. Tech. (September 1969), pp. 11 11 -1 11 8.54. Reed, M. G.: “Stabilization of Formation Clays with Hydroxy Aluminum Solutions,” JPT, July1972.55. Gidley, J. L. <strong>and</strong> Hanson, H. R.: “Prevention of Central Terminal Upsets Related to Stimulation<strong>and</strong> Consolidation Treatments,” SPE 4551, 48th Annual Fall Mtg., Las Vegas, September 30-October 3, 1973.56. Coppel, C. P.: “Factors Causing Emulsion Upsets in Surface Facilities Following Acid Stimulation,”JPT, September 1975, pp. 1060-1 066.57. Delorey, J. R. <strong>and</strong> Taylor, R. S.: “Recent Studies Into Iron/Surfactant/Sludge Interactions inAcidizing,” Paper <strong>Petroleum</strong> Society of CIM 85-36-38 presented at the 36th Annual TechnicalMeeting of the <strong>Petroleum</strong> Society of CIM Held Jointly with the Canadian Society of <strong>Petroleum</strong>Geologists, Edmonton, June 2-5, 1985.58. Gidley, J. L.: “Stimulation of S<strong>and</strong>stone Formations with the Acid-Mutual Solvent Method,” J. Pet.Tech. (May 1971), pp. 551-558.59. Hall, B. E.: “The Effect of Mutual Solvents on Adsorption in S<strong>and</strong>stone Acidizing,” JPT (December1975), pp. 1439-1 442.60. <strong>King</strong>, G. E., Brown, T. M.: “Performance of Amoco A-Sol as a Mutual Solvent System,” SWPSC,April 1978, Lubbock.12-41
61. Crowe, C. W., Martin, R. C., <strong>and</strong> Michaelis, A. M.: “Evaluation of Acid Gelling Agents for Use inWell Stimulation,” Paper SPE 9384 presented at the 55th Annual Fall Technical Conference <strong>and</strong>Exhibition, Dallas, September 21-24, 1980.62. Pabley, A. S. <strong>and</strong> Holcomb, D. L.: “A New Stimulation Technique: High Strength CrosslinkedAcid,” Paper SPE 9241 presented at the 55th Annual Fall Technical Conference <strong>and</strong> Exhibition,Dallas, September 21 -24, 1980.63. Church, D. C., Quisenberry, J. L., <strong>and</strong> Fox, K. B.: “Field Evaluation of Gelled Acid for CarbonateFormations,” Journal of <strong>Petroleum</strong> Technology (December 1981), pp. 2471 -2473.64. Gougler, P. D., Hendrick, J. E., <strong>and</strong> Coulter, A. W.: “Field Investigation Identifies Source <strong>and</strong>Magnitude of Iron Problems,” Paper SPE 1381 2 presented at the SPE 1985 Production OperationsSymposium, Oklahoma City, March 10-12, 1985.65. Smolarchuk, P. <strong>and</strong> Dill, W.: ‘;Iron Control in Fracturing <strong>and</strong> Acidizing Operations,” Paper <strong>Petroleum</strong>Society of CIM 86-37-28 presented at the 37th Annual Technical Meeting of the <strong>Petroleum</strong>Society of CIM, Calgary, June 8-11, 1986.66. Antheunis, D, Davies, D. R <strong>and</strong> Richardson, E. A.: “Field Application of In-Situ Nitrogen <strong>Gas</strong>Generation System,” Paper SPE 9653 presented at the Middle East <strong>Oil</strong> Technical Conference ofSPE; Manama, Bahrain; March 9-12, 1981.67. Collesi, J. B., Donavan, S. C., McSpadden, H. W. <strong>and</strong> Mitchell, T. I.: “Field Application of aChemical Heat <strong>and</strong> Nitrogen Generating System,” Paper SPE 12776 presented at the 1984 CaliforniaRegional Meeting, Long Beach, April l 1-1 3, 1984.68. McSpadden, H. W., Tyler, M. L. <strong>and</strong> Velasco, T. T.: “In-Situ Heat <strong>and</strong> Paraffin Inhibitor CombinationProve Cost Effective in NPR #3, Casper, Wyoming,” Paper SPE 15098 presented at the 56thCalifornia Regional Meeting of SPE, Oakl<strong>and</strong>, April 2-4, 1986.69. Ashton, J. P., Credeur, D. J., Kirspel, L. J. <strong>and</strong> Nguyen, H. T.: “In-Situ Heat System StimulatesParaffinic Crude Producers in Gulf of Mexico,” Paper SPE 15660 presented at the 61 st AnnualTechnical Conference <strong>and</strong> Exhibition of SPE, New Orleans, October 5-8, 1986.70. Collesi, J. B., McSpadden, H. W. <strong>and</strong> Scott, T. A.: “Surface Equipment Cleanup Utilizing In-SituHeat,” Paper SPE 1621 5 presented at the SPE Production Operations Symposium, OklahomaCity, March 8-10, 1987.71. Hoch, O., Fredrickson, S., Norman, L. <strong>and</strong> Walker, M. L.: “Heated Acids for Improved StimulationResults,” Paper CIM 86-37-68 presented at the 37th Annual Technical Meeting of the <strong>Petroleum</strong>Society of CIM, Calgary, June 8-1 1, 1986.72. Straub, T. J., Autry, S. W., <strong>King</strong>, G. E.: “An Investigation Into Practical Removal of Downhole Paraffinby Thermal Methods <strong>and</strong> Chemical Solvents,” SPE 18889, Production Operations Symposium,Oklahoma City, March 13-1 4, 1989, pp. 577-584.12-42
Appendix 12.A - Diverters <strong>and</strong> Fluid LossGranular SaltThe 1 00-mesh salt product is a range of salt sizes varying between approximately 70 <strong>and</strong> 140-mesh.Salt is one of the easiest carried diverters <strong>and</strong> can be used in any well which produces water or in anywell which can be flushed with water.24 The salt may be pumped only in oil, saturated brines, in concentratedacids, <strong>and</strong> in weak acids which have been salt saturated. A graph of the solubility of salt inacid is shown in Figure 12.30. Once placed, the salt is soluble in almost all produced waters, mostspent acids <strong>and</strong> aqueous overflushes. The 100-mesh salt is most effective on perforations <strong>and</strong> naturalfracture s<strong>and</strong> is easily removed, Figure 12.31.Dive rte r100 M esn S<strong>and</strong>Granulated Salt (no polymer)Resin DispersionBenzoic AcidNaphthalenePolymerAverage Percent of Initial Permea bi i ityRegainedAfter First 1/4" of Injection Face Removed100%100%'92%82%77%74% (Typical)Figure 12.31: Penetration <strong>and</strong> Removal of Various Diverters100-Mesh S<strong>and</strong>The 100-mesh s<strong>and</strong>, sometimes referred to as Oklahoma No. 1, has a size distribution roughlybetween 70- <strong>and</strong> 140-mesh. This s<strong>and</strong>, which has been used in fracturing treatments, is not an effectivepropping agent but rather a fluid loss or diverter materia1.25~26 The s<strong>and</strong> is carried by acid, brine,oil, water, or gelled water, <strong>and</strong> is a good diverting agent for perforations or natural fractures. S<strong>and</strong> isnot recommended in matrix acidizing of an unfractured well since it cannot be removed from the perforationby any assurable method. The use of 100 mesh s<strong>and</strong> is generally discouraged due to damageon pumps as it is produced back. Where it is required, a temporary pump is usually run for one to twoweeks after the treatment to allow the well to clean up.Calcium CarbonateCalcium carbonate is available in sizes from crushed oyster shells <strong>and</strong> pea size granules to powder.This material is a fill type diverter that can be used in high rate chemical matrix treating <strong>and</strong> then laterremoved with acid. It can be placed with a gelled brine. It is not recommended for diverting in matrixacidizing treatments since it is very rapidly soluble in HCI. Calcium carbonate comes in a wide rangeof sizes, Figure 12.32. The most effective size range to bridge <strong>and</strong> seal is from 1/6 the pore size toabout 7 times the pore size.NaphthaleneNaphthalene flakes are a whitish, thin flake-type diverter with a density of 1.2. They are soluble inxylene, toluene, condensate, <strong>and</strong> in a gas stream by sublimation. Naphthalene has been used successfullyin reservoirs to divert acid; however, flake type diverters should not be used in loadings over1 Ib/perforations or where there are very small perforations (such as through tubing perforations). Inthis situation, the flake type diverters may jam together <strong>and</strong> be extremely difficult to unload when the12.A-43
well is turned around for backflow. Naphthalene flakes may be placed by acid or water but should notbe placed with a polymer water. The polymer coats the naphthalene flake <strong>and</strong> makes it very difficult todissolve the flake in its normal solvents. If naphthalene flakes are used, a small overflush (15-20 gal/ft) of xylene, toluene, or condensate is recommended to help remove the material. Without thesolvent, naphthalene is still removable by gas, Figure 12.33, although only the material in the path ofthe gas can be removed. Removal by sublimation is also dependent upon the temperature of the gasstream.Benzoic Acid FlakesBenzoic acid flakes, which physically resemble naphthalene flakes, are also limited in their use towells with relatively large perforations or natural fractures. Benzoic acid flakes are soluble in water,acid, oil, <strong>and</strong> in gas by sublimation. They may be placed by acid or water but not by polymer water forthe same reason as naphthalene flakes. Benzoic acid flakes should not be used in gas wells with atemperature below 120°F since the removal by gas sublimation at low temperature is extremely slow,Figure 12.33.Wax BeadsWax beads are small wax pellets. They may be placed by water or acid solutions <strong>and</strong> can only beremoved by hydrocarbons at certain temperatures. Solubility in oil follows the softening step at temperature.When using this material, select an oil softening point at least 20°F below the static bottomholetemperature. Although these materials can be easily transported by water or acid <strong>and</strong> areeffective in fluid control, Figure 12.34, their density of 0.8 causes them to float <strong>and</strong> makes them ineffectivein most matrix operations where pump rate is not in turbulence.Organic Resin BeadsOrganic resin beads have a size range of -70 to +140 mesh. They are available as a dry additive thatmay be placed with acid <strong>and</strong> are effective in slowing the acid rate into a perforation or a fracture. Thebeads are soluble in xylene, toluene; condensate, <strong>and</strong> very slowly soluble in oil. They may be placedin any aqueous solution <strong>and</strong> are normally run at the rate of about 1/4 to 1/2 Ib per perforation, orapproximately 1 to 2 Ib/ft of open hole. The density is 1.04, thus they can be easily transported inwater or matrix treating acids <strong>and</strong> can be used in either normal matrix treating, interface treating or inany non-oil fracturing fluid. The organic resin diverters cannot be used where a mutual solvent or aromatic-aciddispersion is used since the diverter would be prematurely dissolved. The resin beads canbe used in mixtures of methyl or isoprdpyl alcohol <strong>and</strong> acid or water. A small hydrocarbon overflushmay be useful after an acid job where beads are used.Organic Resin DispersionsThe organic resin dispersions are effective as a fluid loss agent in oil or wet gas wells where there areno significant natural fractures. If there are natural fractures, very large quantities of this materialwould be required for fluid loss control since it does not bridge the natural fractures. The material canbe placed by either water or acid solution <strong>and</strong> is soluble in any hydrocarbon production or overflush. Asmall hydrocarbon overflush (15-20 gal/ft) of xylene, toluene, or condensate can be used after theacid treatment to speed cleanup.Micron Size ParticulatesVery rapid fluid loss control may be achieved by the micron size particulate diverters. The particles aresmall enough to be carried with the placement fluid (acid, water or oil) as a dispersion <strong>and</strong> can beused for any matrix operations in formations which are not significantly naturally fractured. Thesematerials are effective in reducing fluid loss, however, they do create a significant amount of formationdamage since they do not have a solvent.12.A-44
PolymersNon-crosslinked polymers control leak-off by viscosity control <strong>and</strong> are often associated with othertypes of fluid loss control. These materials, which are usually guar or a chemically modified guar, areeffective in controlling fluid loss in formations, Figure 12.35, but may achieve fluid loss control bybuilding a filter cake of polymer debris (wall building). At higher permeabilities, crosslinked polymergels should be considered. Polymer usage generally ranges in concentrations from 10 to approximately50 Ibs/lOOO gal. Acid solutions can be gelled by special polymers, but these materials are usuallynot used in matrix acidizing since they reduce the acid flow into all zones.OthersMaterials such as paper, shredded cloth or leather, grain, or sawdust are not recommended since permanentpermeability damage is produced.12.A-45
Chapter 13: Frac WingHydraulic fracturing is a technique that establishes a crack through part of the formation. If the crackremains open, either by use of solid proppant or if a fluid such as acid creates channels in the face ofthe fracture, the reservoir fluids may more easily flow toward the wellbore. Fracturing may be accomplishedby liquid or gas pressure, mechanical action or explosive force.In the 1860s, nitroglycerine was detonated in the wellbores of low permeability Pennsylvania oils<strong>and</strong>s. This practice produced increases in flow, although such increases were often temporary <strong>and</strong>wellbore was often destroyed. The ability of fluid to “break down” the formation was first noticed inwater injection wells, where injecting water above a certain pressure would cause a substantialincrease in injection rate that could not be explained by flow through the matrix at higher pressures.Another piece of evidence of a disturbance of matrix flow was increased production in wells where thecasing was run fast.In the late 1940s, hydraulic fracturing was recognized as a potential stimulation process. In the firstexperiments, using gelled oil <strong>and</strong> a small amount of s<strong>and</strong>, it was concluded that the process didincrease production but not as much as the st<strong>and</strong>ard acidizing treatment. Subsequent experiments<strong>and</strong> improving fluid <strong>and</strong> proppant technology made the fracturing technique a routine stimulation process.From 1949 to 1981, about 800,000 fracture treatments were performed.’ About 35 to 40% of allrecently drilled wells are fractured <strong>and</strong> the percentage is increasing as fracturing is recognized as adamage bypass tool in higher permeability reservoirs.2The most common fracturing process creates a crack in the rock by liquid or injected gas pressure.14Other techniques, such as explosive fracturing, use exp<strong>and</strong>ing gas from a propellant or explosivereaction to fracture or shatter the f~rmation.~ Although explosive fracturing is the oldest form of fracturingit does not compare (in stimulation of an undamaged well) to the production increases availablefrom long fractures of a hydraulic fracture stimulation.In the hydraulic fracturing process, the fracturing fluid is injected at a rate faster than the fluid can leakoffthrough the matrix of the rock. This results in a pressure rise that breaks the formation. Continuedpumping widens the fracture <strong>and</strong> extends it out from the wellbore. The growth of the fracture is theobject of a great many papers <strong>and</strong> much argument in the industry. The fracture most likely exp<strong>and</strong>sout from the wellbore in a radial fashion; gaining height, width <strong>and</strong> length. Total height growth will verylikely equal the length growth unless beds above <strong>and</strong>/or below the pay zone have significantly differentmodulus of elasticity <strong>and</strong> sufficient thickness to contain the fracture. It is also commonly believedthat the fracture will extend out in both directions from the well. Prediction of growth of the fracture willbe covered in the next section.When water, oil or foam are the fracture fluids, a proppant, such as s<strong>and</strong>, is injected in the liquid. Thisproppant keeps the formation stresses from closing the fracture after the hydraulic fracturing pressurehas been released. If the conductivity (ability to flow) of this propped fracture is significantly greaterthan that of the formation, the production rate will be increased.Recovery by FracturingUse of fracturing to increase recoverable reserves is always an economic judgement <strong>and</strong> is veryheavily controlled by reservoir factors (permeability, pressure <strong>and</strong> fluid viscosity) plus the fracture variables(length, height, width, total reservoir contact, <strong>and</strong> the all-important conductivity). In a eutopianview, a single perforation in a single well can drain an entire reservoir; given sufficient time <strong>and</strong> pressuredrawdown. But, the drainage achieved in this manner is in no way efficient. Increasing the rate ofdepletion requires more wells, complete exposure of the pay, <strong>and</strong> often requires improving the flowpath from the formation toward the wellbore. This improved flow path, the fracture, can improve therate in some reservoirs. Selecting the best reservoirs to fracture <strong>and</strong> the best fracture design for an13-1
individual reservoir is a matter of concern for a computer based simulator. In general, the useful fracturelength will increase as formation permeability <strong>and</strong> produced fluid viscosity decrease. For theexample of a gas well, Figure 13.1, a plot of fracture half-length versus formation permeability showsvery short or no frac length needed at formation permeabilities of approximately 100 md.6 The samedata will also show that needed half-lengths increase to thous<strong>and</strong>s of feet to effectively drain a gasreservoir with a permeability of 0.01 md or less.Fracturehalf length.10OO's ftI 1 I I1I~onvcntiona~Figure 13.1:(Elkins, SPE)Estimate of the usable fracture half lengths for gasproduction based on formation permeability. Thiswork ignores the benefits of damage bypass.The practical side of improved recovery by fracturing deals with the economic recovery of the hydrocarbonfrom the reservoir. Wells can only be operated as long as the flow rate from the well provideseconomic incentive to offset the costs of well operation <strong>and</strong> provide a reasonable profit. In wells wherethis rate is too low initially or has become too low by depletion of the reservoir near the wellbore, fracturingmay be a viable alternative for increasing flow rate.Fracturing EconomicsHydraulic fracturing is the only proven stimulation method for significantly increasing both the rate <strong>and</strong>the total recovery from low permeability reservoirs. The design of the fracture treatment has threebasic requirements that are directly affected by the reservoir, fluid type, <strong>and</strong> by economics:*1. Determine what oil/gas rate <strong>and</strong> recovery might be expected from various fracture lengths <strong>and</strong>fracture conductivities for conditions in a given reservoir.2. Determine the fracture treatment design to achieve the desired fracture lengths <strong>and</strong> conductivities.3. Maximize economic returns by comparing fracture costs <strong>and</strong> return on investment of the moneyspent on fracturing.Designing a fracture treatment is usualiy done with a computer simulator that can provide simultaneouslycalculated values of rates, recovery, <strong>and</strong> economic value from inputted data. Figure 13.2 containsplots from a reservoir simulator/hydraulic fracturing simulator program. The data shows that fraclength can be a definite factor in some reservoirs in revenue generated by a well by combining data ontreatment volume (<strong>and</strong> cost of treatment) versus fracture length with the revenue generation data. A13-2
plot of fracture length versus revenue-less-cost can pinpoint the optimum fracture length <strong>and</strong> the treatmentsize.HydrafraeSimulator t+;UvI!RevenueLOSSIFracture Length9Years LengthFracture Length Length(Veatch)Figure 13.2: A total concept approach to fracture design using reservoir<strong>and</strong> hydrafrac simulators to reach an estimate of economicfracture length.Fracturing Length <strong>and</strong> Conductivity DecisionsHydraulic fracturing is a well stimulation technique that has tremendous utility in increasing production.Like almost all systems, determining the optimum treatment design requires the engineer to considerthe characteristics of the reservoir as a flowing system <strong>and</strong> pick the type of fracture treatmentthat is most useful for the reservoir <strong>and</strong> well characteristics. The success of a fracture treatment isdependent on the fracture providing sufficient fracture flow capacity or conductivity to act as a preferentialpathway (lower restrictive backpressure) for reservoir fluids to flow to the wellbore. The contrastin conductivity between the fracture <strong>and</strong> the formation determines how long the effective fracture canbe. Fractures cost money to create <strong>and</strong> prop open. If the fracture conductivity is low in comparison tothe formation permeability, then only a short fracture can be economically justified. When the conductivityof the fracture is high in relationship to the formation permeability, then a much longer fracture isjustified. Advances in fracturing technology have made higher conductivity fractures possible. Thishas increased the population of wells where fracturing can be effectively used.There are two basic reasons for hydraulic fracturing a reservoir; either, or in some cases both can besound engineering <strong>and</strong> economic reasons.1. Where the fracture conductivity is high in comparison to the formation permeability, fractures areusually economic. Other considerations are the viscosity of the flowing fluid <strong>and</strong> the mechanicallimits in placing a fracture in the productive zone.2. Where formation damage is obstructing the path to the wellbore <strong>and</strong> the fracture can penetratethrough the damage layer <strong>and</strong> provide a conductive path between reservoir <strong>and</strong> wellbore. Thisdamage can include true formation damage causes <strong>and</strong> mechanical effects such as turbulence(non Darcy effects).Many authors have tried to numerically quantify the effect of fracturing <strong>and</strong> relate it to a process thatcan be mathematically modeled. The best approaches have been to relate the fracture <strong>and</strong> formationconductivities to a fraction of the wellbore drainage that can be penetrated with a fracture. Althoughsomewhat theoretical, the models built with this approach allow the engineer to look at the most effectivefracture penetration distance for a projected increase in rate. The economic simulators built intothe models can then compare the revenue generated by the fracture <strong>and</strong> compare it against the cost13-3
of the fracture. The optimum length of the fracture can then be calculated. The typical measure offracturing success is the folds of increase, FOI, that a fractured well produces (Qf) in comparison tothe production from an unstimulated well with a skin of zero (QS=J.FOI = Qf/ Qs-oThe dimensionless fracture capacity, FCD, describes the relationship between fracture's ability to flowfluids to the wellbore <strong>and</strong> the ability of the formation to flow fluids into the fracture. The equation is:FCD = dimensionless fracture capacitykfw = fracture flow capacity, md-flk = formation permeability, mdxf = fracture length, ft.For a low value, FcD c 1.6, the reservoir fluids would rather flow through the reservoir towards thewellbore than towards <strong>and</strong> through the fracture. In these low FCD cases, long fractures are not justified.For a moderate value, FCD = 10, fractures return good FOI values. FCD'S over 30, are consideredinfinite conductivity for practical purposes. Fracture length generally has the greatest impact onlow permeability reservoirs flowing low viscosity fluids (gas). Production from wells with higher viscosityfluids such as oil are also positively impacted by fracturing, but competing processes such aslong horizontal wells (with fractures) may be more effective, depending on circumstances. There mayalso be a time related factor in production enhancement, as some wells will not show immediate, largeproduction increases from a fracture while reservoir pressures are high, but will retain deliverabilityover an unfractured well when the pressure starts to drop. This is the result of the higher permeabilitypathway of the fracture. In long term projections, such as Figure 13.3, a case of a low permeabilitygas formation, the increased recovery from longer fractures is very significant over time.FRACTURE LENGTHI0 2 4 6 8 10 12 14 16 18 20 22 24mM (Wrs)Figure 13.3:13-4
Producing fluids in a reservoir with less than infinite permeability produces pressure gradients throughthe formation. This occurs simply because the fluids closest to the wellbore feel the greatest drawdown<strong>and</strong> are produced easiest. In steady state flow, the gradient or pressure contours through theformation will show where the fluids have produced <strong>and</strong> will indicate the prevalent flow paths. Thepressure contours near fractured wells low <strong>and</strong> high permeability reservoirs will be different, simplybecause the pathways in a high permeability well are predominately toward the wellbore through theformation, while the pathways in a low permeability formation are towards the fracture. Figure 13.4illustrates these results. Note that the flow in the low permeability has been changed by the fractureinto predominately linear flow. The fracture in the high permeability reservoir probably affects the flowpattern near the wellbore where converging radial flow is restrictive.~~ ~Pressure Distribution <strong>and</strong>Approximate Stresmlines, Reservoir K =0.005 md.Figure 13.4:The difference in the effect of the fracture on flow patterns in the high <strong>and</strong> low permeability reservoirsis the flow capacity of the fracture. The ratio of the fracture permeability to the formation permeabilitybecomes a good first indicator as to whether a fracture will be useful in a formation.The flow capacity of the fracture is dependent on several items:1. The size of the proppant. Larger sizes have higher permeability than smaller sizes, but do notsupport the fracture closure load as well.2. The strength of the proppant. The weaker proppants drop in flow capacity very quickly becauseof fines created by broken grains. Stronger proppants, although more expensive <strong>and</strong> often moreabrasive preserve flow capacity at higher closure pressures, Figure 13.5.3. The roundness of the proppant. Angular s<strong>and</strong>s have about the flow capacity of rounder manmadeproppants at high closure stress. They also break easier, producing fines that canseverely reduce fracture conductivity. A 5 to 7% proppant breakage rate during placement canreduce pack permeability by 30 to 40%.4. Fracture width <strong>and</strong> the concentration of the proppant in the fracture. The thicker the proppantpack, the higher the concentration of proppant in the fracture (<strong>and</strong> the better the flow capacity).Thicker packs are harder to place because the fracture has to be made wider. Increasing fracturewidth can usually be done by increasing fluid flow rate or viscosity, both cause higher in-situfracture pressures <strong>and</strong> generate width. Width is also necessarily related to fracture height <strong>and</strong>,to a much less extent, to fracture length.13-5
5.6.7.The embedment of the proppant into the wall of the fracture. Embedment reduces the amount ofpore space between the proppant grains by burying part of the grain in the wall <strong>and</strong> by extrudingmaterial up from the wall to fill other pores.The damage within the fracture pack. Damage mechanisms are numerous. The most commonare: fines produced by proppant breakage; fines from the formation; polymer residue from stimulationfluids, organic deposits (wax, asphaltenes, etc.); mineral scale; salt: <strong>and</strong> biomass.The closure stress of the formation. The closure stresses (both horizontal <strong>and</strong> vertical) are dueto tectonic forces, plus the local effects caused by the actual lateral fracture displacement.Although usually related to depth, the closure stresses can be more accurately measured by insitutesting. Where testing is not available, the closure has been estimated at about 30% to 50%of overburden.8.Turbulence effects. Turbulence shows up as a rate sensitive skin, limiting increases in flow asthe pressure drop is increased. By running step tests (4-point test for example) at differentrates, the effects of turbulence can be identified.1000800U800400aooOO*p 100g 8080.Ig 40k aoit 20Uzr' 1086Figure 13.5:11 I 1 . i I I I I1 a s T ii %a 1sCLOSUIL STRESS, Dat to 1000'0The flow capacity of the fracture, kfw, is available from most service companies <strong>and</strong> a few of the largeroil companies have run their own tests for specific conditions. The critical thing to remember is thatthe actual fracture conductivity is about 10 to 30% of published, short term conductivity data measuredbetween steel plates. A fracture with a finite flow capacity has a pressure drop along its lengththat is proportional to the flow capacity, kfw. All created fractures have finite or limited flow capacity,but some fracture flow capacities are so high with relation to the formation permeability that theybehave as if they had infinite flow capacity.Where in-situ values of kfw are not available, use of the following estimation is suggested:Expected kfw = 0.3 [(kfw lab data at Ib/ft2) / (Ib/ft2 expected)]13-6
For this case, we will look at a simple model based on flowing fluid viscosity <strong>and</strong> reservoir permeability.The flow capacity, FCD, we require will be about 10 (fracture flow capacity ten times the formationpermeability). FCD’S less than 10 are less successful stimulations (provides low FOI).The direction that a fracture extends into the reservoir is controlled by the formation stresses <strong>and</strong> cannotbe influenced away from the wellbore. The fracture growth direction is perpendicular to the planeof least principle stress. Fractures are overwhelmingly vertical <strong>and</strong> few cases are known of horizontalfractures.For higher permeability formations, the effect of a fracture has been proposed by Prats to be equivalentto an enlargement of the wellbore. This is roughly equivalent to under-reaming the wellbore, butwithout the damage of drilling fluids. If taken further, the folds of increase from an enlarged wellborewould be:FOI = Qf / Qs=O = [ In(r&,) / ln(rJr’w)]re = external drainage radiusr, = actual wellbore radiusr’, = effective wellbore radius (allowing for effects of fracture)Prats graphically presented the relationship between r’, <strong>and</strong> dimensionless flow capacity inFigure 13.6; <strong>and</strong> yields FCD. The figure shows that for FCD > 30, that r’, = 0.5 xf; the fracture thusbehaves as an infinitely conductive flow path <strong>and</strong> there is no benefit from increasing fracture conductivity,but frac length increases may be useful if frac economics are justified. Using Figure 13.6another way shows that for declining Fc, values, length is less significant <strong>and</strong> for low values of conductivity,i.e., an FCD of e 0.3, that r’, depends only on frac conductivity <strong>and</strong> is independent of fraclength. Figure 5 tells the engineer where the fracture design money should be spent: increasing conductivityor increasing length.1 .oo0.100Figure 13.6:13-7
Example 13.1If the reservoir permeability is 10 md, fracture conductivity is 1000 md-ft, fracture half length is 500 ft,wells are 2000 ft apart (re = 2000/2 = 1000 ft) <strong>and</strong> casing = 5.5 (rw = (5.5/2)/12) = 0.229”):FCD = 1000/(10 x 500) = 0.2From Figure 13.7, r’, / xf = 0.048 for an FCD of 0.2r’, = 0.048 xf = 0.048 x 500’ = 24 ftFOI = [ In(rdr,) / In(rJr’,)] = [In(l000/0.229)/ In (1000/24)] = 7.6313.73 = 2.04Example 13.2What effect on FOI would doubling the frac length in example 13.1 have? xf = 1000 ftExample 13.3FCD = 1000/(10 x 1000) = 0.1From Figure 13.7, r’, / xf = 0.024 for an FCD of 0.1rtW = 0.024 xf = 0.024 x 1000’ = 24 ftFOI = [ ln(rdr,) / In(rJr’,)J = [In(l000/0.229) / In (1000/24)] = 7.63/3.73 = 2.04No change in FOI (but cost of fracture went up).What effect on FOI would doubling the conductivity in example 13.1 have?FCD = 2000/(10 x 500) = 0.4From Figure 13.7, r’, / xf = 0.09 for an FCD of 0.4r’, = 0.09 xf = 0.09 x 500’ = 45 ftFOI = [ ln(r,Jrw) / In(rJr’,)] = [In(lOOO/O.229)/ In (1000/45)] = 7.63/3.1 = 2.45FOI increased by 20%In most cases, for FCD’S less than 0.5, increasing xf is a waste of money. When FCD is large (>25),however, money should be spent on increasing fracture length, not on increasing flow capacity.The FOI may be found directly by Figure 13.7 (a modified version of Figure 13.6). This graph uses theFOI calculated by FOI, on the left vertical axis. On the far right axis are xf/re values <strong>and</strong> the horizontalaxis is kfw/k re. The values of k <strong>and</strong> re should be known from reservoir information <strong>and</strong> kfw is availablefrom service company tables <strong>and</strong> graphs.Example 13.4If an FOI of 2 is desired for a well on 160 acre spacing (re = 1320’), where k = 1 md, <strong>and</strong> kfw =1500 md, what is the xf needed?Find intersection of FOI <strong>and</strong> re <strong>and</strong> go across graph to intersection of vertical line from FCD, then followcurve to right axis to get Xf/re = 0.75. Since re is 1320, xf = 990 ft.The steps are shown on the graph in Figure 13.8.13-8
Figure 13.7:Note that the curve can also be used to back calculate a necessary flow capacity for a chosen FOI ifthe maximum fracture length is known.Frac length <strong>and</strong> conductivity ace design objectives for the needed result of the fracture stimulation. Toachieve these objectives, a fracturing plan is formed consisting of material selection <strong>and</strong> pumpingschedule.Hydraulic fracturing is one of the most heavily modeled areas (along with reservoir performance) inthe oilfield. Although mathematics is an exact science, the exactness is tied to the assumptions madein the modeled behavior <strong>and</strong> the'input data. Formations, on the other h<strong>and</strong>, are very free to do whatstresses dictate <strong>and</strong> engineering attempts to model them really are nothing more than estimations.Even within those limits, the models are useful to indicate what may occur. When combined with fieldexperience of fracture application <strong>and</strong> production performance, along with data analysis <strong>and</strong> testing,the models become more accurate <strong>and</strong> useful. Experience with models in an area is a critical factor insuccess of a fracturing program. Even with well designed <strong>and</strong> applied jobs, the first few wells in anarea may be failures. With good post-mortem analysis <strong>and</strong> perseverance, almost any formation canbe successfully fracture stimulated.Fracture application starts with an examination of the continuity equation:Volume pumped = volume lost + volume in the fracture, orSimply put, the equation says the fracture volume is equal to the volume of fluid pumped less that volumelost to the reservoir through leakoff. Before going further, the user has to realize that the fracturethat is created may not stay within the zone <strong>and</strong> can, in some cases, grow up <strong>and</strong>/or dawn; thus thecreated fracture may or may not be useful in delivering the design parameters of conductivity <strong>and</strong>length. Further, creating a perfectly shaped fracture does not assure that the fracture is sufficiently13-9
propped to meet conductivity. Only where proven well deliverability consistently matches fracture performanceprediction, does the fracture meet design specifications.Aside from orientation concerns, the dimensions of a frac that are of concern are the width, length <strong>and</strong>height of the fluid filled fracture <strong>and</strong> the effective width, length <strong>and</strong> height of the propped fracture.Since the fracture parameter that is most often mentioned is length, an examination of the factors inrelation to length is in order. The volume of a fracture is the product of its length, width <strong>and</strong> height.Figure 13.9 is output from a fracturing simulator showing relationship between fracture height <strong>and</strong>fracture length for a 300,000 gallon frac design in a low permeability reservoir. Note that the fracturelength rapidly decreases as fracture height increases. Fracture height is controlled by bounding bedsaround the frac zone <strong>and</strong> only a few controllable variables have any control on fracture height.-dIFigure 13.8:In a similar way, fluid leakoff alters the fracture length that is attainable with a set volume of fluid in asituation where fracture height is controlled. The difference in fracture length between the low <strong>and</strong>high leakoff areas of Figure 13.1 0 is very significant, <strong>and</strong> in some cases, leakoff can govern whetheran effective fracture can be created.Fracture width is the final major factor controlling fracture length generation. Although the differencebetween an average fracture width of 0.25” <strong>and</strong> an average fracture width of 0.5 seems insignificant,it doubles the stored volume of fluid required or reduces the fracture volume described by length xwidth x height by half for constant volume of fluid. Width is generated during the job by pressureapplied by the frac fluid. Controlling fluid loss is required for improving fracture efficiency. The mostcommon leakoff control is by viscosity or fluid rate: rate offsets leakoff <strong>and</strong> increased fluid viscositycontrols (reduces) leakoff. When leakoff is controlled, length <strong>and</strong> height can increase, which allowmore width to develop. Creating only one fracture also raises the efficiency of the fracture fluid; this isa concern in a deviated wellbore.13-10
Figure 13.10 Leakoff Effect onFrac Length-15001000 -'500w II+ * 0rn A +I+ high leakoff8 low leakoffFigure 13.10:Since width is critical to fracture conductivity, <strong>and</strong> fracture length <strong>and</strong> conductivity are critical to productivity,there is a balancing act to get the fracture geometry which best optimizes well performance.The relationship between fracture width, wf, <strong>and</strong> flow capacity, F ~D, is linked through the filling of thewidth with high quality proppant that will maintain permeability when stresses are applied.Figure 13.11 (from Halliburton Frac Book II) is a general relationship between the amount of s<strong>and</strong>required to fill a frac of any width. The next step is to find the proppant that will support the load, asshown in individual cases of proppant flow capacity at various stress levels from tests between steelplates (Halliburton Frac Book 11). The final step is to determine what volume of fluid, pumping schedule<strong>and</strong> leakoff control is required to place the proppant.The next step is to look at frac design. This is where the fracture models <strong>and</strong> experience in an areaare used to good advantage.13-1 1
The above data are for s<strong>and</strong> with a specific gravityof 2.65. To correct the proppant concentration/width ratio for proppants of other densities, use thefollowing equations:w (other prop) = w (graph)2.65SG (other prop)-Or-Conc (other prop) = Conc (graph) SG (Other prop)2.65NOTE: For a proppant density other than 2.65, it isnecessary that only one correction be made.If the proppant density is 2.65, no correctionis necessary even if the proppant is somematerial other than s<strong>and</strong>.(from Halliburton Frac Book 2)Figure 13.11:13-12
FRACTURE FLOW CAPACITYVSCLOSURESTRESSIN FRACTURE FOR 20140 INTERMEDIATESTRENGTH BAUXITE ON STEEL PLATEScPc.wCLOSURE STRESS (PSI)CLOSURE STRESS (PSI)0
FRACTURE FLOW CAPACITYvsCLOSURESTRESSIN FRACTURE FOR 40/70 INTERMEDIATESTRENGTH BAUXITE 3N STEEL PLATESFRACTURE FLOW CAPACITYI . VSCLOSURESTRESSIN FRACTURE FOR 20140 INTERMEDIATESTRENGTH BAUXITE ON STEEL PLATESCLOSURE STRESS (PSI)CLOSURE STRESS (PSI)
Fracture DesignFracture Length <strong>and</strong> Width - ModelingCalculation of the fracture length <strong>and</strong> conductivity is done by one of several studies on two basic modelsused in fracturing research.Models have been developed to predict fracture height, length <strong>and</strong> width based on assumptions madefor the types of formations involved.8t15’8 The basic models are those developed by Perkins & Kern,”which predicts a narrow, long fracture <strong>and</strong> the Geertsma <strong>and</strong> DeKlerk15 model on Khristianovic18equations predicts a shorter, wider <strong>and</strong> taller fracture.Development of the Perkins <strong>and</strong> Kern model begins with an expression of fracture width in terms offracture height:The Geertsma-DeKlerk width is in terms of fracture length:where:w = fracture width, fthf = fracture height, ftxf = fracture length, wellbore to tip, ftE = Young’s modulus of elasticityp = fracture extension pressure, psiBy combining Newtonian flow equations that relate fracture extension pressure to injection rate <strong>and</strong>fracturing fluid viscosity, the fracture pressure, p, for the Perkins <strong>and</strong> Kern model becomes:P-( Pp9ix,)o.uh fAnd, for the Geertsma-DeKlerk model:where:p= fracturing fluid viscosity, cp13-15
9i= fracturing fluid injection rate, BPMFor a constant set of conditions, the P-K model predicts fracture extension pressure (as measured atthe wellbore) increasing proportionally to fracture length raised to the one-fourth power. TheGeertsma-DeKlerk model predicts pressure decreasing proportionally to fracture length raised to theone-half power. A comparison of fracture design calculations for the different fracturing models (fromVeatch) are contained in Figure 13.12.21 G~~~~~ 1 Daneshy I P-K 1 Nordgren I(Veatch)Figure 13.12: A comparison of fracture design information from various models.In selecting a model, it is helpful to know the characteristics of the formation after it has been fractured.For this reason, experiments are routinely done prior to fracturing of critical wells. These fieldexperiments, called minifracs, use fracturing fluid without proppant. The pressure data gathered fromthese minifracs, along with temperature log interpretations to determine fracture height7 as well assophisticated experiments using tiltmeters <strong>and</strong> mine-back operations to check fracture direction <strong>and</strong>fracture length, are useful to justify the type of model being used. From the results of these experiments,the smaller fractures behave according to the Khristianovic model <strong>and</strong> the massive fracturesbehave much closer to the Perkins & Kern predictions.Fracture height may also be limited by the presence of overlying beds such as shale, evaporites orother types of formation with a sufficiently different modulus of elasticity. These beds may prove difficultto fracture <strong>and</strong> may either limit a fracture, stop it from growing, or divert it into a new path.In s<strong>and</strong>stone formations, acid will not etch the formation face; proppant must be added to the fluid toprop the fracture open after fracturing pressure is released. The pressure used to create <strong>and</strong> drive thefracture into the reservoir must overcome the least principle stress in the formation <strong>and</strong> crack the rock.After fracturing, when this pressure is released, the earth stresses will try to close the fracture. Proppantis used to oppose this fracture closure <strong>and</strong> to fill the created fracture with a material that presentsa strong, permeable pathway for the flow of reservoir fluids. The amount, size <strong>and</strong> type of proppantsneeded to prop a fracture open depend upon the required conductivity of the fracture, the hardness ofthe formation <strong>and</strong> the stresses imposed on the proppant by the fracture closure force of the formation.Fracture Orientation <strong>and</strong> Formation StressesThe fracture orientation or direction is affected near the wellbore by stresses induced by drilling <strong>and</strong> inthe reservoir by the in-situ stresses in the rock. The drilling induced stresses are primarily related tothe mechanical impact forces from the bit, the fluid saturations <strong>and</strong> pressures in the formation pro-13-16
duced by mud <strong>and</strong> cement, cement expansion (if any) <strong>and</strong> compressional loads produced by shapedcharge perforators. These forces are most apparent at <strong>and</strong> near the surface of the high energy wellbore.Formation stresses are related to earth forces such as overburden <strong>and</strong> confining loads produced byfaulting, uplifts, tectonic plate shifts <strong>and</strong> other factors. The actual direction of the fracture extension,once the wellbore is left behind, is perpendicular to the plane of least principle stress. This concept,shown in Figure 13.13, requires the least energy, thus, it is the most probable direction. Proof of fracturegrowth in this direction by use of fracturing of mechanically loaded blocks has been contributedby Daneshy.’I OhFigure 13.13: Growth of a fracture is perpendicular to the plane of the leastprinciple stress omin The relationship of the stress in the horizontaldirection to the sum of the overburden pressure lessthe pore pressure determines if the fracture will be horizontalor vertical.The pressure necessary to start the growth of a fracture is a function of the rock strength, the stressexerted by burial depth <strong>and</strong> stresses in place at the borehole wall. It is routinely called fracture breakdownpressure or fracture initiation pressure <strong>and</strong> is usually derived from breakdown tests or minifracs.The fracture initiation pressure is normally slightly higher than the fracture extension pressure. Thesetwo pressures are shown in the surface pressure recording of Figure 13.14. In this data, the pressuredrops sharply after breakdown as the growing part of the fracture, the leading edge, leaves the highenergy wellbore <strong>and</strong> enters the “steady-state” condition of the reservoir. The pressure record after thefracture leaves the wellbore is affected by leakoff, fracture friction, <strong>and</strong> the loading <strong>and</strong> behavior ofproppant in the main part of the fracture stimulation. After the fracture treatment has been pumped,the sharp drop in pressure of Figure 13.1 4 corresponds to instantaneous shutin pressure, ISIP. Theloss of friction pressure in the tubulars, at the perforations, <strong>and</strong> in the near wellbore part of the fracturegoes to zero as pumping stops. At the moment of pump shutdown, the fracture is still growing, but theeffect of friction in the tubulars is nearly zero. The measured lSlP then, is the pressure necessary toextend the fracture in the formation.Fluid LossThe speed of fracture growth or the propagation depends on the net rate of fluid addition to the fracture.One of the reasons the pay to be fractured was selected is because it is permeable. It is this permeabilitythat allows some of the fracturing fluid to leave the fracture <strong>and</strong> invade the matrix of theformation.34 This movement of fluid from the fracture to the matrix is called fluid loss. Any fluid lost tothe matrix cannot be used to create fracture length <strong>and</strong> thus fluid loss is detrimental to a treatmentwhose principle design is to make a long fracture. Also, excessive loss of fluid to the matrix requires13-17
eakdown+ction loss in tubulars\1L3---.------*---- 1fracture propagation or extensionpressure less hydrostatic pressureTimePw = well head or surfacepressureFigure 13.14: A typical fracturing treatment pressure record.recovery time <strong>and</strong> may damage the rock in the contacted area if the fracture fluid is not compatiblewith the matrix minerals or the connate fluids.A “screen out” of a fracture treatment means the proppant has bridged at some point in the wellbore orthe fracture. As liquid is lost from the fluid volume in the fracture, the proppant is concentrated in thefracture. This may occur gradually through loss to the matrix or rapidly when a growing fracture intersectsa natural fracture. At this point the proppant becomes concentrated in the fracture <strong>and</strong> the fluidmust be forced around the pack. If no route is available around the proppant pack, pressure will rise<strong>and</strong> the job is called a screen out. Treatments that form proppant blockages at or near the growing‘Yip” of the fracture are called tip screenouts while screenouts at the well from inadequate perforationsor fracture widths are called wellbore screenouts. These descriptions are simplistic at best.The rate of matrix fluid loss depends upon the variables in the Darcy Law equation; pressure differential,wall area of the fracture <strong>and</strong> viscosity of the fracturing <strong>and</strong> reservoir fluids, as well as compressibilityof the reservoir fluid <strong>and</strong> other reservoir factors. The rate of fluid loss may be controlled byaddition of fluid loss control additives to the fracturing fluid or by increasing stable viscosity of the fracturingfluid. Addition of fluid loss additives can reduce the conductivity of the proppant pack <strong>and</strong> mustbe soluble in the produced fluids or permanent damage to the pack will occur.33The three fluid loss equations listed by Howard & Fast2 are given below. An examination of the variablesin these equations will be useful to learn the characteristics of the fluid <strong>and</strong> the formation thataffect fluid loss.The fracture fluid viscosity limits leakoff by:c, = 0.0469 -JlhOOp,where:CI= fluid leakoff, fU&13-18
kf = permeability of formation to fracture fluid, md+ = porosityAp = pressure differential between frac pressure <strong>and</strong> pore pressure, psic ~ f = viscosity of fracture fluid, cpThe reservoir fluid viscosity-compressibility effects are from:where:Cl,= fluid leakoff, ftlfinkg = permeability of formation to gas, md~ H C = hydrocarbon filled porosityC, = total compressibility (dominated by compressibility of gas)The effects of a wall building (cake) additive in the fluid must be measured experimentally. It is calculatedby:Clll = 0.0164h/Awhere:Clll= fluid leakoff, f tl6nrn= slope of plotted experimental data, ( CCiJt)A = cross sectional area of core, m2The equation on the compressibility of reservoir fluid shows that gas formations can suffer a higherfluid loss than liquid filled formations. This is true because the gas can be compressed by the higherfracturing pressure resulting in more available pore space for leakoff, while in liquid filled formations,the reservoir liquids must flow through the rock or be compressed to make room for the leakoff.When using a clean fluid, in particular one that does not contain dispersed solids, leakoff is affected bythe viscosity of the treating fluid <strong>and</strong> pressure differential. A fluid with a downhole viscosity of 100 cp,for example, would have 1/100 the leak-off rate as a fluid with the viscosity of 1 cp. The point of interesthere is that for the fracturing fluid viscosity to be a controlling factor in limiting leakoff, it must bestable at formation temperature. Viscosity of almost all polymer gelled fracturing fluids decrease withtime, especially at temperatures above 200°F, <strong>and</strong> some are shear sensitive. A reduction in viscosityat bottom hole conditions increases fluid loss.The rate of fluid loss of fluids with solid additives dispersed in the fracturing fluid is a function of the“wall building character” of those solids. Where wall building occurs, the rate can be severely limitedbecause a “mud cake like” barrier is built up on the wall of the fracture face. The efficiency of the barrieris controlled by the size range of the solid particles <strong>and</strong> the permeability of the formation. The particlesizes should be selected based on the permeability.13-19
The combined fluid loss that a formation experiences is a combination of all of the fluid loss variables.Estimating the wall building fluid loss coefficient is usually done by a test on a core from the formation.Traditional fluid loss measurements have been static tests that measure a quantity of flow vs. timewith a pressurized volume of fracturing fluid above a core. The rate of fluid loss measured by thesetests is optimistic because of the lack of scouring effects of fluids <strong>and</strong> solids across the face of thefracture that can remove or disturb the formation of a cake from a wall building fluid. The dynamic testingmethods (continuously flowing fluids) are much more accurate, although they are more difficult torun.Besides having an effect on leak-off control, viscosity also is a factor in proppant transport <strong>and</strong> in generationof fracture width.The differential pressure (difference of hydrostatic <strong>and</strong> pore pressure) in leakoff <strong>and</strong> the fractureextension pressure is impacted by the quantity of s<strong>and</strong> added to the fluid. For water, the followingchart from the Baker Packer Calculations H<strong>and</strong>book, shows the approximate weight of a gallon ofspace containing a certain amount of s<strong>and</strong> with the rest of the space filled with fluids. This correctedfluid density should be used for all hydrostatic fluid weights where the fluid contains s<strong>and</strong>.Fracturing DesignThe design of a fracturing treatment is most successful after sufficient information has been gatheredabout the characteristics of the formation <strong>and</strong> fluids <strong>and</strong> the economics of the project.The selection of a fluid must be made on the basis of compatibility of the fluid with the formation mineralsas well as the economics of the fluid <strong>and</strong> how well it can maintain the desired properties of viscosity<strong>and</strong> proppant transport for the temperature, pressures <strong>and</strong> fluids encountered for the length ofthe job. During the 1950s, the most common fracturing fluid was oil or gelled oil. During the late 50s<strong>and</strong> through the 60s, the use of oil gradually gave way to polymer gelled waters. In the early 1970s<strong>and</strong> during the period of massive hydraulic fracturing, emulsions of oil <strong>and</strong> gelled water were in commonuse. The mid-1 970s saw the addition of foam to the ranks of fracturing fluid as well as isolatedusage of gelled <strong>and</strong> foamed alcohol <strong>and</strong> gelled carbon dioxide liquid.Currently, the most common fracturing fluid is gelled water. Viscosity is generated in a water solutionby the addition of natural, organically derived or chemically modified polymers. These long-chainedorganic materials increase the viscosity of a water solution. They are used at loadings of 10-100 bsll000 gallons. Various polymers offer advantages <strong>and</strong> disadvantages in terms of the amount ofwaste solid material (trash), the amount of material available for fluid loss control <strong>and</strong> the yield of viscosityat any particular loading. Because of the large volumes of fluids in fracturing treatments, cost ofthe polymer is a large factor. As formation temperatures increase, fewer polymers provide effectiveviscosity because of temperature degradation. Fracturing fluids for high temperature wells are veryhigh technology packages that may include temperature stabilizers <strong>and</strong> temperature stable viscosifiers.The most common polymers for gelling water are:1. Guar gum - a natural substance from the guar bean. It was one of the first water gelling agents.Although it is one of the least expensive polymers, it does have a significant amount of debris.2. Hydroxy Propyl Guar, HPG - a chemically modified guar, generally thought to be cleaner thanguar gum.13-20
7 a 9 10 11 12 13Carrying Fluid - PoundslGallon13-21
3. Carboxy Methyl Hydroxy Propyl Guar, CMHPG - a cleaned guar4. Hydroxy Ethyl Cellulose, HEC - A clean breaking, manufactured cellulose polymer.5. Carboxy Methyl Cellulose, CMC - a cellulose product.6. Biopolymers - bacterially produced polymers - not a high volume usage item in fracturing.The perceived need for a clean breaking polymer may be carried too far in some fracturing cases.Reducing the amount of “trash” in the polymer gel will reduce the amount of fluid loss control exertedby establishing a filter cake or “wall” (CII~) at the faces of the formation. For example, a 30 Ib Guar (per1000 gal) will have substantially less fluid loss than a 30 Ib HEC, simply because of wall buildingeffects of debris in the dirtier Guar fluid. If the viscosity of the HEC has to be sharply increased to controlfluid loss through CI, frac fluid viscosity control, then the concept of a low solids or clean fluid hasbeen defeated. For any situation, the optimum gel type <strong>and</strong> loading will depend on need for fluid losscontrol, effect of “wall” damage cakes on production <strong>and</strong> the ability to recover the large volumes offluid lost when fluid loss is high.A method of further increasing viscosity without adding enormous amounts of the polymers has beento cross-link the polymer systems with materials which develop bonds between the long-chained polymers.Addition of small amounts of cross-linking material can enormously increase the viscosity of thepolymer.Propping agents are carried by the fluid through the pumping equipment <strong>and</strong> tubulars <strong>and</strong> transporteddown the fracture to keep the fracture from closing after the fracturing pressure is re1ea~ed.l~ Theyinclude: s<strong>and</strong>, bauxite <strong>and</strong> other materials. Proppant type selection is based on the hardness of therock, the effect of the produced fluids <strong>and</strong> the stresses imposed by closure of the fracture. Proppantsize selection is based on strength <strong>and</strong> on flow conductivity needed to produce the fluids entering thefracture, a function of formation permeability <strong>and</strong> viscosity of the produced fluids. The most commonproppants are graded, washed s<strong>and</strong>s. These s<strong>and</strong>s may be one of the mined deposits or may be fromother sources such as washed <strong>and</strong> graded river s<strong>and</strong> deposits. The strength of s<strong>and</strong> <strong>and</strong> other typeproppant <strong>and</strong> their usefulness as propping agents have been the object of intense study by a numberof authors.20-28 S<strong>and</strong>s that have proved to be the best proppants are those s<strong>and</strong>s that have a roundgrain <strong>and</strong> are nearly pure SiO2. Presence of feldspar <strong>and</strong> other impurities weaken the grains. Othertypes of proppant are graded on strength, permeability, ease of transport <strong>and</strong> resistance to producedor injected fluids. The roundness of the grain is compared by using Krumbine roundness factors,Figure 13.1 Typically, fracturing proppants should have a roundness of at least 0.8 to provide maximumpermeability <strong>and</strong> grain contact area for high strength. In very low total stress situations, angularproppant that will not pack tightly actually has higher flow capacity than rounder proppant. The problemis that the angular material breaks easily, in either h<strong>and</strong>ling or in high stress environments, creatingfines that can plug the void spaces between proppant grains.Bauxite is a manufactured proppant <strong>and</strong> is much higher strength than s<strong>and</strong>. It is commonly used indeeper, harder formations, Figure 13.1 6. The drawbacks to bauxite proppant are a higher density(3.3 g/cc for bauxite as compared to 2.65 g/cc for s<strong>and</strong>) <strong>and</strong> a higher cost. Costs of the bauxite maybe as much as 10-20 times the cost of a commercial fracturing s<strong>and</strong>, thus bauxite is limited to thedeeper wells where s<strong>and</strong> will not work. Because of the cost of the proppant, stimulations involvingbauxite are usually smaller than those using s<strong>and</strong>. Other manufactured proppants with intermediatecost <strong>and</strong> strength are also available.The size of the proppant depends upon the needed permeability <strong>and</strong> upon the strength. The largersizes of s<strong>and</strong> are more permeable than the smaller sizes of the s<strong>and</strong>. Permeability is a function of theopen area between the grains, Figure 13.1 7. A larger, consistently sized s<strong>and</strong> has a larger void areabetween the grains <strong>and</strong> hence more permeability. The larger s<strong>and</strong>s, however, are weaker in relationshipto propping open a fracture <strong>and</strong> so some trade-off is required to establish conductivity in forma-13-22
'o(Zwolle & Davies, 1983)Figure 13.15: Adaptation of Krumbein roundness guide for proppants<strong>and</strong> gravels.1 I 1 1 I I I I0 2 4 6 8 10 12 14 16Dogth (1000's Ft I(Veatch, SPE)Figure 13.16: An illustration of fracture conductivity produced bys<strong>and</strong> <strong>and</strong> sintered bauxite proppants at Increasingdepth. Closure stress is 0.7 psi/ft.tions with a higher closure stress. Strength of the larger grains is lower because there are fewer s<strong>and</strong>grains supporting any given unit area of the formation. This can be seen by the contact area exposedfrom two packs as shown in Figure 13.18. S<strong>and</strong> size is specified in US. mesh sizes. The s<strong>and</strong> iswashed <strong>and</strong> sized into consistent size ranges. A proppant size range is specified by two screen sizes.A size range of -1 0/+20 (usually seen as 10/20) means that the proppant passed through the 10 meshscreen (0.079 in. or 2 mm) <strong>and</strong> is retained on the 20 mesh screen (0.033 in. or 0.84 mm). The mostcommon ranges such as the -101-1-12, -10/+20,-20/+40 <strong>and</strong> -40/+60 are available on a wide scale;unusual sizes are available by special order (at a higher cost). Broad ranges of s<strong>and</strong> sizes, a -10+50mesh for example, should be avoided because of low permeability.Permeability through a frac s<strong>and</strong> is limited by the size <strong>and</strong> size range of the proppant, the confiningpressure on the proppant during the test, <strong>and</strong> the amount of the proppant in the fracture,Figure 13.19.10*26927Low concentrations of proppant, called partial monolayers, have very high conductivitybecause only a small part of the fracture is occupied by proppant; however, collective13-23
ABFigure 13.17: How proppant sire affects the pore size between theproppant particles.A: Large pore spaces in a large diameter proppant.B: Smaller but more numerous pores in a small,consistent size proppant pack.strength of the few grains is very low. The most common pattern is a multilayer pack of proppant. Mixingeither large or small particles into an otherwise correctly sized s<strong>and</strong> will reduce permeability asshown in Figure 13.20. Large particles in a pack of moderately sized particles eliminate the open areabetween the smaller grains by the volume that they occupy. Small particles fill in the pores of largergrains, further reducing permeability. A single size particle pack would provide the best permeability,but would be very expensive. Fortunately, the common size ranges usually provide sufficientpermeability.Proppant strength is necessary to keep the fracture from closing after fracturing fluid pressure isreleased. Graphs of conductivity at closure stresses (formation in-situ stresses minus the pore pressure),such as Figures 13.21 , report values of conductivity at a certain loading rate for the proppant asclosure stress increases or with time at closure. Since closure stress is related to burial depth, thecharts are often presented as conductivity vs.The closure stress is often log derived withgood results.” The conductivity values are further influenced by the thickness of the proppant pack<strong>and</strong> the hardness of the formation. Since net closure stress increases with loss of pore pressure(depletion), the proppant should be selected to h<strong>and</strong>le the stress at ab<strong>and</strong>onment pressure.Permeability of unstressed s<strong>and</strong>s can be very high <strong>and</strong> more than a little misleading. Typical s<strong>and</strong>size ranges of 10/20, (500 darcies), 20140 (120 darcies) <strong>and</strong> 40/60 (60 darcies) have extremely highpermeabilities. These permeabilities, while seemingly adequate for almost any application, are misleading.Part of the hydraulic fracturing need is to maintain a conductive pathway from the formation tothe wellbore. As the formation exerts stress on the proppant pack, the packing of the grains becomestighter <strong>and</strong> some grains may break, creating debris in the pack: both actions lower permeability.The necessary flow capacity for efficient fracture design is usually achieved by the largest possiblestable proppant at an adequate thickness.Proppant pack thickness is a function of proppant loading in the fracturing fluid <strong>and</strong> the width of thefracture. Typical values of proppant thickness are 2 to 8 grains or about 0.1 in. (2.5 mm) to 0.4 in.(1 0 mm) depending on grain size. The hardness of the formation influences the embedment of theproppant grain into the fracture face, Figure 13.22. Very hard formations (high density, high compressivestrength) such as low porosity s<strong>and</strong>stones <strong>and</strong> dolomites may crush some proppant while a soft13-24
-x--x- - x xFigure 13.18: Simplified contrasting examples of the contact area offeredthe formation by a monolayer of large <strong>and</strong> small diameterproppant. The smaller sizes of any proppant will usually supportmore weight (closure pressure) <strong>and</strong> can be used in deeperformations than the large sizes of the same proppant.s<strong>and</strong> or a chalk at the same depth may be propped effectively by the same proppant. The difference isthat the compressive load on the proppant is spread out over more of the proppant surface when itembeds. In hard formations, embedment is at a minimum, <strong>and</strong> the compressive load is focused at asmall point on the proppant next to the fracture wall. In this case, proppant shattering is common <strong>and</strong>the fines created during shattering may plug the pore space of the pack.1° Other factors may also contributeto proppant pack damage, Figure 13.23. In one study, as little as 10% of the original conductivityremained after placement of the proppant.12A third proppant strength consideration is the effect of reservoir or stimulation fluids on pr~ppant.~~Steam used in stimulation or oil recovery may dissolve the proppant pack. Hot brines, undersaturatedwith respect to silica, may also deteriorate a proppant pack over a several month period. In thesecases, periodic refracturing or fracturing with a more expensive, steam or brine resistant proppant isjustified.Closure StressFracture closure stress has an enormous impact on fracture design. It is the net pressure (the in-situstress minus the pore pressure) that the formation exerts against the open fracture. Closure stressaffects speed of fracture closure <strong>and</strong> loading force on the proppant. It is proportional to depth <strong>and</strong> isestimated by:13-25
............ :.:.y .....*: ';: .:t'...:. ;....................;.CXI i? CILl) )?.. ......... ............ :.. :,.:.:"":..;. .....:: :. ...:.:A., ....I Examples of types of proppant arrangementin a fracture.......; .... *:*.*: ............... . A partial monolayer-B ..................~....,,..... :..:6 full mnolayer.........>;.*..:.:-: :* ......:;::::::::.:.;:............C - pack.: .:.:a ...... * ..,!!............ . :;.: :.:.::.*:.;.:;.....( .I I'.................................................... . . . . ....... .........C(Halliburton)Figure 13.19: Effect of proppant concentration of fracture flow capacity, FC. Thepeak at 70 to 90 lb11000 ft is for partial monolayer. The minimum at300 lb/1000 ft is for a full monolayer.Closure Stress = K( PO, - P,) + P,where:KPobP,= a constant with a usual value of 1/3= overburden pressure in psi, usually 1 psi/ft (true vertical depth)= reservoir (pore) pressure (measured before fracturing)13-26
ABFigure 13.20: How proppant size range affects the permeability <strong>and</strong> overallporosity of the proppant pack.A: Loss of pore space in a poorly sorted or sized proppantpack when large grains replace several porous, smallergrains <strong>and</strong> small grains fill in the porosity between thelarger grains.B: A simplified example of the pore space lost when largegrains are allowed in a pack of smaller material.It I 11 I Ic I0 2ooo 4ooo boo0 8.m 0 25 50 75 100Cbsun Wosa @ri)Timr 4t anr!anl cbwre stress(rn=I2040 Jordan 5.000 psi, 225.F TEST CONDll"S2040 Jord~8,030 pi, 2fS.F KcL sldur*d *lilh so22 IM12mncontration of proppant(From Davies & Kuiper after Much <strong>and</strong> Penny)Figure 13.21: Closure <strong>and</strong> time effects on conductivity of apropped fracture.13-27
Figure 13.22: Proppant embedment into a fracture face in:Left: A hard formationRight: A soft FormationThe increase in load bearing area of the proppantinto the soft formation may allow the use of alower strength proppant in a formation deeperthan specified by st<strong>and</strong>ard flow capacity graphs.TYPICAL GEOMETRY OF A MASSIVE HYDRAULIC FRACTURE:FWmwino length: 1oOOft- FWre widlh at wellbore: 0.5'(Davies & Kuiper, SPE)Figure 13.23: Example of damage in a hydraulic fracture.13-28
Fracture TreatmentsFracture Treatment DesignFracture fluid efficiency is an expression of leakoff versus fracture created. It may be expressed inmany forms, but is in a very simple form:Fracture volume created = Fracture fluid pumped - LeakoffNote that nothing is stated about the shape or direction of the fracture. The effect on the production isimpacted by a larger fracture, but only when it meets the following criteria.1. The fracture flow capacity effectively “matches” the ability of the formation to deliver fluid to thefracture.1 The main part of the fracture stays within the pay zone.A fracturing treatment is separated into pad, slurry <strong>and</strong> overflush sections. The purpose of the pad isto create a fracture in the formation <strong>and</strong> to seal off fluid leakoff sites through the formation. Theamount of pad volume necessary in a fracturing design will depend on the fluid loss of the formation<strong>and</strong> the size of the slurry portion of the fracturing to be placed. The volumes of pad will range from halfor more the size of the slurry section of the fracture treatment down to zero. The amount of pad can betoo large, particularly in cases where fracture packing must be high, as in tip screenout designs.Where permeability is low, the leakoff is low <strong>and</strong> the amount of pad decreases significantly. Pad volumeis normally determined first by an estimate of the formation permeability <strong>and</strong> then by confirmationof the amount of leakoff in a minifrac or data frac prior to the fracturing process.The amount of slurry volume will depend on how long the fracture should be <strong>and</strong> how much conductivityis necessary for production.Fracture conductivity, as discussed earlier, is a function of the flow capacity of the formation. For highpermeability formations very high flow capacities are needed; whereas, low permeability formationsrequire much less flow capacity. Achieving flow capacity in a fracture dictates increasing proppantconcentration steadily along the fracture length. In any fracture environment the amount of proppantper unit area of the fracture decreases further away from the wellbore. Near the tip of the fracture, theconductivity can be the smallest although conductivity should still be sufficient in this area to avoidacting as a choke on fluids flowing toward the tip of the fracture. The rate at which proppant isincreased during the job depends on permeability, proppant carrying capacity <strong>and</strong> to a lesser extentproppant size.At the start of a job, the first slurry following the pad contains a relatively small amount of proppant,usually in the neighborhood of two pounds per gallon. As the job progresses, the amount of proppantis increased towards the higher value typically 8-1 0 or more pounds per gallon. This “ramp up” ofproppant is necessary in many formations especially when fracture width has not been fully developedby the pad. The amount, speed <strong>and</strong> type of the proppant increase will depend on the formation.During fracturing, leak-off control is required. A leak-off control stage at the start of a fracture treatment,called a pad or a prepad, creates the fracture <strong>and</strong> temporarily blocks-off the fluid leak-off sitesalong the walls of the newly created fracture. Reduction of fluid loss is important because the fluid lostfrom the fracture not only reduces volume <strong>and</strong> invades the matrix, it also leads to a concentration ofthe proppant in the fluid within the proppant carrying part of the fracture treatment. A schematic of thisoccurrence is shown in Figure 13.24. Note that as fluid loss occurs, the proppant becomes more concentrateddown the length of the fracture until the material left in the fracture is nearly solid proppant.At this point, the proppant will no longer move down the fracture <strong>and</strong> a plug is formed that stops furtherfracture growth. At this point, a “screen-out” has occurred. The fracture job must be stoppedbefore fluid injection pressure ruptures the pipe.13-29
OE-€1
II0 2 4 8 8 10 I ' 30~eRAm~-uvw(Gruesbeck & Collins)Figure 13.25: Experimental bridging region described by perforation/particle diameter ratio.Figure 13.26: Top: idealized concept of proppant transport down a fracture.Bottom: More probable location of proppant due to thermal,shear <strong>and</strong> settling factors in some fluids.13-3 1
proppant (<strong>and</strong> screening out the job) is on the order of 3 to 7 times the maximum proppant diameter. Ifthe fracture width is too narrow <strong>and</strong> wellbore screenout occurs, a low proppant concentration insuresonly minor fill of the casing (upon screenout). In one respect, the low initial proppant concentration isviewed as a test of acceptable fracture width for proppant injection. After the first proppant is put awaysuccessfully, the proppant concentration is increased according to design fundamentals that deal withthe expected rate of fluid leakoff <strong>and</strong> total treatment size. As fluid is lost, the proppant becomes moreconcentrated in the remaining liquid in the fracture. Since the first liquid injected is exposed the longesttime to fluid loss, proppant concentration in this portion of the fluid is expected to be near maximum<strong>and</strong> cause the screenout. If the injected fluid is viewed as flowing uniformly toward the growingtip of the fracture, the first fluid injected will be at the fracture’s leading edges. When this portionbecomes dehydrated by fluid loss, the str<strong>and</strong>ed proppant creates a tip screenout. If the proppant wasloaded uniformly in rest of the frac fluid, the proppant packing nearer the wellbore would be less densesince that part of the fluid would not have dehydrated as much (still would have liquid between theproppant) <strong>and</strong> fracture flow capacity would be considerably less in that area of the fracture. This woulddevelop a fracture with the most flow capacity near the tip <strong>and</strong> the least at the wellbore; a completemismatch. Flow capacity in a fracture should be structured so that the maximum flow capacity occursnear the wellbore. In areas near the tip of the fracture, less flow capacity is needed. Because of theseneeds <strong>and</strong> the dehydration <strong>and</strong> concentration effects, proppant loading is increased during the job sothat the entire fracture can be loaded with proppant. Setting proppant loading concentrations <strong>and</strong> fluidvolumes requires knowledge of fluid leakoff <strong>and</strong> fracturing fluid behavior. Designing the proppantincrease, as well a designing the rest of the job, is commonly done with a fracture design simulationprogram.All of this information has dealt with fracturing as a stimulation mechanism in an undamaged formation.The economics <strong>and</strong> design of such treatments are controlled by the permeability of the formation<strong>and</strong> viscosity of the produced fluids. In recent years, fracturing has been increasingly used in high permeabilityformations to bypass drilling or completion fluid damage. This damage is in the near-wellborearea. These stimulations are an extremely useful damage bypass tool <strong>and</strong> may be used in anyformation that has damage that cannot be conveniently removed. A frac length of 10-50 ft is common<strong>and</strong> uses proppant loadings of 10-1 5 Ib/gal to achieve a high conductivity pack.These short, high conductivity fracs are even used to stimulate high permeability, undamaged wells.The width of the frac <strong>and</strong> the size of proppant affect the pack permeability. The necessary permeabilityis a function of the expected rate of flow of fluids to the wellbore. High permeability pathways areneeded for higher permeability formations that feed in a large amount of fluid in the short linear extentof the fracture. A formation that has low natural flow capacity through the matrix next to the fracturedoes not require a conductive fracture.A measure of the needed length of a fracture is the dimensionless conductivity, Cfd:kwcfd = 3.14kL,where:k = fracture permeabilityk = formation permeabilityw = fracture widthLf = length of the fractureA Cfd of 10 is considered adequate for low permeability gas completions while a cfd greater that 100corresponds to an infinite conductivity fracture needed for high permeability oil-producing formations.’’A cfd of around l is considered low conductivity. The formula is an estimator only, it does nothave a produced fluid viscosity contribution.13-32
As an illustration of necessary frac length, four formations are described in Figure 13.1 8.I-ormationFluidPermeability, mdPress. Grad., psi/ftNeeded ConductivityFrac LengthA B C DS<strong>and</strong>stone S<strong>and</strong>stone S<strong>and</strong>stone S<strong>and</strong>stone<strong>Gas</strong> <strong>Gas</strong> <strong>Oil</strong> <strong>Oil</strong>0.05 5 5 500.433 0.433 0.433 0.433Moderate Mod. - High High V. HighV. Long Moderate Short V. ShortFigure 13.27In the illustrations, a shorter frac is useful for the oil zone, C, even though it has the same permeabilityof zone B, a gas zone. The oil is usually over a hundred times more viscous than gas <strong>and</strong> flowsthrough the fracture with much more resistance. The 100 fold permeability contrast between zones A<strong>and</strong> B illustrate the decisions made on frac length in gas zones. A very long frac in zone B for instancewould not be economic since the high natural flow capacity of the formation near the wellbore wouldcompletely utilize the flow capacity of the fracture. The furthermost reaches of the fracture would notbe used until pressure drawdown sufficiently depleted reserves in the near wellbore area. The longfracture may be a long-term production enhancement tool, although initial flow rate of a well with verylong fracture would be no higher than that from a fracture of moderate length.When To FractureNot all formations may be c<strong>and</strong>idates for fracturing. Fracturing is most useful where the contrast offracture permeability or “conductivity” to the permeability of the formation is high. This usually is at amaximum in low permeability formations. The definition of what constitutes low permeability differsfrom company to company <strong>and</strong> is further affected by the produced fluid viscosity <strong>and</strong>, to a lesserextent, by the driving energy of the formation. The basic criterion for successful fracturing is whetherthe fracture can make an economically, justifiable difference in the rates of production of hydrocarbons.These are the same criteria that are used to design the length of the fracture. Longer fracturesplaced by massive fracturing techniques are useful for very low permeability reservoirs while shorterfractures are used for higher permeability gas reservoirs. In the fracturing of oil reservoirs, the viscosityof the oil has much to do with the decision on fracture length. The higher viscosity fluids flow moreslowly (require more total flow capacity) than the low viscosity gas <strong>and</strong> will only justify the use of shortfractures. A more common <strong>and</strong> more efficient approach to the drainage of an oil reservoir, especially alow API gravity oil (high density, high viscosity) is the use of short fractures from closer spaced wellsor a horizontal completion. A summary statement on the economic lengths of fractures is that thelength is limited by the contrast in fracture-to-formation permeability. The higher the contrast, thelonger the fracture that is justified for any produced fluid viscosity while the less contrasting conductivitiesare usually limited to short fractures. In very high permeability formations (usually over 25 md),fracturing may be more difficult because of the need to control leakoff.Treatment Pressure BehaviorThe bottom hole treating pressure of a fracturing treatment can be used to predict some behavior patternsof the fracture in the formation. When the bottom hole treating pressure is plotted on a Log-Logplot, Figure 13.28, the slope of the plot describes such information as unrestricted growth with confinedheight, stable growth with fluid loss, encountering a growth restriction, <strong>and</strong> unstable heightgrowth. The acceptance of the pressure description of these growth patterns has resulted in a monitoringof the fracturing treatments.13-33
fFIELD DATA--- VARIABLE INJECTION RATE/d I I - 0* I/ tI I I40 60 1M) 200 400 600 1000TIE, HlN,IIDEALIZED DATA/III-CAPPROXIRATE1OG-LOG SLOPEJNTERPRETAflON1/8-1/9 I RESTRICTED HEIGHT AWD UNRESTRICTEDEXTENSION0 11 P) STABLE HEIGHT GROWTH (le Moderate1b) FISSURE OPENING1-1 (UNIT! ill-a RESTRICTED EXTENSION-~MO octlve wings2-1 (DOUBLE) Ill-b RESTRICTED EXTEt(S1ON-me octlve wlngNEGATIVE IV UNSTABLE HEIGHT GROWTH (le Run-away)(Nolte & Smith)Figure 13.28: Analysis of a plot of bottom hole treating pressure during fracturing<strong>References</strong>1. Waters, A. B.: “Hydraulic Fracturing, What Is It?,” J. Pet. Tech. (Aug. 1981), p. 1416.2. Veatch, R. W.: “Overview of Hydraulic Fracturing Design <strong>and</strong> Treatment Technology, Part 1 ,” J.Pet. Tech., (April 1983), pp. 677-687.3. Veatch, R. W.: “Overview of Hydraulic Fracturing Design <strong>and</strong> Treatment Technology, Part 2,” J.Pet. Tech., (May 1983), pp. 677-687.4. Howard, G. C., Fast, C. R.: Hydraulic Fracturing, Monograph Series, SPE, Dallas, 1970.5. Hunt, W. C., Shu, W. R.: “Controlled Pulse Fracturing For Well Stimulation,” SPE 18972, RockyMtn. Symp., March 6-8, 1989.6. Elkins, L. E.: “Western Tight <strong>Gas</strong> S<strong>and</strong>s Major Research Requirements,” paper presented atFirst Intl. <strong>Gas</strong> Research Conf., Chicago, June 9-12, 1980.13-34
7. Dobkins, T. A.: “Methods to Better Determine Hydraulic Fracture Height,” SPE 8403,54th AnnualMtg., Las Vegas, Sept. 23-26, 1979.8. Daneshy, A. A.: “A Study of Inclined Hydraulic Fractures,” J. Pet. Tech., 1973, pp. 61-68.9. Pye, D. S., Smith, W. A.: “Fluid Loss Additive Seriously Reduces Fracture Proppant Conductivity<strong>and</strong> Formation Permeability,” SPE 4680, Annual Fall Mtg., Sept. 30-Oct. 3, 1973.10. Davies, D. R., Kulper, T. 0. H.: “Fracture Conductivity in Hydraulic Fracture Stimulation,” J. Pet.Tech., (May 1988), p. 550.11. Ebinger, C. D., Hunt, E.: “Keys to Good Fracturing,” <strong>Oil</strong> <strong>and</strong> <strong>Gas</strong> J., 7 part series, 1989.12. Roodhart, L. P., Kulper, T. 0. H., Davies, D. R.: “Proppant-Pack <strong>and</strong> Formation Impairment during<strong>Gas</strong>-Well Hydraulic Fracturing,” SPE Prod. Eng., (Nov. 1988), pp. 438-444.13. Gruesbeck, C., Collins, R. E.: “Particle Transport Through Perforations,” SPE 7706, Formationon Formation Damage, Lafayette, Feb. 15-1 6, 1978.14. Montgomery, C. T., Steanson, R. E.: “Proppant Selection - The Key to Successful Fracture Stimulation,”SWPSC, p. 175.15. Geertsma, J., DeKlerk, F.: “A Rapid Method of Predicting Width <strong>and</strong> Extent of HydraulicallyInduced Fractures,” J. Pet. Tech. (Dec. 1969), pp. 1571 -81.16. Perkins, T. K., Kern, L. R.: “Widths of Hydraulic Fractures,” J. Pet. Tech., (Sept. 1961).17. Nordgren, R. P.: “Propagation of a Vertical Hydraulic Fracture,” Soc. Pet. Eng. J., (Aug. 1972),pp. 306-314.18. Khristianovic, S. A., Zheltov, Y. P.: “Formation of Vertical Fractures by Means of Highly ViscousLiquid,” Proc. Fourth World Pet. Cong., Rome (1955).19. Clark, P. E., Quadir, J. A.: “Proppant Transport in Hydraulic Fractures: A Critical Review of ParticleSettling Velocity Equations,” SPE paper 9866, 1981 SPE/DOE Low Perm <strong>Gas</strong> Symp., Denver,May 27-29.20. “Recommended Practices for Testing S<strong>and</strong> Used in Hydraulic Fracturing Operations,” RP 56,API, Dallas (1983).21. Cutler, R. A., et al.: “New Proppants for Deep <strong>Gas</strong> Well Stimulation,” SPE 9869, SPE/DOE LowPerm. <strong>Gas</strong>. Symp., Denver, May 27-29, 1981.22. Neal, E. A., Parmley, J. L., Colpays, P. J.: “Oxide Ceramic Proppants for Treatment of Deep WellFractures,” SPE 681 6, Annual Tech. Mtg., Denver, Oct. 9-12, 1977.23. Callanan, M. J., McDaniel, R. R., Lewis, P. E.: “Application of a New Second Generation High-Strength Proppant in Tight <strong>Gas</strong> Reservoirs,” SPE 11 633, SPE/DOE Low Perm. <strong>Gas</strong>. Symp.,Denver, Mar. 13-1 6, 1983.24. Cutler, R. A., et al: ‘Comparison of the Fracture Conductivity of Commercially Available <strong>and</strong>Experimental Proppants at Intermediate <strong>and</strong> High Closure Stress,” SPE 11 634, SPE/DOE LowPerm. <strong>Gas</strong>. Symp., Denver, Mar. 13-16, 1983.13-35
25. Sinclair, A. R., Graham, J. W.: “A New Proppant For Hydraulic Fracturing,” paper presented atthe 1978 ASME Energy Conference, Houston, Nov. 5-9.26. Coulter, G. R., Wells, R. D.,: “The Advantages of High Proppant Concentration in Fracture Stimulation,”J. Pet. Tech., (June 1972), pp. 643-650.27. Halliburton Frac Book.28. Much, M., Penny, G. S.: “Long-Term Performance of Proppants Under Simulated Reservoir Conditions,”SPE 1641 5, SPE/DOE Low Perm. <strong>Gas</strong>. Symp., Denver, May 18-1 9, 1987.29. Zwolle, S. R., Davies, D. R.: “Gravel Packing S<strong>and</strong> Quality - A Quantitative Study,” J. Pet. Tech.,(June 1983), pp. 1042-50.30. McDaniel, B. W.: “Conductivity Testing of Proppants at High Temperature <strong>and</strong> Stress,” SPE15067, California Regional Mtg., Oakl<strong>and</strong>, April 2-4, 1986.31. Nolte, K. G., Smith, M. B.: “Interpretation of Hydraulic Fracturing Pressures,” J. Pet. Tech., (Sept.1981), pp. 1767-75.32. Nolte, K. G.: “Fracture Design Considerations Based on Pressure Analysis,” SPE Paper 10911,1982 SPE Cotton Valley Symposium, Tyler, Texas, May 20, 1982.33. Cantu, L. A., Boyd, P. A.: “Laboratory <strong>and</strong> Field Evaluation of a Combined Fluid Loss ControlAdditive <strong>and</strong> Gel Breaker For Fracturing Fluids,” SPE 18211, Intl. Symp. on <strong>Oil</strong> Field Chemistry,Houston, Feb. 8-1 0, 1989.34. Clark, P. E., Barbat, 0.: “The Analysis of Fluid Loss Data,” SPE 18971 , Rocky Mnt. Syrnp., Denver,March 6-8, 1989.13-36
Chapter 14: Unstable Formations <strong>and</strong> S<strong>and</strong> ControlUnstable formations are those reservoirs with poor cementation or other unusual weaknesses thatallow pieces of the formation to break away <strong>and</strong> enter the perforation or the wellbore. The most commonsolids production from pay zones is from poorly consolidated s<strong>and</strong>stones. A few chalks, shales,silt stones, <strong>and</strong> rubble zones will also flow particles, undergo plastic failure, or slough particles due tomechanical failure. This chapter will primarily deal with s<strong>and</strong> movement <strong>and</strong> control. For more detailedinformation, the reader is referred to the SPE Special Topic, “S<strong>and</strong> Control,” by Penberthy <strong>and</strong>S haug hnessy.’The biggest problems for predicting s<strong>and</strong> movement <strong>and</strong> for designing methods of control is thatunconsolidated formations are rarely homogeneous <strong>and</strong> formation strength is affected by changes inwater saturation <strong>and</strong> pressures over the life of the field. The flow rate that will produce s<strong>and</strong> in oneinterval may cause no damage only a foot away <strong>and</strong> the control process that will halt the flow of s<strong>and</strong>in a zone with large formation s<strong>and</strong> grains may not work in zones with smaller grains. For purposes ofs<strong>and</strong> movement evaluation <strong>and</strong> s<strong>and</strong> control, the treatment of the whole formation must often be thesame as the treatment of the worst-case zone. In formations where large sections of the formation areweak, the worst-case control is needed, but in formations where only a few feet of the zone will move,selective perforating can often avoid the need for s<strong>and</strong> control. The answer, obviously, is to determinewhich s<strong>and</strong>s will move. Unfortunately, this may be difficult. Reservoirs that did not produce s<strong>and</strong> whenfirst discovered may produce s<strong>and</strong> when the reservoir pressure declines or when water encroaches.The best indicators of current <strong>and</strong> future s<strong>and</strong> movement are available from the formation behavior oninitial flow tests from examinations of core <strong>and</strong> from behavior of offset wells or similar fields.The type of particles that are moving is also a concern. Penberthy <strong>and</strong> Shaughnessy differentiatesbetween load-bearing particles <strong>and</strong> mobile fines that may move through the formation.’ The mobilefines are not part of the mechanical structure of the formation. Trying to stop these fines of clay orfeldspar would require very small gravel packs <strong>and</strong> result in drastically impaired production. Allowingthem to pass through the pack with the flowing fluids prevents their buildup <strong>and</strong> subsequent permeabilitydamage at the interface of the pack <strong>and</strong> the formation.S<strong>and</strong> CementationWhether the s<strong>and</strong> is torn loose by drag from the flowing fluids or in response to the effects of pressure,s<strong>and</strong> movement only occurs when the strength of the formation is not adequate to hold thegrains in place at the production rate of the well. S<strong>and</strong> movement only occurs when there is poorbonding or cementation of the s<strong>and</strong> grains. Most s<strong>and</strong>stone formations are bonded together by clay,quartz, calcite, mineral growth or precipitate bonding. This cementation of the s<strong>and</strong> grains, plus thestrength of the grains <strong>and</strong> the pressure of the fluids within the pores offsets the weight of the sedimentson top of the formation (the “overburden load”).A rough rock classification system has emerged in the literature. The BHN is the BriNell hardnessnumber used for hardness classification on metals.Rock Classification SystemTerm BHN Geologic Equivalentunconsolidated Q nocementpartiallsemi consol. 2 - 5 pieces easily crushed w/fingersfriable 5-10 pieces crushed when rubbed hardconsolidated 10-30 pieces crushed with forcepshardmedium 30-50hard 50-125v. hard >12514-1
Interestingly, many of the formations that produce s<strong>and</strong> have similar character:1. usually shallow (~8000 ft or c2400 m),2. normally young (Miocene or later),3. keeping the hole open during drilling may be difficult (large incidence of caving <strong>and</strong> hole erosionduring pumping),4. s<strong>and</strong> production from any unbridged face of the formation may begin with the first flow of fluids,5. a significant portion of the formation strength is from resident fluid cohesive forces,6. small changes in conditions (fluid saturations, flow rates, overburden loads) produce s<strong>and</strong>).Cementation is the dominant effect in consolidated formations in resisting particle movement from thedrag forces exerted on the grains by flowing fluids. Cementation is developed in several ways but ismost commonly thought to be associated with precipitation of minerals from water in the pores. Thelocalization of the cementing precipitate at the grain-to-grain contact is caused by a pressure dissolution<strong>and</strong> precipitation cycle that is brought on by the application of overburden on the point-to-pointcontacts of the grains. At the high pressures associated with the point-to-point loading, accelerateddissolution of the contacting grains takes place at the point of contact <strong>and</strong> the water surrounding theactive sites becomes over-saturated with an ion. As the reaction proceeds, the pointed contact areasof the grains become flatter, spreading the load over a wider area of total contact. At some point, theincreased contact area created by this method can withst<strong>and</strong> the overburden load <strong>and</strong> the formationstrength is stabilized. Since the point-to-point contacts are no longer creating super saturation of thematrix minerals in the water, the water precipitates ions from water at the contacts of the grains. Theresult is that the grains are “cemented” together. This basic dissolution <strong>and</strong> precipitation process atthe grain contact is only one method of cementation. Additional application of the same type of cementor another cement may occur as the connate water comes to equilibrium with the conditions of temperature,pressure, <strong>and</strong> mineral composition. Quartz overgrowth around calcium cementation or claydevelopment at the grain boundaries is a sign of secondary cementing.Formations may not form cementation for a number of reasons. Low compaction loading caused byshallow burial or very large, load supporting arches above the pay (e.g., grabens) or faults may blockthe necessary stresses <strong>and</strong> leave high porosity <strong>and</strong> poor bonding. Additionally, when the pores arefilled with hydrocarbon, mineral solution or precipitation from water cannot take place. High pore pressure(geopressures) also reduces the compaction loading on the formation since the pore fluidassumes more of the overburden supporting load.Other forms of in-pore chemical reactions such as ground water leaching of the matrix grains or dolomitizationmay heavily modify the cementation or the grain size.Formation CharacterizationThe types of formations most likely to produce s<strong>and</strong> are those with a low compressive strength. Thereare three categories of the weak formations: friable, partially consolidated, <strong>and</strong> totally unconsolidated.*Friable formations are those formations that have adequate strength to maintain shape whenremoved from the well as a formation core. They can be broken by h<strong>and</strong> contact into small fragmentsor ground into individual grains with little more than strenuous finger pressure. Partially consolidatedformations are those formations that have some degree of compressive strength but may be alteredby chemical or physical changes (such as drying) to the point where bonding between the grains is nolonger effective at controlling the movement of s<strong>and</strong> grains. Totally unconsolidated formations arethose that have no compressive strength. Drilling in these formations is usually little more involvedthan washing the bit through the zone <strong>and</strong> establishing a mud cake. All these formations may subside14-2
(shrink) during production. In all of these formations, any chemical or physical change of the bondingmedium may start s<strong>and</strong> production.The onset of s<strong>and</strong> production may be triggered by the first fluid produced from the formation or by anumber of incidences during the productive life of the reservoir. Formations that are totally unconsolidatedmay produce s<strong>and</strong> from the first day of fluid removal. The simple drag on a formation particle bya flowing fluid may be sufficient to move the grain <strong>and</strong> carry it into the perforation. Drag on a particle islike st<strong>and</strong>ing in a strong wind. As the air hits flows around you, it is exerting a force in the direction ofthe air. The problem is increased by high fluid viscosity, <strong>and</strong> high flow rates during drawdown. Theeffect of increasing drag from flowing fluid viscosity can be visualized by comparing st<strong>and</strong>ing in a5 mph breeze to st<strong>and</strong>ing in a 5 mph river current. Other factors that may increase s<strong>and</strong> productionare change in flowing pressure, water influx, brine salinity change, acid stimulations, or other physicalor chemical disturbance of a weak cement.Discussion on s<strong>and</strong> movement factors will focus on what are thought to be the three largest contributors:fluid flow velocity (drawdown), water influx <strong>and</strong> pressure decline. The effects of drawdown arerelated to the velocity of the fluid through the perforation, the stability of the perforation cavity <strong>and</strong> creationof temporary arches of s<strong>and</strong> grains (Figure 14.1).314 An arch is a spherical shaped cap of interlockeds<strong>and</strong> grains that prevents further s<strong>and</strong> movement at some constant pressure <strong>and</strong> flow rate.The action of the grains pushing in on each other forms a strong support similar to the Roman archover doorways <strong>and</strong> windows in architecture. The arch can support enormous weight by spreading outthe load. Changes in rate or shut-ins will destroy arches, <strong>and</strong> s<strong>and</strong> production will continue until a newarch forms. Arches cannot form in every formation. The formation of an arch is dependent on thegrains size <strong>and</strong> the gap that must be bridged with an arch. If the gaps between the solid surfaces ofthe slot, perf or crack are too wide, the grains will simply pass through the gap. Established theory onthe size of the gap that can be bridged indicates that formation s<strong>and</strong> grain sizes of 1/7 to 1/3 of thegap width will form arches in one direction flow. Smaller particles will pass through the gap <strong>and</strong> largerparticles will wedge into the gap <strong>and</strong> may not break up when pressure or flow is changed. Althoughexistence of arches is well proven, their effect is only beneficial in wells that produce at a steady flowrate.Figure 14.1: An idealized arch of s<strong>and</strong> grains around anopening. Arches are stable only as long asthe flow is undisturbed.Because of pore fluid removal <strong>and</strong> pressure change, the maximum possible drawdown varies duringthe life of a reservoir with some readily recognizable period^.^^^1. Early production stage: when the perforation cavities are still slim <strong>and</strong> have a permeability-damagedzone around them. (This period is immediately after overbalanced perforating <strong>and</strong> beforeflow, surging, or washing.)14-3
2.3.4.Stable production stage with enlarged perforation cavities. (This assumes some arch support inthe formation with no perforation tunnel collapse).After water production starts, some s<strong>and</strong> is produced by fluid flow.The tendency for unstable s<strong>and</strong> production increases with reservoir pressure depletion.S<strong>and</strong> production after water breakthrough is common in unconsolidated <strong>and</strong> friable s<strong>and</strong>s. Reductionor loss of the capillary bond between the s<strong>and</strong> grains is the main reason for the formation strengthloss, although clay modification by brine salinity changes may also have an effect in some cases.Some authors report that s<strong>and</strong> production should cease after the water flow stabilizes, unless thedrawdown exceeds some critical rate. Unfortunately, the critical rate may be below the economic rate.Morita, et. al., list several factors that contribute to s<strong>and</strong> production after water breakthro~gh.~1. Loss of capillary pressure.2. Flow friction increases since increasing water saturation lowers the relative permeability tohydrocarbons. (A higher drawdown is then necessary to maintain oil rate.)3. Reservoir pressure is generally low when water influx occurs.In the final stages of reservoir depletion, s<strong>and</strong> grains may be loosened by shear failure caused byincreasing net overburden stress. This period is often marked by noticeable formation subsidence <strong>and</strong>perhaps surface subsidence <strong>and</strong> casing collapses. Pressure maintenance can reduce the severity ofthis problem.Methods of predicting the occurrence of s<strong>and</strong> production include: drillstem tests, core analysis, logs orproduction data. Methods involving acoustic <strong>and</strong> density measurements are available for estimatings<strong>and</strong> movement as are various “destructive techniques” based on s<strong>and</strong> production monitoring at variousflow rates using produced fluid sampling or s<strong>and</strong> probes. S<strong>and</strong> production testing involves producinga well (single interval) at successively higher flow rates until: (1) s<strong>and</strong> is produced, (2) the flowcapacity of the completion is reached, or (3) the maximum drawdown is reached. In multiple zones,the test should be performed on each interval. This type of test may destroy the wellbore integrity ofthe wellbore, making gravel pack volume assessment more difficult or resin consolidation treatmentsimpossible. It is usually used where redrilling the pay is economical when compared with “unnecessary”s<strong>and</strong> control measures.S<strong>and</strong> Movement PredictionThere are several methods of evaluating the potential to produce s<strong>and</strong> from a formation. The oldest methodsare generally based on rock mechanics information <strong>and</strong> use the Mohr’s circle approach that estimatesstress <strong>and</strong> response from stress on the formation. In this analysis, which has been used for formationstrength assessment since the early 1970s, the modulus of elasticity <strong>and</strong> strength at various pressures areutilized to determine whether the formation will turn loose in catastrophic type flow.521The Mohr’s circles of Figures 14.2 <strong>and</strong> 14.3 are generated from data collected during triaxial compressiontests. When load conditions reach any point along the boundary of the Mohr envelope, the strength of thematerial is overcome <strong>and</strong> part of the material can slip or flow. In Figure 14.2, two strength contributions areillustrated: Friction between s<strong>and</strong> grains <strong>and</strong> cohesion or cementation between rains. The friction is tan-gent 0, <strong>and</strong> cementation strength is the value of strength at o, = 0 (intercept). EB In the very low range ofconfining pressures, loose Ottawa s<strong>and</strong> has been used as the model. The circles are drawn for confiningstress <strong>and</strong> peak axial stress. In the example of Figure 2, the failure envelope is linear with a 34” shearingstress.2 The small amount (4 psi) of shear stress at the intercept is due to either cohesion or the stretchingof the rubber membrane containing the s<strong>and</strong>. At higher confining pressures, the s<strong>and</strong>s often do not give asharp indication of failure. This is particularly true with angular s<strong>and</strong>s.144
Cohesion or CementationContribution to Strength- Increasing -LOAD(EFRCTIVE STRESS (rp), psi)Figure 14.2: Mohr envelope strength plot.Figure 14.3: Mohr failure diagram at low confining stresses.More recent methods of analyzing s<strong>and</strong> production involve the use of log-derived data. Log data havebeen more acceptable than core data in most analysis of s<strong>and</strong> flow potential since the cores had to beremoved from the reservoir, transported <strong>and</strong> repressurized during testing. The relaxation <strong>and</strong> recompressionof the core often disturb the matrix strength <strong>and</strong> bonding to a point where information generatedshowed a higher than real indication of s<strong>and</strong> movement. Using log-derived data appears to be a moreacceptable method of evaluating s<strong>and</strong> control potential since it measures the formation in near-in situstress forms. The data analysis from two published ~tudies’~~’~ indicates that log analysis is much superiorto the conservative core tests for evaluating the potential of s<strong>and</strong> flow.Many of the techniques used in s<strong>and</strong> flow prediction are based on modeling of the perforation or cavities.These arch values may be relatively small as measured by Bratli’* <strong>and</strong> Ri~nes’~, as arches with radius of1.8 to 2.0 cm for Ottawa s<strong>and</strong>s but are probably dependent on grain size <strong>and</strong> shape <strong>and</strong> flow conditions.Most of the causes for failure fall into general classes: compressive failure (elastic-brittle spalling), tensilefailure (deformation force from flow of fluids exceeding a threshold, Figure 14.4), <strong>and</strong> erosion (production14-5
of individual grains from overcoming cohesion). Erosion is a special case of tensile failure. In tests formingFigure 14.4, Shell illustrates that s<strong>and</strong> production from drawdown pressure is related to formation strength.The safe area in Figure 14.4 is below the line.Figure 14.4:Drawdown pressure versus unconfined compressive strength (field data).Tensile <strong>and</strong> compressive forces may be related to s<strong>and</strong> movement by equations in the Shell reference <strong>and</strong>plotted as shown in Figure 14.5. Note that risk decreases when stable cavities are supported <strong>and</strong> riskincreases as the reservoir is depleted.ssiveFigure 14.5: S<strong>and</strong> stability diagram.Tensile failure is triggered by excessive drawdown. The gpn is a normalized pressure drawdown gradient.The g,n is heavily influenced by cavity size <strong>and</strong> permeability (which is a function of grain size). Anythingthat decreases permeability (mud, poor perfs, fines, relative permeability, etc.) will increase the drawdown<strong>and</strong> increase the tendency to produce s<strong>and</strong>.The relationship of drawdown to sonic traveltime was plotted for several wells in Veeken's paper,Figure 14.6. A risk region was established where s<strong>and</strong>-free production was expected to the left <strong>and</strong> below,while s<strong>and</strong> production was expected to the right <strong>and</strong> above. This curve is not good for all cases but showsthat data from a multiple well project can be used in a continuing optimization plan.Sonic logging <strong>and</strong> supporting waveform analysis allow collection of continuous shear <strong>and</strong> compressionaldata. Elastic moduli relationships from transit times or velocities are shown in Figure 14.7F2 A rigorousevaluation is available form Domer~ico.~~14-6
Figure 14.6: Total drawdown versus transit time for intervals with<strong>and</strong> without s<strong>and</strong> problems.t iII I IINote: coe~ a = 1 s x i010 I 6?b in @Cm3 fin ,.MI.Ii(Schlumberger)"IFigure 14.7ICompressive strength estimations from compressional traveltime are available from Onyia:c, =1 .oo0.0000515 (Atc- 23.87)C, = ultimate compressive strength (unconfined), psiAtc = compressional traveltime (psedft)4- 2.0The fit with this type of equation on wells in general is shown in Figures 14.8 <strong>and</strong> 14.9 from Onyia.Attempts at compressive strength fits from other logs are shown in Figures 14.10-14.13 (also from~nyia) F414-7
Figure 14.00Figure 14.9Figure 14.10Further evaluation of rock strength <strong>and</strong> s<strong>and</strong> control potential shows that almost all marginally or poorlyconsolidated formations are sensitive to the amount of drawdown as measured to be the difference of bottomholeflowing pressure subtracted from current reservoir pressure. As expected, formations with a rela-14-8
“o w 40 U) 10 too UP UP uo UP ZOOW A RAY. mFigure 14.11I(Onyia)0.l . ,I 1.1 2.1 LI LIBULK DWSJ7Y. C/CWFigure 14.12(Ciyia)0 J .ErnmsszI W m Rwmnm. WYU(Onyia)Figure 14.13tively high reservoir pressure can st<strong>and</strong> more drawdown than formations that have nearly been depleted.There is also information available that indicates that higher permeability formations, <strong>and</strong> particularly those14-9
with high relative permeability to the fluid that is flowing, are less susceptible to s<strong>and</strong> movement than areformations which have suffered relative permeability decreases due to addition of a flowing phase.Orientation of the perforations may also be a factor in cavity (perforation) stability. Cavities oriented alongthe plane of maximum stress are more stable than cavities oriented perpendicular to maximum stress.Although the effect has been d~cumented,’~ there are few cases where stress directions are known in sufficientdetail to take advantage of the marginal addition of stability.Studies of marginally consolidated core have shown that changes in rate, changes in confining pressure,changes in differential pressure, <strong>and</strong> relative permeability are all significant movement factors in a formationwhere s<strong>and</strong> has a potential to move. Likewise, in formations that are strongly consolidated, it is virtuallyimpossible to establish fines movement. In marginally consolidated cores, changes in one or more ofthe variables would produce s<strong>and</strong> for a short time. However, after several minutes of s<strong>and</strong> production, newarches would form in the free face of the formation <strong>and</strong> s<strong>and</strong> production would cease. Catastrophic failureor continuous production of s<strong>and</strong> usually only occurred after a second flowing fluid phase was introducedinto the pores of the rock. The decreased permeability caused an increased pressure drop across the s<strong>and</strong>face (to achieve a certain flow rate), <strong>and</strong> the formation was disaggregated in response to the differentialpressure.Core tests have been described by Chow15 that measure the tendency of s<strong>and</strong> production. Most use triaxialtests, but a few measure the s<strong>and</strong> dispersed from the free face of a core.15 Chow’s work to find the s<strong>and</strong>free index Sf, has centered on a correlation of compression <strong>and</strong> shear wave derived compressivestrength.’$ The strength estimation from man-made cores is shown in Figure 14.14 for shear wave <strong>and</strong>Figure 14.15 for compressive wave, indicating that these values, which can be calculated from logs, are atleast reasonable accurate. The Mohr-Coulomb method appears to be conservative, Figures 14.16 <strong>and</strong>14.1 7, in assigning need for s<strong>and</strong> control.Cs-Vs (psi11000 -900 -800 -700 -600 -500 -400 -0 100 200 300 400 500 600 700 800 900 1000Cs-measured (psi1Figure 14.14: S-wave predicted <strong>and</strong> measured rock strengths of cement s<strong>and</strong> cores.S<strong>and</strong> production may often be noted when the wells are started up after a shutin or when the flow rateis changed.4i5 Shut-ins <strong>and</strong> rate changes often disturb the arches or other stable particle arrangements<strong>and</strong> change the pore pressure in the near wellbore, resulting in short term changes in s<strong>and</strong> productionrate. As a point of interest, the incidence of casing collapse is also highest immediatelyfollowing production start-up or a drastic change in production rate. Casing collapse is associated withearth shift forces produced by upper sediment subsidence following creation of voids (open areas) inproducing intervals. The formation subsidence places a downward pull on the casing that leads tobuckling.Additional information on s<strong>and</strong> production may be obtained from the production history of offset wells,drilling records, <strong>and</strong> logging information, including density, sonic, caliper, openhole gamma ray <strong>and</strong>induction measurements. These logs form the basis for strength calculations. Monitoring of a suspectwell is a viable tool to detect the initiation of s<strong>and</strong> production. This early monitoring of s<strong>and</strong> movement14-10
loo0900800 t700600C8-b (psi) 500400300200100n‘f. . A/Figure 14.15: P-wave predicted <strong>and</strong> measured rock strengths of cement s<strong>and</strong> cores.9.008.007.00...1 .000.003566 3595 3597 3599 3750 3752 3755 3757h mm lln)Figure 14.16: Comparison of predicted s<strong>and</strong> free index - Well A.3800 3820 3840 3860 3880 3900Log apth lm)Figure 14.17: Comparison of predicted s<strong>and</strong> free index - Well B.is very useful in reducing equipment damage <strong>and</strong> avoiding processing (<strong>and</strong> disposal) of large amountsof s<strong>and</strong>. When s<strong>and</strong> production does become apparent, a design should already be in place to convertthe well to a s<strong>and</strong> control completion. Field wide monitoring can supply large amounts of flow rate vs.s<strong>and</strong> flow rate data that are useful to generate guidelines on the s<strong>and</strong>-free production rate.14-1 1
S<strong>and</strong> Control ConsiderationsWhen a formation has the capacity to produce s<strong>and</strong>, a decision must be made on whether to:(1) reduce production rate to a level where s<strong>and</strong> will not be produced, (2) allow the s<strong>and</strong> to produce<strong>and</strong> dispose of it from surface facilities, or (3) complete the well in such a manner that s<strong>and</strong> productionis prevented at the required production rate. Although reducing production rate is a preliminary step insome reservoirs to evaluate the s<strong>and</strong> free flow rates, it is often not the most economical course ofact ion.Excessive s<strong>and</strong> production depends on facility design <strong>and</strong> disposal difficulties. It is usually in excessof 0.1 ?40 (volumetric).’ Allowing the s<strong>and</strong> to produce has been recommended several times, particularlywhere s<strong>and</strong> grains from friable or marginally consolidated formations are ripped loose by highvelocity flow. Because this type of s<strong>and</strong> production is caused by drag forces created by produced fluidvelocity, enlarging the wellbore will result in less velocity per unit of area at the s<strong>and</strong>face. When thewellbore has enlarged so that the velocity is less than the critical rate necessary to break s<strong>and</strong> grainsoff; the s<strong>and</strong> production will cease. This assumes, of course, that the enlarged wellbore does not collapse.This decision to produce the s<strong>and</strong> can be a hazardous one: voids behind the pipe caused bys<strong>and</strong> production may lead to subsidence <strong>and</strong> casing collapse. The method is most successful in friableformations. Under reaming an open hole completion is a shortcut to a cavity completion in thesereservoirs.A special case where s<strong>and</strong> production improved productivity without creating an unstable conditionwas seen in a heavy oil deposit in Canada. In this instance, an early s<strong>and</strong> production of 50% of producedfluid volume was produced with progressive cavity pumps. Within six months, s<strong>and</strong> productiondropped to less than 5% <strong>and</strong> oil production was stable. No wellbore collapses were seen. Althoughthese cased hole completions were originally thought to have formed cavities on the outside of thecasing, the use of adsorptive tracer dyes showed that open channels had actually been createdbetween wells. The open channels, which were fed <strong>and</strong> stabilized by a foamy oil drive, successfullyproduced the high viscosity oil. Wells in the field that were gravel packed did not produce economially.^^This is a very unusual case.The task of clearing the s<strong>and</strong> from surface equipment <strong>and</strong> cleaning <strong>and</strong> disposal of the oily s<strong>and</strong> iscostly. The s<strong>and</strong> production option often becomes increasingly expensive. It is a viable solution forsome reservoirs however, <strong>and</strong> if a stable enlarged wellbore can be established, the completion hasthe advantages of a low-cost completion <strong>and</strong> unhindered production.For most formations that produce s<strong>and</strong>, s<strong>and</strong> control completions offer the most practical solution.S<strong>and</strong> Movement PredictionS<strong>and</strong> movement prediction is always of interest but rarely practical to diagnose whether a borderlinecompletion needs s<strong>and</strong> control. In the case of CT completions, the decision is no different than a traditionalcompletion. For repairs, the decision is already in effect. Although a great many predictive modelsare available, their use has seen a general decline. The most supported reasons are:1. Difficulty in getting realistic predictions in nonhomogeneous formations. The biggest difficulty inpredictive methods in the nonhomogeneous formations is that many engineers base a graveldesign on a small interval to control extremely fine s<strong>and</strong>. This is a mistake since the major productivityareas are the higher permeability sections. The lower permeability sections can beeither by-passed in perforating or allowed to invade the gravel pack in their area. Even thoughthey damage the gravel in a small area, this will not significantly decrease the production, <strong>and</strong>the higher permeability of the larger gravel should offset any loss of partial completion.2. S<strong>and</strong> production tendency <strong>and</strong> the controlling factors change significantly as any field matures.The factors which have been identified as s<strong>and</strong>ing problem areas include overburden <strong>and</strong> overburdenchanges, localized drawdown, start-ups <strong>and</strong> shutdown, cyclic production, water14-12
Yencroachment, <strong>and</strong> numerous effects of depletion. Many formations which are thought to be“safe” during initial testing will fail <strong>and</strong> produce s<strong>and</strong> near the end of the project life.3. Although money can be saved from diverting spending for initial s<strong>and</strong> control operations untillater in the life of the well, the risk of failure of placement of the s<strong>and</strong> control also increases significantly.In offshore wells, workover rig-based reentry of a well to install a remedial s<strong>and</strong> controlcompletion may be significantly more expensive than an initial completion, even though the costof the completion may be deferred.S<strong>and</strong> ControlThere are ten general methods of s<strong>and</strong> control. Figure 14.1 8 illustrates several of the methods <strong>and</strong>variations.1. No Control. The decision to produce s<strong>and</strong> <strong>and</strong> dispose f it at the surface is not made lightly.Figure 14.18: Sketches of s<strong>and</strong> control methods.A is a blast joint for control of pipe erosion.B is resin consolidation of the formation.C is screen only. Formation s<strong>and</strong> fills annulus.D is a gravel pack with prepacking of gravelbeyond the casing. The prepacking may be afracture in some instances.Although the process is effective in some cases (such as heavy oil), the produced s<strong>and</strong> is a disposalliability <strong>and</strong> must often be treated before disposal. The problems of erosion <strong>and</strong> potentialsubsidence issues including casing collapse also must be addressed.2. Cavity creation. Some formations with low to marginal strength will form cavities around the wellboreor perforations as the flowing fluids removes s<strong>and</strong>. The cavities will grow until the velocityof the flowing fluid creates loss of a drag force on the grain than the cohesiveladhesive forcestrying to hold the grain in place. Cavity formation requires that the cavity is stable (does not collapse).In these formations, a cavity will for during the initial s<strong>and</strong> production <strong>and</strong> very little s<strong>and</strong>will be produced afterward. Changes in rate, pressure <strong>and</strong> pressure cycling from start-uplshutdown<strong>and</strong> lift systems will at least sometimes increase s<strong>and</strong> flow. Influx of water <strong>and</strong> nearing for-14-13
1. More effective control of s<strong>and</strong> in long intervals.2. Less subject to deterioration with time than the resin coated bonding techniques.3. Can be used at any stage of the well life; even in wells that have already produced s<strong>and</strong>.4. Allows high productivity from virtually any type of formation <strong>and</strong> can accept any permeabilityvariance in the formation.The disadvantages of gravel pack completions are:1. The wellbore is restricted due to the presence of gravel inside the wellbore screen or wellbore/liner annulus.2. Almost all well repairs require removal of the screen liner <strong>and</strong> gravel pack prior to work.3. Screens must be selected to resist corrosion <strong>and</strong> erosion by produced fluids.4. Separation of injected fluids or isolation of undesirable water or gas production is very difficult.5. The s<strong>and</strong> involved in gravel packing operations is susceptible to attack in thermal wells.In order to design a gravel pack completion, the size of the formation s<strong>and</strong> grains <strong>and</strong> the fines mustbe known.32b3 Gravel size in a gravel pack is selected based on the size of the s<strong>and</strong> in the formation.Several s<strong>and</strong> sieve analysis are required to accurately describe the formation with a minimum ananalysis every 1 to 5 ft of pay zone. S<strong>and</strong> sizes may change over the height of the zone <strong>and</strong> a screenor gravel pack that is sufficient to control the s<strong>and</strong> in one section of the well may be too coarse inanother section.The principle of the gravel pack is that the gravel will create a second, high permeability matrix onwhich the s<strong>and</strong> grains will bridge <strong>and</strong> form a stable interface without invasion, Figure 14.19.34*35 Flowof fluids are allowed but the movement of s<strong>and</strong> is stopped. The best gravel pack designs put this contactarea as far out away from the screen as is possible. The completion objectives are twofold:(1) create as little resistance to fluid flow as possible, <strong>and</strong> (2) stop s<strong>and</strong> production. The completionuses the largest size gravel that will stop the smallest formation s<strong>and</strong>. Permeabilities of the commonsizes of gravel are shown in Figure 14.2029-31 The variations in permeability at the same size rangesare caused by contamination of the gravel with larger <strong>and</strong> smaller particles. Note that the permeabilityreduction from initial permeability can be severe with even small amounts of under- or over-sizedgravel. The permeability of the undamaged gravel ranges is exceptionally large in comparison to thepermeability of a formation. The choice of gravel size or even tolerance of all grains within the sizerange might seem unimportant since the gravel permeabilities are so high. However, a Darcy law calculationof linear pressure drop produced by typical flow rates through undamaged <strong>and</strong> damagedpacks in comparison to an open hole will illustrate the problem: a void space (i.e., the open hole) isstill much higher in flow capacity than even the best sorted gravel. Even a thin boundary of low permeabilitygravel will create a intolerable restriction.The chief concerns in gravel selection are:1. Stopping the formation s<strong>and</strong> or the flowing “grains” or blocks of the formation without allowingthe small grains to invade the proppant or gravel pack. Early on, investigators found that the sizeof the gravel could be selected either on a bridging philosophy or a philosophy of stopping allinvasion. Because bridges were found to be inherently unstable at the high end of the bridgingrange (pore throats = 5-7 grain diameters), the failures of these bridges could lead to zones ofmixed gravel <strong>and</strong> formation grains, a result that ended in extremely low permeability near the for-14-16
(Arnoco)Figure 14.19: The fineslgravel interface of a thin section photo. Thegravel Is -40+60 mesh, <strong>and</strong> the formation is the Trinidad“U” s<strong>and</strong>.Samplev-2P-8P-8L-3H-2v-9v-1P-19v-7P-16MeshSize20-4020-4020-1 610-2040-6040-6040-6012-2016-3016-20Oversize(%IU00035.820.949.21.5032.4Undersize k, k, k Reduction(“w (darcies) (darcies) (%I19.2 63 1 32 48(from Boulet) Journal of <strong>Petroleum</strong> TechnologyFigure 14.20: Results of Permeability Determination for Selected Samplesmation gravel interface. The absolute stop criteria developed by such authors as Saucierfocused on the lower bridging end of the spectrum <strong>and</strong> generally culminated with about a 6:lmedian size of the gravel as compared to a median size of the formation grains.2. Maintaining high flow conductivity over the life of the well has generated into much more of aconcern since fracturing has been added to the conventional packing process. Part of the reasonfor confusion in sizing is the fact that fractures spread the drawdown out <strong>and</strong> less fluid velocityfrom the formation is expected. This means that there will be less energy to carry formationgrains into the pack. The opportunity is to be able to use this lower pressure drawdown <strong>and</strong> flowingdifferential to an advantage by using the higher conductivity, higher permeability gravels thatshould result in much higher flowrates.14-17
3.Protecting the screen from high velocity flow lengthens the life span of the screen. Screen plugginghas been identified by several researchers as occurring from:4.a. drill-in fluids that contain solids,b. precipitated materials from interaction of produced fluids with completion fluids,c. a precipitate reaction of produced fluids (scale asphaltenes, paraffin, etc.),d. fines from the formation in the form of clays, minerals, etc.Aspects of gravel placement. The one weak point in the application technology for any s<strong>and</strong> controlmethod is effective placement. Work has been progressing on several fronts, but the mostpromising methods of placement include alteration of fluids <strong>and</strong> equipment to better utilize fracturingtip screen-out philosophy.Variances in the gravel pack permeability are caused by size differences within the specified gravelsize range, roundness (Figure 14.21) <strong>and</strong> fines <strong>and</strong> debris.36 The sorting of the s<strong>and</strong> in the formationcan also play a major role on the gravel required for control. Smaller size, lower permeability gravelsare required to halt small formation s<strong>and</strong>.(zwolle & Davies, 1983)Figure 14.21: Adaptation of Krurnbein Roundness torate proppants <strong>and</strong> gravels.Gravel size is specified by the size of the formation Since s<strong>and</strong> sizes may change in a formationfrom top to bottom, the gravel size is selected to stop the finest s<strong>and</strong> in a well. For optimumpractical work, a size range of gravel must be specified that will stop the passage of the formations<strong>and</strong> without unduly restricting the fluid flow. The s<strong>and</strong> size is plotted on a reversed semilog plot asshown in Figure 14.22. Note that the gravel is listed as -10+20 mesh. This means that all the grainswill pass through a 10 mesh screen (U.S. st<strong>and</strong>ard sieve sizes) <strong>and</strong> will be retained (will not pass)through a 20 mesh. The size is correctly shown as -10+20 mesh. The position of the curves of thesized gravel <strong>and</strong> the formation s<strong>and</strong> is a quick indication of size. On this inverted X-axis semilog plot,the finer s<strong>and</strong>s are to the right (decreasing size scale), Figure 14.23. The slope of the middle sectionsof the plots are an indication of the sorting (the grouping of the grain sizes). When the grains are allvery close to the same size as in the case of the -10+20 mesh gravel, the slope is nearly vertical.In natural formations <strong>and</strong> s<strong>and</strong>s, many different grain sizes are present. In these more widely variedgrain size cases, the sorting is said to be poorer. Permeability decreases with poorer sorting. Afterplotting the s<strong>and</strong> sieve sizes on the plot of cumulative weight, Enter the graph at the 50% weightretained point (y-axis) <strong>and</strong> intersect the formation s<strong>and</strong> size plot.37 In Figure 14.24, three s<strong>and</strong>s sizesare plotted. Since the gravel must be selected to control the smallest s<strong>and</strong> in the formation, only the14-18
10001.0 0.1 0.01Figure 14.22: A plot of a -10+20 mesh s<strong>and</strong>. The verticalnature of the center section of theplot shows very good sorting (Minimumof fines <strong>and</strong> coarse particles).3:loowaBi 10O11854 3 2 98?654 3 2 98761% S20.1 0.m 0.001clslm lb, in.(Patton 8. Abott, PEI, 1981)Figure 14.23: Plots of uniformly sorted <strong>and</strong> poorly sorted s<strong>and</strong>samples on an inverted X-axis semilog plot.smallest s<strong>and</strong> is of concern. The 50% intersection of this plot results in an x-axis intersection of about0.004511. The gravel should be sized four to eight times this 50% size (a modification of Saucier's37work). This results in a gravel size of 0.018 <strong>and</strong> 0.036. With the help of the sieve size ranges inFigure 14.25, the 0.018 <strong>and</strong> 0.036" sizes translate into 40 mesh <strong>and</strong> 20 mesh respectively. The gravelpack would need -20+40 mesh gravel. Gravel is sold in common size ranges. If the calculations yieida non st<strong>and</strong>ard gravel range, select the next smaller common range. Common US. mesh size rangesfor gravel are: -4+8, -6+10, -8+12, -12+16, -1 0+20, -12+20, -16+20, -20+40, <strong>and</strong> -40+60. The gravelmust meet specific roundness <strong>and</strong> strength criteria <strong>and</strong> have as little fines or large particles (out ofsize range) as possible. The larger gravel size ranges are intended to control s<strong>and</strong> production in formationswith large s<strong>and</strong> particles <strong>and</strong> the smaller gravels are necessary in the fine s<strong>and</strong> reservoirs.The objective is to use a gravel that will stop s<strong>and</strong> production. For example, if the 50 percentile formations<strong>and</strong> grain size is 0.006 in. (0.15 mm, about 98 mesh), 4 <strong>and</strong> 8 times this size is 0.024 <strong>and</strong>0.048 in. which is equivalent to 29 mesh <strong>and</strong> 16 mesh respectively. Pick the next smaller range ofgravel from the common sizes. A -20+40 U.S. mesh gravel (0.017 to 0.033 in. or 0.42 to 0.84 mm)should be selected. In a finer s<strong>and</strong> with a 50 percentile size of 0.0035 (170 mesh), 4 <strong>and</strong> 8 timeswould give a minimum control gravel size of 0.014 in. (0.35 mm, 45 mesh) <strong>and</strong> 0.028 in. (0.71 mm,25 mesh). In this case, a -40+60 U.S. mesh gravel would be useful.14-19
10090eoa504 40U30Ug 20Y2 1000.05 0.01 ’ 0.001 0.0001S<strong>and</strong> grain diameter, in.(Sawolo et al., 1983)Figure 14.24: S<strong>and</strong> size distribution for three samples.In some cases, the smallest sized s<strong>and</strong> in a formation sequence is considerably smaller than the others<strong>and</strong>s. If selecting the gravel based on this smallest s<strong>and</strong> would result in a gravel of more than onecommon size range smaller than the gravel required to control the larger s<strong>and</strong> grain zones, considerationshould be given to not perforating the interval with the smallest size s<strong>and</strong>. This would be especiallytrue when the small s<strong>and</strong> size represents only a small portion of the pay thickness or where thesmall s<strong>and</strong> size zone is in communication with a larger s<strong>and</strong> zone (the larger grain zone will effectivelydrain the smaller grain zone).Alternate Gravel Sizing MethodsCurrent gravel pack completion designs generally do a good job at preventing reservoir s<strong>and</strong> invasionwith reservoir s<strong>and</strong> that has a “normal” distribution pattern. When the formation s<strong>and</strong> is on eitherextreme of the normal sorting of coarse <strong>and</strong> fine particles, the question arises as to whether a barescreen could be used or is a frac pack needed to control fines movement. For reservoir s<strong>and</strong> distributionsthat are skewed towards finer s<strong>and</strong>s <strong>and</strong>/or where large amounts of fines predominate, skinsfrom traditional gravel pack <strong>and</strong> screen completions can be high (may even increase with time) <strong>and</strong>failures have occurred.Although gravel packing is a well established completion mechanism, the amount of damage seenafter packing is often severe. The cause of this damage takes many forms, but increasingly, the size<strong>and</strong> presence of formation fines is recognized as one of the major contributors to this damage. Theaction of fines as a flow restriction in a gravel packed completion is known, but often only consideredas an existing condition immediately after the completion. Often however, skins increase over timewith production, with migrating fines blamed as a major culprit. There is data that the gravel packdesign may actually be a contributor to this damage in some cases.53The principle fines suspected are sub 325 mesh ( ~44 microns) grains (clay sized fines) from the formation.The origin of the fines is still a point of research, but a few causes are understood about whatturns these fines loose in the formation. When these fines are present in the right size or in largequantities, or when the formations are poorly sorted (a very wide size range between minimum <strong>and</strong>maximum grain size), the result is often invasion by the finest particles into the pores, reducing permeabilityin the critical near-wellbore area.14-20
10001.0 0.1 0.01Figure 14.22: A plot of a -10+20 mesh s<strong>and</strong>. The verticalnature of the center section of theplot shows very good sorting (Minimumof fines <strong>and</strong> coarse particles)., PEI, 1981)Figure 14.23: Plots of uniformly sorted <strong>and</strong> poorly sorted s<strong>and</strong>samples on an inverted X-axis semilog plot.smallest s<strong>and</strong> is of concern. The 50% intersection of this plot results in an x-axis intersection of about0.0045". The gravel should be sized four to eight times this 50% size (a modification of Saucier's37work). This results in a gravel size of 0.018 <strong>and</strong> 0.036. With the help of the sieve size ranges inFigure 14.25, the 0.018 <strong>and</strong> 0.036" sizes translate into 40 mesh <strong>and</strong> 20 mesh respectively. The gravelpack would need -20+40 mesh gravel. Gravel is sold in common size ranges. If the calculations yielda non st<strong>and</strong>ard gravel range, select the next smaller common range. Common U.S. mesh size rangesfor gravel are: -4+8, -6+10, -8+12, -1 2+16, -1 0+20, -1 2+20, -1 6+20, -20+40, <strong>and</strong> -40+60. The gravelmust meet specific roundness <strong>and</strong> strength criteria <strong>and</strong> have as little fines or large particles (out ofsize range) as possible. The larger gravel size ranges are intended to control s<strong>and</strong> production in formationswith large s<strong>and</strong> particles <strong>and</strong> the smaller gravels are necessary in the fine s<strong>and</strong> reservoirs.The objective is to use a gravel that will stop s<strong>and</strong> production. For example, if the 50 percentile formations<strong>and</strong> grain size is 0.006 in. (0.15 mm, about 98 mesh), 4 <strong>and</strong> 8 times this size is 0.024 <strong>and</strong>0.048 in. which is equivalent to 29 mesh <strong>and</strong> 16 mesh respectively. Pick the next smaller range ofgravel from the common sizes. A -20+40 US. mesh gravel (0.017 to 0.033 in. or 0.42 to 0.84 mm)should be selected. In a finer s<strong>and</strong> with a 50 percentile size of 0.0035 (170 mesh), 4 <strong>and</strong> 8 timeswould give a minimum control gravel size of 0.014 in. (0.35 mm, 45 mesh) <strong>and</strong> 0.028 in. (0.71 mm,25 mesh). In this case, a -40+60 U.S. mesh gravel would be useful.14-19
10090m5 60a 505 40UE 30Ui$ 2002 1000.05 0.01 ’ 0.001 0.0001S<strong>and</strong> grain diameter, in.(Sawolo et al., 1983)Figure 14.24: S<strong>and</strong> size distribution for three samples.In some cases, the smallest sized s<strong>and</strong> in a formation sequence is considerably smaller than the others<strong>and</strong>s. If selecting the gravel based on this smallest s<strong>and</strong> would result in a gravel of more than onecommon size range smaller than the gravel required to control the larger s<strong>and</strong> grain zones, considerationshould be given to not perforating the interval with the smallest size s<strong>and</strong>. This would be especiallytrue when the small s<strong>and</strong> size represents only a small portion of the pay thickness or where thesmall s<strong>and</strong> size zone is in communication with a larger s<strong>and</strong> zone (the larger grain zone will effectivelydrain the smaller grain zone).Alternate Gravel Sizing MethodsCurrent gravel pack completion designs generally do a good job at preventing reservoir s<strong>and</strong> invasionwith reservoir s<strong>and</strong> that has a “normal” distribution pattern. When the formation s<strong>and</strong> is on eitherextreme of the normal sorting of coarse <strong>and</strong> fine particles, the question arises as to whether a barescreen could be used or is a frac pack needed to control fines movement. For reservoir s<strong>and</strong> distributionsthat are skewed towards finer s<strong>and</strong>s <strong>and</strong>/or where large amounts of fines predominate, skinsfrom traditional gravel pack <strong>and</strong> screen completions can be high (may even increase with time) <strong>and</strong>failures have occurred.Although gravel packing is a well established completion mechanism, the amount of damage seenafter packing is often severe. The cause of this damage takes many forms, but increasingly, the size<strong>and</strong> presence of formation fines is recognized as one of the major contributors to this damage. Theaction of fines as a flow restriction in a gravel packed completion is known, but often only consideredas an existing condition immediately after the completion. Often however, skins increase over timewith production, with migrating fines blamed as a major culprit. There is data that the gravel packdesign may actually be a contributor to this damage in some cases.53The principle fines suspected are sub 325 mesh ( ~44 microns) grains (clay sized fines) from the formation.The origin of the fines is still a point of research, but a few causes are understood about whatturns these fines loose in the formation. When these fines are present in the right size or in largequantities, or when the formations are poorly sorted (a very wide size range between minimum <strong>and</strong>maximum grain size), the result is often invasion by the finest particles into the pores, reducing permeabilityin the critical near-wellbore area.14-20
U.S.MeshFall RateD (mm) D (in.) in Water(Wmin.)44./6 0.1 8/5 4 0.1576 3.36 0.132 IFigure 14:25: Sizes of US Mesh Sieve SeriesBackground from published literature in this area is extensive, but most of the data from field operationshas focused on near well damage caused by screen damage from drilling <strong>and</strong> completion fluids,perforation flow dynamics, gel damage from packing or fluid loss control fluids or out-of-specificationgravel. Related work to this study appear to be limited to a few authors that recognize some componentof the contribution to flow restriction of fines along the gravel pack interface or the ~ creen.~~-~~Current Gravel Pack Design Methods <strong>and</strong> Problem IdentificationSaucier <strong>and</strong> others solidified gravel pack selection criteria with several studies in the 1960’s <strong>and</strong> 70’sthat led to the often applied gravel sizing criteria based on 6 times the 50% particle Theresultant plot, Figure 14.24, is a typical design aid used in most current gravel sizing studies.6314-21
The use of this criteria has proven effective for stopping s<strong>and</strong> in most formations; however, there havebeen a number of papers in the 1990’s investigating productivity impairment to s<strong>and</strong> control completionsin general <strong>and</strong> gravel packed completions in partic~lar.~~-~~ In looking at these papers, the averageskin damage values to gravel packed completions are ranging from a low of around +10 to over+50 even on completions that do not report obvious completions based problems. Recently publisheddata has shown that the average skin calculated for frac-packed completions ranges from a skin of -2to 5.67-72An evaluation of gravel pack failures identified several cases that support a change in the way gravel<strong>and</strong> screens are sized. The data is interesting, <strong>and</strong> becoming more conclusive, that the size, type <strong>and</strong>quantity of “fine” particles (sub 325 mesh = 0.001 7 in. = 44 microns) may play a significant role inplugging both gravel packs <strong>and</strong> screens. The sub 325 mesh was selected, because the average poresize of the 40/60 mesh gravel (smallest common gravel pack gravel) is about 45 microns. This size<strong>and</strong> smaller particles can enter the pores <strong>and</strong> can bridge inside the pack. Additionally, large masses ofparticles in this size range can plug the formation/gravel pack interface, causing significant damageskins. The created pressure drop at the interface is also a catalyst for scale formation. This has beendocumented on small-grained formations.In practical engineering investigations of screen failures in several parts of the world (both vertical <strong>and</strong>horizontal wells), unpublished accounts of the completion behavior immediately before the screenfailed showed several cases where the pressure inside the screen fell sharply while the reservoir pressureremained the same (or built up?). One explanation for this behavior is that the screens, <strong>and</strong> insome cases the gravel packs, were plugging with fines, becoming, in effect, blank pipe sections; thusthe failures may have been more related to hydraulic collapses than mechanical crush events. Thissame occurrence may take place in vertical wells.Mobility of Fines.One key consideration needing to be considered is the mobility of fine particles. When fine particlesare present, the quantity of the fines available to move <strong>and</strong> form a seal is critical. The sub 325 meshvalue may be misleading, especially if the fines are bound in aggregates <strong>and</strong> are not free on an individualbasis. Careful geological analysis <strong>and</strong> testing should be undertaken to make this importantdetermination. Certainly, if the formation fails due to changes to the in-situ forces keeping a weak formationconsolidated, individual fines would be available to plug flow paths <strong>and</strong> reduce flow capacity.For a typical formation, fines greater than 5% or so would provide a sufficient quantity to bridge <strong>and</strong>seal against the medium <strong>and</strong> coarse particles at the interface of the gravel pack.Fines can be loosened by other mechanisms short of formation failure <strong>and</strong> these factors need to beconsidered as well. Particle movement in the formation can be triggered by physical force (drag forceson the particle from flowing fluids), by chemical repulslon/attraction, by breaking the binding force tothe formation host grain <strong>and</strong> by a chemical upset where the particles are held in suspension.Common causes of particle movement are:1.2.3.4.High shear force on the solids by flowing liquids, especially at high flow rates <strong>and</strong> with high viscosityfluids.Acids - pH shift is a chemical upset, as is the 70,000+ ppm equivalent chloride ion strength -often flocculates polymers, silica <strong>and</strong> some dispersed particulates such as asphaltenes. Veryminor effect on most s<strong>and</strong>s however.Mutual solvents22 -the solvents can disperse fines by removing the liquid surrounding the grainthat may be binding the fines to the host grain. Limited by contact.Change in salinity of fluids invading formation - most likely form of damage mechanism fromSmectites <strong>and</strong> dispersible clays. Often liberates particles in the 1 to 5 micron size.14-22
5. Solvents that reduce viscosity of a trapped liquid layer that may be holding fines.6. And, by far, the most likely problem, is the disaggregation of the matrix of the formation bychange in water saturation or overburden increase.There are few practical methods of preventing fines from flowing in a producing formation where finesare naturally or easily liberated: the act of fluids production can be a strong fines mover. Only by bridgingthe fines, keeping the drawdown low (limiting production), or spreading the drawdown out(improved reservoir contact by fracturing, open hole gravel packs, high rate water packing, horizontalwells, etc.), can the fines be stopped. Bridging the fines is usually very flow restrictive. Where finesonly flow for short periods early in the life of the well, rate limiting may be effective. But, where finesare part of the producing challenge over the life of the well, h<strong>and</strong>ling by preventing their flow or passingthem through the completion appears to be the best option.S<strong>and</strong> Sorting ConsiderationsThe sorting ratios discussed in previous paragraphs can be obtained from a simple sieve analysis.The advantage of the sieve analysis is that it can run easily on almost any sample regardless of thecondition. These ratios <strong>and</strong> other data do not say anything about the potential for fines migration. Thatvery important piece of information is still to be addressed by a s<strong>and</strong> strength model. The “D” designationsin the table refer to the sieve size distributions (cumulative%). The D40/D90 ratio, for example, isthe sieve opening (in inches, mm or microns) above which 40% of the s<strong>and</strong> is retained, divided by thesieve opening (same measurement) above which 90% of the s<strong>and</strong> is retained. An example from amoderate size, well sorted formation yields a D40 of 0.0098 in. (60 mesh), divided by a D90 of0.0035 in. (170 mesh) to give a D40/D90 of 2.8. A more poorly sorted example would be a D40 of0.01 7 in. (40 mesh) <strong>and</strong> a D90 of 0.001 7 in. (325 mesh), which yields a D40/D90 of 10.Two formations may have similar sortings but very different sizing. A formation with a D40/D90 of0.02 in./0.0049 in. = 5, has approximately the same sorting as a formation with a D40/D90 of0.0049 in./0.001 in. = 5, but the D50% of the first formation is about 0.017 in. (40 mesh) <strong>and</strong> the D50%of the second formation is about 0.0041 in. (140 mesh). At first, the difference in sizing in these twoformations with essentially the same sorting may seem to invalidate the ratio sorting parameter, butthe real considerations that we are trying to describe are the ability of the formation to form blockages.The sorting is a measurement of the ratio of coarser to finer particles. The larger the ratio, the largerthe range between the coarse <strong>and</strong> fine particles <strong>and</strong> the more likely the formation s<strong>and</strong> grains are toform bridges <strong>and</strong> lower the permeability. The smaller the ratio, the more permeability is preserved. Forexample, gravel is sized in tight ranges, like 12/20 mesh, with a D40/D90 of 0.056 in./0.039 = 1.4;20/40 mesh, where the D40/D90 ratio is about 0.028/0.019 = 1.5; or 40/60 mesh, with a D40/D90 of0.014/0.00.011 = 1.3. The sizing <strong>and</strong> the permeability of these gravels vary widely, but permeability ispreserved with the consistent pore sizes where plugging fines are absent (hence the low sortingratios). Addition of even small amounts of fines to the gravel (see Figure 14.20) can sharply lowerpermeability.Formations with low sorting values should be completed in a different manner from formations withhigh sorting values, where fines will plug off on screens or secondary (larger formation s<strong>and</strong> grains)matrixes over the screens. For D40/D90 sorting values of 1 to 3, consider bare screen completions,particularly if the permeability of the formation s<strong>and</strong> is high enough (1 to 2 Darcies or higher) to preventcreation of significant pressure drops through s<strong>and</strong> packed perforations.The actual level of the sorting value, where problems begin to show, is not exactly known, but roughranges are beginning to emerge, along with the knowledge that the screen filtration level itself isimportant in the selection of a maximum level of the ratio. It is important to note that the sorting minimumor maximum level may also change with the type of sorting definition. The D40/D90 has beenfound to be useful for determining whether bare screen completions (with conventional screens, prepackedscreens, or woven mesh screens) will work. For example, field data suggests that the level ofthe D40/D90 for an 80 micron weave screen is a maximum of 6. The 200 micron version of the sametype of weave screen has a maximum D40/D90 of 8.73 The coarser screens can pass more of the par-14-23
ticles without plugging, hence the higher limit on the ratio for c<strong>and</strong>idates. Levels of D40/D90 of 5 (fromempirical data) <strong>and</strong> above are warning signs of fines size that could plug any type of bare screen completion.Another sorting criteria, that of D1 O/D95 was selected based on the ability to see distinct variationbetween the size <strong>and</strong> sorting ranges of formation s<strong>and</strong>s. From the section on bridging agent performance,the ugly correlation between a wide particle size range <strong>and</strong> the potential to form apermeability-limiting bridge is evident. The “coarse end” of the formation s<strong>and</strong> size spectrum, the D-1 O, is important, although less so than the fines.The biggest impact on productivity of a gravel pack is a three way contrast between the permeabilitiesof: the gravel, the formation <strong>and</strong> the interface layer between the formation <strong>and</strong> the gravel.53 From thebeds-in-series relationship, the major impact is preserving the permeability of the otherwise thin interfacelayer. The factor that can most dominate on this layer is the presence of fines that can fill thepores of the larger grains <strong>and</strong> reduce permeability sharply. The D1 O/D95 ratio increases sharply with afiner size of s<strong>and</strong> at the D95 position. For this reason, it is a good indicator of potential problems withultra wide range of particle size, one that can predict problems with a particle size range that is toowide. For the D1 O/D95 ratio, levels above 10 are considered high.Benefits of Larger GravelThe accepted basis for gravel sizing in gravel packing design focuses in on preventing invasion intothe matrix created by the gravel. In the 1970’s, Chevron showed that too large a gravel, specificallythose designs based on a bridging concept, would be invaded by formation s<strong>and</strong> <strong>and</strong> the gravel permeabilitywould be sharply lowered.74 The problem was created by filling of the pore spaces betweenthe gravel with fines from the formation. Since that work, several authors have proposed that certainformations could use larger gravels <strong>and</strong> proved the point by gravel packing with 7x through 9x sizedgravels. The formations that respond well to this approach are clearly in the minority. A quick study oftheir character shows that they are the larger grained, more well sorted s<strong>and</strong>s, typically with little or nofines .75976When the sorting methods presented here indicate a well sorted formation that requires gravel packing,larger, rounder, gravel, with a tighter size range may be of value in improving flow capacitythrough lowering pressure drop <strong>and</strong> improving conductivity. Before taking on the issue of gravel sizingin the special (well sorted) formations, it may be of use to consider ways of improving both interfacecontrol <strong>and</strong> gravel permeability. The permeability of the gravel is controlled by the size of the poresthat a stressed gravel pack presents to the formation <strong>and</strong> maintains between the formation <strong>and</strong> thescreen. Long known methods of improving gravel permeability are:1. Using a rounder gravel (presents a more constant pore size <strong>and</strong> higher permeability)2. Using a gravel that contains less initial out-of-range particles,3. Using a gravel that produces less fines during h<strong>and</strong>ling <strong>and</strong> placement (stronger)4. Using a gravel with a narrower size range.The rounder gravel offers sharply higher permeability <strong>and</strong> less fines created in the gravel h<strong>and</strong>ling <strong>and</strong>placement steps. The synthetic gravels offer much rounder profiles <strong>and</strong> greater strengths for only asmall increase in cost over regular gravels.Resieving gravel, especially synthetic gravels, is an amazingly cheap method of obtaining gravel withmore consistent pore sizes; an automatic way of achieving more permeability <strong>and</strong> less invasion. Thereis nothing magic about the presently available gravel sizes of -20+40 mesh, -30+50 mesh, etc. Thesemesh sizes were selected, at least in part, because the naturally occurring gravels could be screenedinto commercially saleable quantities in these ranges <strong>and</strong> the ranges offered what was considered14-24
good permeability. Selecting new ranges of say; -20+25 mesh or -30+35 mesh may seem unusual, butmay offer tremendous advantages in either the case of abundant fines or low fines content. Cost isminimal in comparison to benefits, especially in synthetic gravels.There are really two types of formations that may benefit from gravel sizes larger than the st<strong>and</strong>ard6x: those without significant fines <strong>and</strong> those with too many fines.Sorting Criteria The sorting criteria suggest that the following applications data should work (withother factors as noted).53 When all values are under the thresholds, the risk of damage is low wherethe formation s<strong>and</strong> is well described by the examined samples. These ratio <strong>and</strong> comparison thresholdsare:1. (D1 O/D95c10, D40/D901 Darcy formation permeability for cased<strong>and</strong> perforated completion, with possible use of prepacked screens).2. (D1 O/D951 Darcy formation permeability for cased <strong>and</strong> perforated completion).3. (DlO/D95l 0%) the highest ratios, particularly those coupledwith large amounts of fines signal a critical need for enlarging the wellbore (move thegravel/formation s<strong>and</strong> interface away from the wellbore), through fracturing, horizontal or multilateralwell technology underreaming, or large volume prepacking to minimize severe permeabilitydamage at the gravelh<strong>and</strong> interface due to flow.The next component of the gravel pack is the screen. The purpose of the screen is to stop the gravel.Screens are sized by the slot size between the wraps. This opening must be small enough to stop thesmallest particle in the gravel. The screens are wrapped <strong>and</strong> welded wire around a slotted liner. Thewire has a characteristic “keystone” design, Figure 14.26 is designed to completely pass any particlesmall enough to penetrate through the entry point. The slot opening is measured in thous<strong>and</strong>ths of aninch or gauge units. A 0.008 in. opening (0.2 mm) is an 8 gauge <strong>and</strong> a 0.01 6 in. opening (0.4 mm) is a16 gauge. The necessary screen opening should be at least two or three thous<strong>and</strong>ths of an inchsmaller than the minimum gravel size. Some authors recommend a screen opening of one-half of thesize of the smaller range of gravel size. Examples of successfully used screen/gravel combinationsare an 6 to 8 gauge screen for (6 mesh suggested for most jobs) -40+60 mesh gravel (0.0098 in.,0.25 mm smallest size) <strong>and</strong> a 20 gauge screen for -12+20 mesh gravel (0.017 in., 0.42 mm smallestsize).Larger body diameter screens offer more contact area with the gravel <strong>and</strong> are less susceptible to pluggingby debris, simply because they have more slot area. The newest screens on the market areexp<strong>and</strong>able screens that deform against the bore hole wall. The larger screen sizes will accept largerpumps or tools. Sometimes smaller diameter screens are used because gravel can shift in a largerannulus. Small annulus spaces are more stable when packed. For conventional screens <strong>and</strong> wheregravel will be used, a minimum clearance of 1 in. in a cased hole <strong>and</strong> 2 in. in an open hole should bedesigned into the completion. This clearance not only allows for more even packing, it also allows thescreen to be washed over <strong>and</strong> retrieved when the well has to be serviced. Since the success of thegravel pack depends upon a consistent, thick layer of gravel between the screen <strong>and</strong> the formation,the use of centralizers every 15 to 20 ft is absolutely necessary. The screen should extend at least 5 ft14-25
Figure 14.26: The keystone design of a wrapped screen.This sketch shows a screen opening that isdesigned to arch the gravel. Such a design isusually poor because it allows s<strong>and</strong> or gravelto be produced when the arch is broken.above <strong>and</strong> below the perforated interval. Blank pipe (non-screen) in the gravel packed interval shouldbe minimized unless special steps are taken to increase packing of void areas. A number of goodpapers deal with specific applications techniques.4049The screens which are most commonly used for s<strong>and</strong> control operations in coiled tubing are the smallerdiameter units which may be weave type (Figures 14.27 <strong>and</strong> 14.28). These small screens are very usefulfor throughtubing gravel packs or s<strong>and</strong> control repair operations although problems arise with the verysmall inflow area. The advantages of these systems are their low cost <strong>and</strong> ability to place the screen withoutrequiring a rig.Figure 14.27: Pall Stratopack.Carrier FluidsThere are several types of fluids available for placement of the gravel around the screen. The requirementsof a fluid are that it carry the gravel, be nondamaging to the formation, <strong>and</strong> be able to leakoff tothe formation or the screen <strong>and</strong> leave the gravel as a tightly compacted mass at the point of fluid exit.There should be an absolute minimum of polymer residue in the gravel after packing <strong>and</strong> backflow.Water, gelled water, crosslinked gelled water, foam, <strong>and</strong> gelled oil have all be used for gravel transport.There are two principle design types - conventional gravel packing (with ungelled water) <strong>and</strong>slurry pack techniques with gelled fluids <strong>and</strong> high gravel concentrations. Ungelled water may carry14-26
Figure 14.28: (pail)Figure 14.29:about 1 Ib of gravel per gallon while gelled or crosslinked gelled water may carry as much as 15 Ib ofgravel per gallon of gelled fluid.There is no set gravel volume for a well. Most operators try to put as much gravel as possible throughthe perfs without mixing the gravel with the formation s<strong>and</strong>. Ideal completions would be large cavitiesor fractures beyond the perfs, filled with clean gravel. By increasing the size of the interface betweenthe gravel <strong>and</strong> the formation s<strong>and</strong>, pressure drops have much less effect on production at any givenrate. The gravel volume should include the prepack (outside the Perforations <strong>and</strong> the perforation tunnels)<strong>and</strong> the annular volume (between screen <strong>and</strong> formation in an open hole completion or the insideof casing in a cased hole) of the interval from the sump packer set at the base of the zone to a point5 ft above the top perforations of the zone, plus about 10% excess. All gravel to be squeezed out ofthe perfs or into the formation must be added to the total. When the results of the caliper log are questionableon open hole completions, additional gravel should be readily available. The most successfulcompletions often use 100 or more pounds of gravel per foot, with most of this total as prepack (outsidethe perfs).14-27
Figure 14.30:The real key to the success of a gravel pack operation, after the proper equipment has been selected,is the care <strong>and</strong> technique of placement. Only a few of the techniques will be covered here <strong>and</strong> none indetail. Penberthy <strong>and</strong> Shaughnessy are recommended for further reading <strong>and</strong> as a source for treatmentspecifics.’EquipmentThe following equipment is typical of that used in gravel packing.1. The Sump Packer is run <strong>and</strong> set below the perfs <strong>and</strong> serves as a base for the gravel pack. It maybe either a seal bore packer in permanent or retrievable service. The packer creates a debrissump below the completion. (May also allow communication into screen if area below packer isnot adequately sealed.)2. A Snap Latch Assembly is an attachment to the sump packer verifying location of the workstring. A collet <strong>and</strong> a shoulder help identify that the gravel packing assembly has l<strong>and</strong>ed successfully.Forcing the collet through the seal bore causes a change in string weight: the weightchange disappears when the collet is through the bore <strong>and</strong> reappears when the shoulderengages the top of the packer.3. The lower tell-tale screen <strong>and</strong> an inner bore seal sub, in conjunction with the washpipe, create arestrictive flow path for the gravel slurry that helps assure that the bottom of the screen ispacked first <strong>and</strong> that the pack is “tight.” The washpipe extends as deep as possible into the baseof the 6 ft to 15 ft long telltale screen, leaving a small portion of the screen at the bottom to allowfluids to return, through the screen, to the surface. Lower telltale screens are rarely run.14-28
4. The washpipe is a smooth tube that is run with the gravel pack assembly <strong>and</strong> is later withdrawnat the end of the packing operation. The diameter of the washpipe must be at least 80% of theinside flowing diameter of the screen body. Although it may be used with the seals in the sealsub to form a positive barrier to flow, it usually creates a “hydraulic” seal (based on frictionalforces without the seal sub).5. The screen may be one of several types of devices designed to stop the smallest gravel in thepack. The screen should be centralized at least every joint <strong>and</strong> needs 1 in. to 3 in. radial clearancebetween screen OD <strong>and</strong> hole or casing ID. Excessive screen clearances can result in volumetricpacking problems. Clearances e 1 in. often result in bridging of gravel.6. Non-screen or blank pipe - Effective gravel packing requires fluid leakoff to create a tight s<strong>and</strong>pack. Blank sections do not typically pack well with conventional screens <strong>and</strong> depend on settling(in vertical wells). Minimize blank pipe sections or use alternate path methods.52 Higher slurryconcentrations help with gravel fill in blank sections but do not fully pack. Blank pipe abovescreen holds some gravel reserve at end of job.7. Shear-Out Safety Joint - At the top of the screen, between the screen <strong>and</strong> the tubing below thepacker, a shear released safety joint is usually run to insure that the packer <strong>and</strong> tubing can berecovered in the event that the well must be pulled. Screens are usually held tightly by the gravel<strong>and</strong> must be washed over.8. Crossover Tool -The crossover tool, as part of the gravel pack assembly, allows the gravel slurryfrom the surface to flow down the tubing <strong>and</strong> the crossover to the casingkcreen annulus to packthe well or enter the formation in a fracture treatment. The gravel pack tool can be shifted intodifferent positions, allowing gravel to be placed or reversed out at the end of the job. The size<strong>and</strong> shape of the crossover port is critical to prevention of erosion damage to the casing <strong>and</strong>breakage of the gravel.9. Gravel Pack Packer - The packer forms the upper limit of the annular wellbore <strong>and</strong> isolates producingpressures from the upper part of the casing. A number of packer choices are available.10. Workstring Sizing - Workstring sizing is important to deliver slurry at a constant gravel concentration.If the liquid flow down the string is too slow, the solids can settle faster than the flowresulting in “roping” or slugs of gravel. A displacement velocity of 500 fpm is recommended.Rate (bpm) - 0.485 (workstring I.D.)2Workstring OD2-318 in.2-718 in.3.5 in.4 in.4-112 in.Minimum Rate(bpm)234.56aPacking MethodsThere are two principle methods of gravel packing: water packing <strong>and</strong> slurry packing. Water packinguses water or brine (usually 2% KCI) to carry gravel at 0.5 to 1 Ib/gal. Advantages are low damage,high leakoff <strong>and</strong> low cost. Disadvantages are increased time <strong>and</strong> higher volumes of fluid used.Slurry packing uses many of the same tools <strong>and</strong> techniques as conventional or water gravel packingbut uses gelled water for the carrying fluid.14-29
Advantages of the slurry system are:1. a much faster treatment using up to 15 Ib gravel per gallon of carrier fluid instead of the 1 to 2 Ibused with water.2. less total liquid lost to the formation.Disadvantages include:1. More surface equipment required.2. More technology (<strong>and</strong> training) required for application.3. Formation damage from gelled fluids can be severe.Fluid Loss ControlS<strong>and</strong> producing formations are characterized by high permeability <strong>and</strong> many s<strong>and</strong> control completionsare severely <strong>and</strong> often permanently damaged by efforts to control fluid loss.Controlling fluid loss is necessary to keep the well full of fluid during a completion or workover. Somefluid loss is needed for gravel packing. If the fluid loss is too low, the wellbore cannot be effectivelypacked with gravel. If the losses are too high, well control is threatened. Losses in the range of 2 to10 bbl/hr are typical <strong>and</strong> the rate of loss before a job is frequently proportional to the productivity ofthe well after the completion.The methods of controlling fluid loss are discussed in the following paragraphs.1. Polymer pills are the most common fluid loss control method, but are also the most damaging.Pills of 80 to over 100 lb/bbl are common. A study of well productivity after use of these pillsfound them to be one of the worst damage events in the completion process.302. Graded size salt pills (free salt crystals suspended in a saturated brine) that bridge inside thescreen usually cause less damage than polymer pills, but are less stable (may have to be reapplied).3. Fluid loss requires permeability <strong>and</strong> a pressure differential toward the formation. By minimizingthe pressure differential, the rate of loss can be decreased. The problem is that many formationsare near balanced or even overbalanced with water. For these formations, gravel packing with oil(also used for extreme water sensitivity) or foam can be done. Both these fluids require precautions,<strong>and</strong> experience on the rig is critical.4. In a few cases where pressures are known <strong>and</strong> free gas is not produced, the fluid level in thewells could be allowed to drop, to equilibrium, so long as fluid level was monitored by sonic orother device.5. Mechanical controls such as flappers, check valves <strong>and</strong> other devices are usually only usedafter the pack is placed, or in very specialized designs. Use of these devices is usually a verygood protection barrier to protect the pack from damage.Alternate Path Gravel PackingOne problem experienced when placing gravel over a zone is the effect of a very high permeability inone part of the interval. Gravel placement requires fluid leakoff. But, if the leakoff is not relatively consistent,the losses in a very high permeability zone may often cause a bridge of gravel to form <strong>and</strong> the14-30
wellbore can become blocked. These bridges begin to be a problem where the permeability variancebetween minimum <strong>and</strong> maximum per zones is over one order of magnitude, <strong>and</strong> become a severeproblem where the permeability variation approaches or exceeds two orders of magnitude.When bridges do form, the use of alternate path technology is needed. This technology is incorporatedinto a screen design that uses tubes along the outside of the screen or build into the screenbody. The tubes allow gravel flow to divert around bridges, packing zones that would otherwise beimpossible to pack. Small holes in the tubes every few meters, allow the slurry to vent from the tubesinto the annulus below the bridge. The friction pressure of the gravel slurry in the tubes is high, insuringthat the slurry will depart the tube at the earliest opportunity <strong>and</strong> pack the annulus.Pressure Drops Across Gravel PacksPressure drop or loss across a gravel packed completion is caused by completion obstructions at theface of the formation, through perforations <strong>and</strong> gravel, <strong>and</strong> the screen. The loss may be eithermechanical <strong>and</strong>/or nondarcy flow dominated.For mechanical impedance only, based on a whole completion section, the loss is:AP= q~ln(rdrS)/27ckhwhere:APpqrcrskh= pressure drop= viscosity= fluid flow= outer radius= inner radius= permeability= heightThe dominant control on pressure drop is the permeability, which, although not known as a total valuecan be estimated for each element of the completion. Maximizing flow means optimizing permeabilityat every point in the completion. From several studies on pressure drop in gravel packed completions,the following ideas have been collected:1.2.3.4.Pressure drop is rather insensitive to annular clearance between the casing <strong>and</strong> the screen (aslong as the gravel is not damaged).51Pressure drop is mostly independent of nearby perforations, indicating perforation phase angleis not a critical variable in most completion^.^^The greatest perforating influence is the shot density <strong>and</strong> perforation diameter.51Damage to the formation permeability can cause severe restriction^.^^5.6.Damage to the gravel permeability has an influence on prod~ctivity.~’ The severity of the effectdepends upon the flow rate.The pressure drop of an undamaged screen is extremely low. But, since the open area of mostscreen is low (1 to 3% for conventional screens <strong>and</strong> 20% to 30% for weave screens), plugging bymobile fines is a distinct possibility.14-3 1
ExampleThe average permeability <strong>and</strong> the effect of damage on production can be estimated. In this example, a1 darcy formation with a drainage radius of 1,320 ft has a 6 in. wellbore with the first 0.1 in. of the formationdamaged to a permeability of 10 md (99%). The average perm (eq 11.11) is:kavg == 0.73 darcyThe productivity of the zone with the damage layer would be (eq 11.1 2):Using the preceding eql uations to make a sensitivity plot, Figure , the effect of damage <strong>and</strong> thicknessof damage are seen. The values of damage have to be extreme to cause significant effects on the productivity.The 99% damage (1% of initial perm) that is 0.1 in. thick, produces a well with 73% ofundamaged productivity (skin = +2.6). The 99.9% damage that is 0.1 in. thick, produces a well with21 % of undamaged productivity (skin = +26).0Effect of Damage Layer Thickness2 0.1>0.013'b0, 0.0010.01 0. I IDamaged Perm, %of initialFigure 14.31 :10-+ 0.01" thick0.05" thick0.1" thick- I" thickPack <strong>and</strong> Frac TechnologyS<strong>and</strong> control technology can be combined with fracturing in many instances. Even an unconsolidatedformation can be fractured, <strong>and</strong> production improvements have been documented on many unconsolidatedwells in the Gulf of Mexico with permeabilities from 50 to 500 md.The technology is relatively simple:14-32
1. A short, highly conductive fracture treatment is designed with tip screenout <strong>and</strong> very high proppantloading. The gravel pack screen is usually in the wellbore at the time of the fracture treatment.2. After the fracture job (<strong>and</strong> before backflow), the wellbore is gravel packed.Fracture lengths are short, usually on the order of 15 to 100 ft. The wellbores must be gravel packedin most cases to make sure that all the perforations are covered <strong>and</strong> none produce s<strong>and</strong>. Fracturingthe formations moves the maximum drawdown out into the formation <strong>and</strong> may reduce the tendency fors<strong>and</strong> moveout. A variety of fluids are in use as fracturing fluids; the only criteria are: ability to quicklycontrol leakoff in the high perm s<strong>and</strong>s <strong>and</strong> ability to carry the high proppant loadings. In most cases,the pad fluid makes the initial fracture <strong>and</strong> seals the walls of the fracture. The proppant carrying slurryis then forced into the fracture <strong>and</strong> maximum leakoff occurs as the fracture is extended, leading to atip screenout <strong>and</strong> maximum packing of proppant.Reservoir Lamination <strong>and</strong> Well DeviationMultilayer pays including those with laminations, shale streaks, or low vertical permeability all must be consideredwithin the context of small individual reservoirs. To ideally drain these reservoirs requires adequatewellbore contact with each of these small unit reservoirs. The best way to establish this type of contact isthrough a fracture treatment extending at least a few feet away from the wellbore or with a multi-lateralwell. The number of feet of extension or the length of the lateral is directly related to the amount of permeability<strong>and</strong> the viscosity of the flowing fluids. For fracture methods, fracture designs are typically tip screenout(TSO), although water frac designs <strong>and</strong> other fracturing design work is usually considered. The differencein their use is the permeability level of the formation <strong>and</strong> the necessary flow capacity of the fracture.One of the biggest problems in frac packing high-rate wells is the near-wellbore connection, including fracturecontact with the wellbore <strong>and</strong> perforations. The limitations appear to be turbulence in the gravelpacked perforations which could be decreased by increasing the gravel size or the number of perforatingor aligning the perfs with fracture direction.Other Unstable FormationsBesides s<strong>and</strong>s, some chalks, shales, coals, siltstones, rubble zones <strong>and</strong> other formations will producefines. The reasons for particle flow depend on the type of the formation, although the principle causeis mechanical failure. Like the s<strong>and</strong>stones that undergo shear failure, some shales, chalks <strong>and</strong> coalswill also produce solids in response to an increasing net overburden stress. The production of the porefluids near the wellbore combined with the slow replacement of these fluids through the matrix, createsa pressure imbalance that is often sufficient to cause brittle failure of the formation at theexposed face of the wellbore. The failure may be accelerated by drying of the formation, lubrication byliquids, or salinity shock in a water sensitive formation. Shear is increased by high drawdownsimposed when permeability is lowered by damage, compression or relative permeability. Spalling <strong>and</strong>some other failures can be controlled by limiting drawdown or by using gravel pack technology.The steps involved in gravel packing will vary for the type of treatment being done. The basic stepswhich are common to all graveI.packing operations are:1. The gravel is selected based on stopping the formation s<strong>and</strong>.2. A sump packer or other device is run into the hole to a point where the base of the screenassembly will be set.3. The centralized screen gravel pack packer <strong>and</strong> tubing is then run into the hole <strong>and</strong> located onthe sump packer.14-33
4. The gravel pack packer is set, the bypass from the tubing to the hole screen annulus is opened,<strong>and</strong> a gravel slurry in either water or a gelled fluid is injected down the tubing <strong>and</strong> through thecrossover into the annular area.5. The fluid carries the gravel into the annular area. The fluid deposits the gravel as it leaks off intothe formation <strong>and</strong>/,or is returned to the surface by leaking through the screen. Fluids that leakthrough the screen are taken up the washpipe to the crossover where they are routed into theannular area above the packer <strong>and</strong> returned to the surface. Most fluids used in this manner arenot recirculated.6. As the gravel fill increases in the annular area, the screen <strong>and</strong> perforations are covered. Thedrag created by the fluid flowing through the pack to the perforations <strong>and</strong>/or the screen creates atight pack of gravel in the annular area.7. After the annular area is filled to the top of the perforations or the openhole interval, the pressureat the surfaces rises rapidly because the fluid has to flow through the gravel to get to a point ofleakoff. Gravel injection at the surface is stopped, <strong>and</strong> the gravel in the annular area between thescreen <strong>and</strong> the packer settles by gravity onto the pack above the perforations or openhole section.8. The gravel pack packer is shifted <strong>and</strong> the well is reverse-circulated by pumping down the annulus(above the packer) <strong>and</strong> up the tubing to remove the s<strong>and</strong>-laden slurry that is in tubing.9. In some designs the gravel pack packer can then be shifted to allow pressuring of the annulararea to attempt to squeeze more gravel into the formation or to make the pack tighter.The use of a washpipe inside the screen during gravel packing is an attempt to make the fluid flowthrough the pack to the bottom of the screen before it returns from the well. This increases the dragthrough the pack <strong>and</strong> accounts for a tighter gravel pack. The size of the washpipe is usually 80% ofthe ID of the screen.There are very few differences between packing openhole completions <strong>and</strong> packing cased hole completions.In either case, the formation is often washed before gravel packing to increase the size of thecavities in the formation or the formations may be fractured with a s<strong>and</strong>-carrying fluid before thescreen is run into the well. Washing of the perforations or the openhole will create larger voids but isonly effective if the voids remain open <strong>and</strong> can be filled with gravel without mixing with the formations<strong>and</strong>. Fractured completions that will be gravel packed increase the effective wellbore radius by puttinga short, high permeability fracture into the formation.<strong>References</strong> - Gravel Pack1. Penberthy, W. L., Jr., Shaughnessy, C. M.: S<strong>and</strong> Control, Society of <strong>Petroleum</strong> Engineers, Richardson,Texas, 1992.2. Sparlin, D., Hagen, R.: “S<strong>and</strong> Control,” International Completion Consultants (Houston), 1986.3. Tippie, D. B., VanPoolen, H. K., Kohlhaas, C. A.: “Variation of Skin Damage with Flow RateAssociated with S<strong>and</strong> Flow or Stability in Unconsolidated-S<strong>and</strong> Reservoir,” SPE Paper 4886,44th California Regional Meeting, April 4-5, 1974, San Francisco.4. Morita, N. Whitfill, D. L., Massie, I., Knudsen, T. W.,: “Realistic S<strong>and</strong>-Production Prediction:Numerical Approach,” SPE Prod. Eng., (Feb. 1989), pp. 15-24.5. Morita, N. Whitfill, D. L., Fedde, 0. P., Lovik, T. H.: “Parametric Study of S<strong>and</strong> Production Prediction:Analytical Approach,” SPE Prod. Eng., (Feb. 1989), pp. 25-33.14-34
6. Stein, N.: “Mechanical Properties of Friable S<strong>and</strong>s From Conventional Log Data,” JPT, (July1976), pp. 757-763.7. Stein, N.: “Calculate Drawdown that Will Cause S<strong>and</strong> Production,” World <strong>Oil</strong>, (April 1988), pp.48-49.8. Stein, N.: “Designing Gravel Packs For Changing Well Conditions,” World <strong>Oil</strong> (Feb. 1, 1983, pp.41 -47.9. Stein, N.: “Determine Properties of Friable Formation S<strong>and</strong>s,” World <strong>Oil</strong>, March 1988, pp. 33,34,37.10. Stein, N.: “Mud Weight Correction Gives Better S<strong>and</strong> Strength Estimates,” World <strong>Oil</strong>, (March1989), pp. 61-63.11. Hall, C. D., Harrisberger, W. H.: “Stability of S<strong>and</strong> Arches: A Key to S<strong>and</strong> Control,” JPT, July1970, pp. 821-829.12. Bratli, R. K.: “Stability <strong>and</strong> Failure of S<strong>and</strong> Arches,” SPEJ, April 1981, pp. 236-248.13. Risnes, R., Bratli, R. K., Horsrud, P.: “S<strong>and</strong> Stresses Around a Wellbore,” SPE 9650, Bahrain,March 9-1 2, 1981.14. Veeken, C. A. M., Davies, D. R., Kenter, C. J., Kooijman, A. P.: “S<strong>and</strong> Production PredictionReview: Developing <strong>and</strong> Integrated Approach,” SPE 22792, Dallas, Oct. 3-9, 1991.15. Chow, C.: “New Method to Assess S<strong>and</strong> Production Risk: Laboratory Development <strong>and</strong> FieldTest Results,” SPE 28284, Unpublished.16. Morita, N., Whitfill, D. L., Massie, I.: “Realistic S<strong>and</strong>-Production Prediction: NumericalApproach,” SPE Prod. Eng., Feb. 1989, pp. 15-24.17. Santarelli, F. J., Ouadfel, H., Zundel, J. P.: “Optimizing the Completion Procedure to MinimizeS<strong>and</strong> Production Risk,” SPE 22797, Dallas, Oct. 6-9, 1991.18. Stein, N., Hilchie, D. W.: “Estimating the Maximum Production Rate Possible from Friable S<strong>and</strong>stonesWithout Using S<strong>and</strong> Control,” JPT, June 1972, pp. 11 57-1 160.19. Chalambor, A., Hayatdavoudi, A., Alcocer, C. F., Koliba, R. J.: “Predicting S<strong>and</strong> Production inU.S. Gulf Coast <strong>Gas</strong> Wells Producing Free Water,”20. Weingarten, J. S., Perkins, T. K.: “Prediction of S<strong>and</strong> Production in <strong>Gas</strong> Wells: Methods <strong>and</strong> Gulfof Mexico Case Studies,” SPE 24747.21. Morita, N. McLeod, H. 0.: “Oriented Perforations to Prevent Casing Collapse for Highly InclinedWells,” SPE 28556, New Orleans, LA, Sept. 24-2-6, 1994.22. Schlumberger Log Interpretation Principles/Applications, 1987, p. 193.23. Domenico, S. N.: “Elastic Properties of Unconsolidated Porous S<strong>and</strong> Reservoirs,” 46th AnnualInternational SEG Mtg., Oct. 27, 1976, Houston.24. Onyia, E. C.: “Relationships Between Formation Strength, Drilling Strength, <strong>and</strong> Electric LogProperties,” SPE 181 66, Annual Tech. Conf., Houston, Oct. 2-5, 1988.14-35
25.26.27.28.29.30.31.32.33.34.35.36.37.38.39.40.41.42.43.Sage, B. J., Lacey, W.N.: “Effectiveness of Gravel Screens,” Trans, AIME, 1942.Flanigan, M. J.: “Smaller Gravel <strong>and</strong> Coated Screens Enhance 50-Year Old Field,” J. Pet. Tech.(May 1980), pp. 757-763.Muecke, T. W.: “S<strong>and</strong> Consolidation: A Study of Plastic Failure Mechanisms,” SPE 4354, <strong>Oil</strong>fieldChemistry Symposium, Denver, May 24-25, 1973.Dees, J. M.: “S<strong>and</strong> Control in Wells with <strong>Gas</strong> Generator <strong>and</strong> Resin,” SPE 24841, presented atthe 67th Annual SPE Mtg., Washington D.C., Oct. 4-7, 1992.Sparlin, D. D.: “S<strong>and</strong> <strong>and</strong> Gravel - A Study of Their Permeabilities,” SPE Paper 4772, Symposiumon Formation Damage Control, New Orleans, Feb. 7-8, 1974.Zwolle, S., Davies, D. R.: “Gravel Packing S<strong>and</strong> Quality - A Quantitative Study,” J. Pet. Tech.(June 1983), pp. 1042-1 050.Boulet, D. P.: “Gravel for S<strong>and</strong> Control: A Study of Quality Control,” J. Pet. Tech. (Feb. 1979), pp.164-1 68.Mattx, C. C., McKinley, R. M., Clothier, A. T.: “Core Analysis of Unconsolidated <strong>and</strong> FriableS<strong>and</strong>s,” J.P.T., (Dec. 1975), pp. 1423-1432.Maly, G. P., Krueger, R. F.: “Improper Formation Sampling Leads to Improper Gravel Size Selection,”J.P.T., (Dec., 1971), pp. 1403-1408.Ledlow, L. B. <strong>and</strong> C. W. Sauer: “Recent Design, Placement <strong>and</strong> Evaluation Techniques Lead toImproved Gravel Pack Performance,” SPE paper 141 62 presented at the 60th Annual TechnicalConference, Las Vegas, September 22-25, 1985.Shryock, S. G., Dunlap, R. G., Millhone, R. S.: Millhone, R. S.: “Preliminary Results from Full-Scale Gravel Packing Studies,” J. Pet. Tech. (June 1979), pp. 669-675.Krumbein, W.C., Sloss, L. L.: Stratigraphy <strong>and</strong> Sedimentation, Freeman <strong>and</strong> Co., (1 953).Saucier, R. J.: “Considerations in Gravel Pack Design,” J.P.T., Feb. 1974, pp. 205-212.Shryock, S. G.: “Gravel-Packing Studies in a Full-Scale Deviated Model Wellbore,” J. Pet. Tech.(March 1983), pp. 603-609.Shryock, S. G., Milhone, R. S.: “Gravel-Packing Studies in a Full-scale, Vertical Model Wellbore- Progress Report,” J. Pet. Tech. (July 1980), pp. 11 37-1 143.Penberthy, W. L.: “Gravel Placement Through Perforations <strong>and</strong> Perforation Cleaning for GravelPacking,” J. Pet. Tech. (Feb. 1988), pp. 229-236.Patton, L. Douglas <strong>and</strong> William A. Abbott: “Well Completions <strong>and</strong> Workovers,” <strong>Petroleum</strong> EngineerInternational, November 1981, pp. 156-1 76.Weissenburger, K. W., Morita, N., Martin, A. J., Whitfill, D. L.: “The <strong>Engineering</strong> Approach toS<strong>and</strong> Production Prediction,” SPE 16892, 62nd Annual Tech. Conf., Dallas, Sept. 27-30, 1987.Trahan, G. J., Spies, R. J.: “A Technique for Making High-Rate Completions in Partially Pressure-DeplatedUnconsolidated Reservoirs,” J. Pet. Tech. (Jan. 1983), pp. 56-60.14-36
44. Houchin, R. L., Dunlap, D. D., Hutchinson, J. E.: “Formation Damage During Gravel Pack Completions,”SPE 171 66, Formation Damage Symposium, Bakersfield, Feb. 8-9, 1988.45. Christian, W. W., Ayres, H. J.: “Formation Damage Control in S<strong>and</strong> Control <strong>and</strong> StimulationWork,” SPE 4775, Symposium on Formation Damage Control, New Orleans, Feb. 7-8, 1974.46. Nini, C. J. <strong>and</strong> G. W. Owen: “Successful High-Angle Gravel Packing Techniques,” SPE 121 05presented at the 58th Annual Technical Conference <strong>and</strong> Exhibition, San Francisco, October 5-8,1983.47. Elson, T. D., Anderson, G. W.: “Foam Gravel Packing,” SPE 11 01 3, presented at 57th AnnualMtg., Sept. 26-29, 1982, New Orleans.48. Neal, M. R., Carroll, J. F.: “A Quantitative Approach to Gravel Pack Evaluation,” J. Pet. Tech.(June 1985), pp. 1035-1 040.49. Neal, Marvin R.: “Gravel Pack Evaluation,” Journal of <strong>Petroleum</strong> Technology, September 1983,pp. 1611-1616.50. Pashen, M. A., McLeod, H. 0.: “Analysis of Post Audits for Gulf of Mexico Completions Leads toContinuous Improvement in Completion Practices,” SPE 36460, Denver, 6-9 Oct., 1996.51. Yildiz, T., Longinais, J. P.: “Calculation of Pressure Losses Across Gravel Packs,” SPE 171 67.52. Bryant, D. W., Jones, L. G.: “Completion <strong>and</strong> Production Results from Alternate-Path Gravel-Packed Wells,” SPE Drilling <strong>and</strong> Completion, September, 1995.53. Tiffin, D. L., <strong>King</strong>, G. E., Larese, R. E., Britt, L. K.: “New Criteria for Gravel <strong>and</strong> Screen Selectionfor S<strong>and</strong> Control,” SPE 39437.54. Bigno, Y., M. B. Oyeneyin, <strong>and</strong> J. M. Peden: “Investigation of Pore-Blocking Mechanism inGravel Packs in the Management <strong>and</strong> Control of Fines Migration,” SPE 27342, presented at SPEInt‘l Formation Damage Control, Lafayette, LA, Feb 7-1 0, 1994.55. Oyeneyin, M. B., J. M. Peden, A. Hosseini, G. Ren, <strong>and</strong> Y. Bigno: “Optimum Gravel Sizing forEffective S<strong>and</strong> Control,” SPE 24801, presented at the 67th Annual Tech Conf. <strong>and</strong> Exhibition ofSPE, Washington D.C., Oct 4-7, 1992.56. Markestad, P. <strong>and</strong> 0. Christie: “Selection of Screen Slot Width to Prevent Plugging <strong>and</strong> S<strong>and</strong>Production,” SPE 31 087, presented at SPE Int’l Formation Damage Control, Lafayette, La,Feb 14-1 5, 1996.57. Jennings, A. R. Jr.: “Laboratory Studies of Fines Movement in Gravel Packs,” presented at theAnnual Tech Conf. <strong>and</strong> Exhibition of SPE, Denver, CO, Oct 6-9, 1996.58. Reijnen, P. H. F., Trampert, R. A., <strong>and</strong> Samuel, A. J.: “Plugging Potential of Gravel Carrier Fluids,Contaminated by Satellite Particles Originating from Gravels,” paper SPE 36952, presentedat the 1996 SPE European <strong>Petroleum</strong> Conference halo in Milan Italy, Oct. 22-24,1996.59. Coberly, C. J.: “Selection of Screen Openings for Unconsolidated S<strong>and</strong>s,” API Drill. & Prod.Practice (1 937)60. Saucier, R. J.: “Successful S<strong>and</strong> Control Design for High Rate <strong>Oil</strong> <strong>and</strong> Water Wells,” JPT,Vol. 21, 1193, 196914-37
61.Penberthy, W. L., <strong>and</strong> B. J. Cope: “Design <strong>and</strong> Productivity of Gravel-Packed Completions,”JPT, Vol. 32, 1976, 1980.62.63.64.65.66.67.68.69.70.71.72.73.74.Bouhroum, A., <strong>and</strong> F. Civan: “A Critical Review of Existing Gravei-Pack Design Criteria,”Paper 24, presented at 5th <strong>Petroleum</strong> Conference of the S. Saskatchewan Section, The <strong>Petroleum</strong>Soc. of CIM, Regina Oct. 18-20, 1993.Shucart, J. K., <strong>and</strong> A. F. Rust<strong>and</strong>aja: “Gravel Packing in High-Rate <strong>Oil</strong> Completions,”SPE 22978, presented at SPE Asia-Pacific Conference held in Perth, Western Australia, Nov. 7-14, 1991.Burton, R. C., W. M. MacKinlay, R. M. Hodge, <strong>and</strong> W. R. L<strong>and</strong>rum: “Evaluations CompletionDamage in High Rate, Gravel Packed Wells,” SPE 31 091, presented at SPE Int’l FormationDamage Control, Lafayette, LA, Feb 14-15, 1996.Beng-Swee Chuah, Hasumi, A. R., Samsudin, N., <strong>and</strong> Matzain, A.: “Formation Damage inGravel Packed <strong>and</strong> Non-Gravel Packed Completions: A Comprehensive Case Study,” PaperSPE 27360, presented at the Formation Damage Control Symposium in Lafayette, Louisiana,February 7-1 0,1994.Fletcher, P. A., Montgomery, C. T., Ramos, G. G., Guillory, R. J., <strong>and</strong> Francis, M. J.: “OptimizingHydraulic Fracture Length to Prevent Formation Failure in <strong>Oil</strong> <strong>and</strong> <strong>Gas</strong> Wells,” paperSPE 27899, presented at the SPE Western Regional Meeting held in Long Beach, CA.,March 23-25,1994.Wong, G. K., R. R. Fors, J. S. Casassa, R. H. Hite, <strong>and</strong> J. Shlyapobersky: “Design, Execution,<strong>and</strong> Evaluation of Frac <strong>and</strong> Pack (F&P) Treatments in Unconsolidated S<strong>and</strong> Formations in theGulf of Mexico,” SPE 26563, presented at the 68th Annual Tech Conf. <strong>and</strong> Exhibition of SPE,Houston, TX, Oct 3-6, 1993.Ayoub, J. A., R. D Barree, <strong>and</strong> W. C. Chu: “Evaluation of Frac <strong>and</strong> Pack Completions <strong>and</strong>Future Outlook,” SPE 381 84, presented at SPE European Formation Damage Conference, TheHague, Netherl<strong>and</strong>s, 2-3 June, 1997.Hannah, R. R., Park, E. I., Walsh, R. E., Porter, D. A., Black, J. W. <strong>and</strong> Waters, F.: “A FieldStudy of a Combination Fracturing/Gravel Packing Completion Technique on the Amberjack,Mississippi Canyon 109 Field,” paper SPE 26562, presented at the 68th Annual Technical Conference<strong>and</strong> Exhibition of the SPE held in Houston, TX., Oct. 3-6,1993.Hainey, B. W. <strong>and</strong> Troncoso, J. C.: “Frac-Pack: An Innovative Stimulation <strong>and</strong> S<strong>and</strong> ControlTechnique,” paper SPE 23777, presented at the Formation Damage Control help in Lafayette,Louisiana, February 26-27,1992.Powell, K. R., R. L. Hathcock, M. E. Mullen, W. D. Norman, <strong>and</strong> P. D. Baycroft: “ProductivityPerformance Comparisons of High Rate Water Pack <strong>and</strong> Frac-Pack Completion Techniques,”SPE 38592, presented at the 1997 Annual Tech Conf. <strong>and</strong> Exhibition of SPE, San Antonio, TX.,OCt 5-8, 1997.Muecke, T. W.: “Formation Fines <strong>and</strong> Factors Controlling Their Movement in Porous Media,”JPT, (Feb 1979), 144-150.Procyk, Alex, Pall Well Screens, Private Communication.Shyrock, S. G.: “Gravel-Packing Studies in a Full-Scale Deviated Model Wellbore,” JPT,(March 1983), pp 603-609.14-38
75. Leone, J. A., M. L. Mana, <strong>and</strong> J. B. Parmley: “Gravel-Sizing Criteria for S<strong>and</strong> Control <strong>and</strong> ProductivityOptimization,” SPE 20029, presented at the 60th California Regional Meeting of theSPE, Ventura, CA, April 4-6, 1990.76. Chan, A. F. <strong>and</strong> J. P. Parmley: “Gravel Sizing Criteria for S<strong>and</strong> Control <strong>and</strong> Productivity Optimization:Part II - Evaluation of the Long-Termed Stability,” SPE 23767, presented at SPE Int’lFormation Damage Control, Lafayette, La, Feb 26-27, 1992.14-39
Chapter 15: Workovers <strong>and</strong> FluidsWell ControlWell control is the primary objective of any workover operation. Control is established by proper use ofboth the equipment <strong>and</strong> the fluids required by the operation. Workover operations are undertaken formany reasons, such as reworking the completion entry point, completing a new reservoir, multiplecompletions, stimulations, or repairing mechanical or chemical problems. Each type of workoveraction requires basic fundamentals for well control.Well control during workovers <strong>and</strong> completions should be major concern since it ranked a close thirdto development drilling <strong>and</strong> not far behind exploratory drilling in a study by Skalle <strong>and</strong> Podio, of 1200wells over a 36 year time period.39The following activity data prior to blowout shows a variety of failure causes; virtually the entire spectrumof workover jobs.. Number of blowouts vs. operational phase In pmgress, 196&1995.NO. Of blowouts (60) vs. operationlactivityin progress during completion phase(TexaslOCS, 1960-1996)OperationBO ActivityInstalling equip. 41 WOCNipple down BOPRun csg./tbg.Set well plugsCementing casinginitial productionOtherMissing activity dataCirculation 17 KillingCasing runningCleaning well<strong>Gas</strong> liftinghnitiate prod.OtherMissing activity dataRunning well equip. 9Well testing 8Perforation 5Other 4Missing operation data 5Total 89BO175432243233333NO. of blowouts (60) vs. operationlactivityn progress during the workover phaseTexaslOCS, 1960-1996))perationBO Activity'ulling well equip. 67 Pull tubingPull/driil out plugsStuck pipePull WLCleaning wellPull pump rodPull casingPlugged pipeOtherMissing activity dataistalling equip. 25 Run tubingInstall BOPRun WLNipple down BOPOtherMissing activity dataLb<strong>and</strong>on well'erforationXrculationkmning equip.Vell testingkilling activityMerAissing operation databtal 22029 Pull tubingSet well plugsKillingPull casingOtherMissing activity data21171698919BC2E1c44il=4i574ii7511L4ci15-1
Control of a well is achieved by controlling the entry of fluid from the formation (a kick) <strong>and</strong> the loss offluid from the wellbore (fluid loss). Control of formation fluid entry is achieved by using a workover fluidthat exerts sufficient pressure to keep the formation fluids from entering the wellbore. The pressureexerted by a fluid is the product of its density <strong>and</strong> its vertical height above the pay. Prevention of lossof fluid from the wellbore is achieved by using only the minimum overbalance (pressure differential)toward the formation for necessary control <strong>and</strong> using fluid loss control products when required.The static weight of fluid is important, but there are considerations such as circulating backpressure inthe annulus that can cause the formation to feel more pressure than the wellbore fluid is exerting.When there are pressure losses during circulating, the pressure felt by the formation is called theequivalent circulating density or ECD.ECD, ppg = [ PAL/(0.052 x TVD ) ] + pmudPAL = annular pressure loss, psi7VD = true vertical depth, ftpmud = mud density, ppgExample 15.1Annular pressure loss is 125 psi in a 7000 ft well where a 9.5 ppg brine is being circulated at 6 bpm.What is the equivalent circulating density?ECD = [ 125/(0.052 X 7000 ) ] + 9.5 = 9.84 lb/galKicks are a rare but an almost unavoidable part of workovers. A kick is defined as an undesirableentry of formation fluids into the wellbore or tubing. The entry of formation fluid occurs simply becausethe formation pressure exceeded the pressure exerted by the workover fluid at the face of the formation.Kicks can occur even when the wellbore fluid is heavier than the formation pressure gradient ifthe application of the fluid pressure is disturbed even momentarily by the swabbing action of pulling abit, packer or other large diameter tool.The causes of kicks are varied but all have the same initiating factor-an inward pressure differential(however brief) that allows the formation to flow. Adams1’8 describes four major causes of kicks duringworkovers <strong>and</strong> gives descriptions.’ *2 The following four paragraphs are adapted from his work.Insufficient mud weight is a predominate cause of kicks. When a permeable formation is exposed to awellbore pressure less than the pore pressure, the formation will begin to flow. A common occurrenceof this phenomenon during workovers is in washing through s<strong>and</strong> bridges or in milling over packers.Pressure below the bridge or plug that may be much greater than the hydrostatic pressure of the workoverfluid. This problem may be particularity acute when a gas bubble has migrated up <strong>and</strong> is waitingunder the bridge. When the seal is broken, the gas <strong>and</strong> workover fluid may rapidly swap places as thegas rises.Improper hole fill-up during tripping of pipe is very common. As the tubing is pulled out of the well,workover fluid must be added to compensate for the volume loss of the steel pipe. When the pipe isremoved, the volume of fluid in the well is decreased <strong>and</strong> less vertical height of fluid is available forpressure maintenance. The problem is increased when a wet string is removed since not only thesteel but the mud within the tubing is removed as well. Any method may be used to fill the hole, but itmust be capable of providing a tally of the volume used to fill the hole. The two methods most commonlyused to monitor hole fillup are a trip tank or pump stroke measuring. A trip tank is any smalltank with a calibration device capable of monitoring the volume of mud entering the hole. Measuringthe strokes of a positive displacement pump is also an indication of volume.’15-2
Example 15.2How many pump strokes are needed to supply kill fluid to balance the removal of 10 st<strong>and</strong>s (93 ft perst<strong>and</strong>) of pipe with a displacement of 0.0032 bbl/ft?Pump Information:Example - single acting triplex, 3" liner, 6 in. strokepump output = 0.000243 x (3)* x 6pump output = 0.01 31 bbl/strokeSolution - 10 st<strong>and</strong>s tubing, displacement10 st<strong>and</strong>s x 93 ft/st<strong>and</strong> x 0.0032 bbl/ft = 2.976 bbl= 2.976 bb1/0.0131 bbktroke= 227 strokes per 10 st<strong>and</strong>sSwabbing is a routine operation when trying to achieve fluid entry into the formation. Like a pump, aseal assembly is moved upward in the hole, forcing the wellbore fluids above it <strong>and</strong> creating a brief,low pressure area below it. Accidental swabbing during tripping, however, has the same action but differentconsequences. Tripping with a drillstring or workover string can exert a large drawdown on theformation. Among the variables affecting swab pressures during tripping operations are: pipe pullingspeed, mud properties, hole/casing configuration <strong>and</strong> the effect of tools in the pipe string that increasethe effective diameter. Adams presents a few of the factors in a chart of pressure reduction vs. pullingspeed.' The mud weight is 14 Ib/gal <strong>and</strong> the pipe being pulled is 4-1/2" OD with a bit.Notice that the maximum pressure reduction (maximum swab) occurs for small clearances of tubingto-casingor hole <strong>and</strong> for rapid pipe pulling speed. It is also important to remember that the swab pressureis added to the pressure reduction resulting from not keeping the hole full as pipe is pulled.Swab pressure or surge pressure (the increase in equivalent kill fluid density produced by the pistoneffect while running pipe into the well can be calculated as illustrated in Example 15.3. The formulasare empirical equations collected <strong>and</strong> published by Lapeyro~se.~ His book of formulas is highly recommended.Example 15.3Calculate the surge <strong>and</strong> swab pressure effects for running <strong>and</strong> pulling a 4.5" 0.d. perforating gun(120 ft long) on 2-7/8" tubing (6.5 Ib/ft, 2.441" i.d.) through 7" casing (29 Ib/ft, 6.1 84" i.d.) at an averagetrip speed of 20 seconds per st<strong>and</strong> (a st<strong>and</strong> for this rig is two 30 ft joints). The fluid in the 8000 fthole is 9 ppg brine.Ave. pipe speed = [(60 ft/st<strong>and</strong>) / (20 sec/st<strong>and</strong>)] x 60 sec/min = 180 ft/rninfluid velocity = 10.45 +'*"6.1842 - 4S21 180 = 284 Wmin15-3
Vm, max pipe velocity = (284 x 1.5) = 426 Wsec(the fluid velocity <strong>and</strong> max pipe velocity formulas employ field derived constants: 0.45 <strong>and</strong> 1.5 respectively)The pressure change, P,, for each interval is:'P, =0.00077 x p;id x Q1s8 x P2 x L(Dh- Dt) 3 x (Dh+ Dt) 1.8where:pmud = mud density, ppgQ = equivalent flow rateV = plastic viscosity, cpsL = tool length, ftDh = hole diameter (or casing i.d. if cased), in.Dt = tool o.d., in.The equivalent flow rate, Q,Q=426 [6.184 - 4S2]= 31324.5P, =(0.00077)(9)O.*(313) 1-8(1)o*2(120)= 5 psi(6.184 - 4.5) (6.184 + 4.5)When running the gun in, an additional force of 5 psi is felt. When pulling the gun out, 5 psi less pressureis felt.The 5 psi pressure change is almost negligible. In terms of mud weight change, it would be5/0.052/8000 = 0.01 ppg.The effects of surge or swab pressures can be much more severe, however, when running speeds arehigh <strong>and</strong>/or clearances are small. Consider a 6 ft long packer with an effective 5.9" diameter in theprevious example, but ran or pulled at 360 Wmin (6 Wsec) average speed.fluid velocity, V = 0.45 + 5'92 1360 = 3814Wmin[ 6.1842 - 5.9215-4
Vm = 3814~ 1.5 = 5721Q=5721 (6.1842 - 5.g2)24.5= 801Ps 0.00077 (9) = Om8 (801) ( 1 ) o.2 (6)= 2223 psi(6.184-5.9)3(6.184+5.9)'a8The surge or swab force under these conditions is very high <strong>and</strong> would account for a:2223 psi/0.052/8000' = 5.3 lb/gal.difference in the mud weight. While running in, a force of 9 + 5.3 = 14.3 Ib/gal fluid density would befelt; possibly enough to fracture the formation. While pulling out, the 9 ppg kill fluid density would bereduced to 4.7 ppg; probably low enough to allow a kick.Running open end pipe requires a slight adjustment to the fluid velocity formula.V = 0.45(+Dh2- DP+ 012where Di is the inside diameter of the tubing <strong>and</strong> the 0.d. of the tubing is used for Dt. Vp is the averagepipe velocity in Wmin. Running open end small diameter tubing in a large diameter wellbore rarely createsa problem. In small diameter holes or through restrictions, however, pressure surges (or swabs)can be very high.Another factor that can sharply increase the pressure effects of swabbing or surging is load fluid viscosity.Higher viscosity fluids resist flow around tools or pipes <strong>and</strong> cause higher pressures.<strong>Gas</strong> contamination may be a source of kicks although the frequency is less than other causes. Evenwith a gas cut fluid, the density reduction is usually severe only at the surface where the total hydrostaticpressure is not usually significantly affected. <strong>Gas</strong> dispersion at higher pressures does notgreatly affect density since the gas does not occupy much space.When a kick is taken, there are several warning signs that may be evident. Most are concerned withthe net rate of fluid production or injection in a well, such as pit gain, well flowing with the pumps off<strong>and</strong> needing too little fluid to fill the hole during a trip. A change in the hook load weight indicator mayalso indicate that a less buoyant or more buoyant fluid than the workover fluid is entering the hole.Shut-InIf there is any doubt that a kick is being taken, shut it in <strong>and</strong> check the pressures. The shut-in pressuresare those pressures present at the surface on the work string <strong>and</strong> casing during a closed in condition.The bottomhole formation pressure is equal to the sum of the shut-in tubing pressure, SITP,<strong>and</strong> the hydrostatic pressure of the fluid in the tubing. The shut-in casing pressure, SICP, at the surfacemay also be used to calculate the bottomhole pressure, provided the annular mud hydrostaticpressure <strong>and</strong> the annular influx hydrostatic pressure are known--this is usually not the case.15-5
(Re)Gaining ControlRegaining control or killing a well after a kick requires reestablishing an outward pressure differentialat the face of the f~rmation.~,~ Several variables control the kill procedures available for workoveroperations. These include the fluid density needed for control (magnitude of the formation pressure/wellborepressure differential), casing burst strength <strong>and</strong> formation fracture pressure. Themethod of fluid placement is also important.There are two types of fluid circulation: down the tubing <strong>and</strong> up the annulus, or reverse circulating--down the annulus <strong>and</strong> up the tubing. This assumes, of course, that circulation is possible. Problemssuch as bridges in the tubing or annulus, plugged nozzles, stuck sleeves or ports, holes high in thetubing, float valve stuck closed in the tubing string, permanent packer or other problem may preventcirculation. When circulation is not possible under the conditions in the well, fluid may be lubricated orbullheaded into the well, or circulation may be restored by a repair or bypass operation.Lubrication of fluid into the well involves alternate stages of pumping fluid into a well <strong>and</strong> then allowingthe lighter weight fluid, usually gas, to escape while the heavier fluid falls to bottom. The process isrepeated until the tubing is full of kill fluid <strong>and</strong> it is produced through the choke. The cycle is thenrestarted with a heavier kill fluid <strong>and</strong> so on until the well is dead. The pressure <strong>and</strong> pump record of alubrication kill is shown in Figure 15.1 .3 The lubrication method is used on high pressure wells that donot have the extra wellhead pressure rating on the well pressure (bull heading would exceed surfacepressure limits). It is also used where the bull heading is not possible. The draw back is that it is timeconsuming..I4a21,000-SITP bled down before pump-in1 1 I I * I 1 1 IAn example problem for lubrication where the surface pressure is reduced sufficiently to allow bullheading is given in the example (from Adams) below.3Example 15.4Plan a lubrication kill.Solution:Wellhead pressure rating = 5,000 psiSITP = 4,800 psiTubing - 2-3/8", N-80, 4.7 Ib/ftPerfs = 13,795 ft15-6
1. Estimate the expected pressure reduction for each bbl of 9.0 Ib/gal brine pumped into the welltbg capacity = 0.003870 bbl/ft = 258.8 ftlbbl (121 psi/bbl). Press reduction = 258.8 Wbbl x(9 lb/ga1/42 gal/bbl) x 0.052 = 121 psi/bbl.2. Rig up all surface equip. including pumps <strong>and</strong> gas line flare.3. Open choke to allow gas to escape <strong>and</strong> temporarily reduce the SITP.4. Close choke. Pump in 9 Ib/gal brine until tubing pressure = 4800 psi.5. Wait for brine to fall in the tubing. This may take 1/4 to 1 hr depending on gas density, pressure<strong>and</strong> tubing size.6. Open choke <strong>and</strong> bleed gas until 9 Ib/gal brine begins to escape.7. Close choke <strong>and</strong> pump in 9 Ib/gal brine.8. Continue steps 4-7 until a low wellhead pressure is achieved.The shut-in time in Step 5 is for the gas to migrate upward at about 17 to 35 ft per min (gas migrationis a function of liquid density <strong>and</strong> viscosity). The necessary shut-in time is determined by how soon thegas cap over the brine is exhausted during the bleed off step. In deep wells, gas migration time isquite long.Operators cannot always solve critical well control problems with conventional circulation. Often, thetubing will be parted or plugged <strong>and</strong> unconventional techniques are needed. The technique of bullheading is one in which the fluid in the well is pumped down the well ahead of a full column of fluid <strong>and</strong>the entire contents of the well is forced under pressure into a formation. The formation that takes thefluid will almost always be the weakest opened (fractured) formation. Normal bull heading is accomplishedeither below the fracturing pressure for routine operations (with clean fluid <strong>and</strong> sufficient permeability)or above the fracture pressure for operations in which well control must be quicklyreestablished.Using bull heading operations is useful under several well control conditions. Among these are:1. The material in the well contains more H2S than can be h<strong>and</strong>led with surface facilities.2. Plugged or parted drill pipe cannot be used to circulate the mud to the bottom of the well.3. Excessive surface pressure would be created (usually on a gas well).4. Bull heading may be used to gain time when materials or other equipment are in short supply.Bull heading has several crucial disadvantages <strong>and</strong> should be used only when necessary. Some of theproblems which make bull heading difficult in well completion operation 81-8:~1. Crews do not fully underst<strong>and</strong> the technique.2. Fluid will go to the weakest interval <strong>and</strong> may not followed the preferred path. This might includea shallow formation breaking down <strong>and</strong> accepting fluid without being able to remove gas-cut fluidin the deeper part of the well.15-7
3.Potential is created for an underground blowout or surface eruption if the pressure is raisedabove the formation fracturing pressure.4.Even a successful bullhead may not kill the well if the entire wellbore cannot be displaced <strong>and</strong>replaced with the correct kill fluid.A normal workover operation may use several bull head kills <strong>and</strong> pills may be bull headed down thewell to serve as fluid loss agents. Bull heading may also be used in combination with circulation onvarious special operations.Bull heading in drilling is considerably different than in the workover because during drilling, the formationis usually exposed to a mud that contains solids <strong>and</strong> will develop wall building on fluid leakoff.When bull heading with mud, fracturing is often the only resort, whereas in workovers, injection belowthe fracturing pressure is possible.Alternatives to bull heading include restoration of circulation by either cleaning out the plugged workstring or perforating at a point above the damage. Although both systems will work if circulation can berestored at a sufficient depth, there is not always time to get a complete cleanout of the plug or bypassbefore the well could give problems.When bull heading, a rate of pumping faster than the gas migration rate up the tubulars is required toestablish well control. There are no wide-range estimates of bubble rise velocity in conventional fluids;however, estimates of approximately 1 ft per second bubble rise in clear low density fluids <strong>and</strong> severalft per minute in viscous muds or fluids are often stated. The tubing <strong>and</strong> casing size also affects thebubble rise rate.Adams gives guidelines for bull heading that emphasize ~afety.~1. If pump-in pressures approach the rig pump limit, use a cementing unit or other high-pressurepump for better control.2. Large kill fluid reserves should be available. Bull heading may create lost returns, especially ifbull heading is above the parting pressure.3. Select safe tie-in points at the BOP above the rams.4. Install check valves in the pump-in lines so that lines can be repaired.One of the key rules in bull heading is to remain patient for the heavier fluid to fall in the well afterpump in. This may take several minutes to over half an hour.When a well cannot be circulated because of a deep obstruction or permanent packer problem, a holecan be punched in the tubing with a tubing puncher perforating device. These devices can create ahole@) in the tubing without damaging the casing. In this situation, reverse circulating is normal. Thisoperation requires that the fluid in the annulus be in condition to circulate. Orienting the perforatingdevice is necessary in a multiple completion to avoid damaging the other tubing strings. Other toolsare available that will completely cut off the tubing.In some cases, a concentric workover approach is useful. These techniques are coiled tubing or smalldiameter tubes. They are limited in pump rate by high internal friction but are rigid enough to breakthrough some bridges. A drill bit with a downhole mud motor may be added to either. Care must beexercised in the case of coiled tubing with high weight brines in a gas well. Without the buoyancy of anoutside fluid, the tensile load of a coiled tubing loaded with a heavy brine may exceed the tensilestrength of the material near the wellhead.15-8
Pulling the tubing out of a permanent packer to achieve circulation is a common operation but mayintroduce a risk on a high pressure or sour gas well since it requires a partial tear down of the tree topick up the tubing. Once the tree is opened, a major control point is lost.Washing Debris from WellboresRemoval of debris from a wellbore, whether that debris is drill cuttings, s<strong>and</strong>, metal mill cuttings orother material, can be accomplished by normal circulation (flow down the tubing <strong>and</strong> up the annulus)or by reverse circulation (flow down the annulus <strong>and</strong> up the tubing). The primary factor affecting successof cleanouts is selection of the fluid <strong>and</strong> the pump rate to clean the wellbore. The requirementsfor a cleanout fluid system are determined by several independent <strong>and</strong> related factors in the workover.These include the type <strong>and</strong> density of the particles being removed, the wellbore pressure, the frictionpressure, the various operational considerations for h<strong>and</strong>ling fluids (including disposal) <strong>and</strong> the relationshipbetween the density of the particle <strong>and</strong> the flow velocity. Bottomhole pressure is one of themost important considerations. In most cases, the bottomhole circulating pressure should be close tothe well's bottom hole pressure. This assumes that the well can be controlled during solids removalwithout fracturing the formation by excess pressure.Lifting of solids is influenced by the effective viscosity, the flow rate <strong>and</strong> the shape, size <strong>and</strong> density ofthe material being removed. The debris will have a certain settling rate in the circulating fluid. Toremove the solids, the flow rate must be sufficient for the vertical upward velocity to be more than thesettling rate of the largest pieces of debris in the circulating fluid. For normal circulation, this is representedby:'where:PSR = particle settling ratioVf = upward velocity of fluid in the annulus, Wmin.Vps = downward velocity of particle (settling rate), Wmin.When PSB1, the particle rises in the wellbore <strong>and</strong> when less than one, it settles. PSR=l is the staticcase. PSR must be greater than 1 to clean the wellbore. As PSR increases, the cleaning proceedsmuch faster <strong>and</strong> requires less circulation time for cleanout.To select a PSR of greater than one (you are really selecting a Vfgreater than Vps), you must have anidea of the settling rate of the particle in the fluid. The most common debris encountered in cleanoutsare s<strong>and</strong>, formation fragments <strong>and</strong> steel cuttings. The size <strong>and</strong> shape of the debris is at the heart ofthe lift consideration2 Small steel turnings of 0.06" wide (1.5 mm), 0.01" thick (0.25 mm) <strong>and</strong> 1" long(25.4 mm) have a settling rate of about 40 Wmin. in water, whereas steel chips about 0.25" wide(6.4 mm), 0.25" thick (6.4 mm) <strong>and</strong> 1" long (25.4 mm) have a settling rate of about 250 Wmin. Withthis wide of a variance in settling rate, you could see some steel cutting circulated out at the surfacewhile building up a large mass of the larger particles around the mill. In effect, the mill runs on the cuttings<strong>and</strong> penetration rate drops to near zero. Although the commonly encountered s<strong>and</strong> sizes arecloser in size comparison than steel cuttings, typical frac s<strong>and</strong> is -20+40 mesh (0.033 in. or 0.84 mmto 0.017 in. or 0.42 mm), s<strong>and</strong> can clump into small "wads" <strong>and</strong> sink faster than individual particles.15-9
Formation chips offer a very wide range from micron size fines to bolders the size of the wellbore. Thefollowing data is a general range of settling velocities.Debris Settling Rate in WaterI Steel Chips 1 0.25'' square- long 76.2 IFor complete hole cleaning, you must remove all the debris. When a PSR value is selected, the Vfcomponent is plugged into the following equation to get pump rate Q in bpm. The do value is the i.d. ofthe outer pipe (the outer casing or the open hole) <strong>and</strong> the djis the 0.d. of the inner pipe (the tubing ordrill pipe). Since Vfis the minimum velocity necessary for lift, the pump rate Q necessary to produce Vfshould be calculated in the largest annular configuration in the circulation wellpath (largest casing i.d.<strong>and</strong> corresponding tubing or drill pipe 0.d.Debris removal is complicated by changes in the annular cross sectional area. If the cuttings slowdown in an area, they can bridge the pipe. This is especially true with metal cuttings that "nest" orintertwine .2-5Example: Find the flow rate necessary to wash -20+40 mesh frac s<strong>and</strong> from 6500 ft in 7" (29 Ib/ft) casingwith 2-3/8" (4.7 Ib/ft) tubing in normal circulation. The circulation fluid will be water.For the particles to be lifted, PSbl, <strong>and</strong> VpVp355 ft/min.Q-(55 ft/min) (6.1842 - 1.9952) = 18.4 BPM102.6A quick check of the friction pressure of water in 2-3/8" tubing, Figure 15.1 a, shows the friction pressureto be 400 psi/lOO ft of tubing length. This would result in a total friction loss of 65 x 400 =26,000 psi; a pressure above the pipe maximum. In short, to remove debris from large annular areas,a fluid is needed in which the particles have a slow settling rate.Washing out s<strong>and</strong> or lifting cuttings from a milling workover requires a fluid that will lift all cuttings tothe surface. This requires a fluid with a high yield point or effective viscosity. The shear rates of variousflow conditions are as follows:Shear inside drillstring = 275 to 450 sec-'Annular shear = 12 to 90 sec-'Shear at the mill = 200 to 1200 sec-'15-10
FRICTION PRESSURE VS FLOW RATETUBULARCONOUCTORS1 FRICTION PRESSURE VS FLOW RATE I(From Halliburton's Frac Book)Figure 15.la: Friction pressure charts for 1 cp Newtonian fluid in tubulars (left) <strong>and</strong> inannular flow areas.In normal circulation, once the mill face is passed in fluid flow, the shear rate drops to very small values;<strong>and</strong> at common flow rates, the fluids must support the cuttings.Regardless of what type of tubing that is in the well or the type of system that is being used to removesolids from the wellbore, the returned fluids should be monitored at the shale shaker or return tank tosee that suspended solids are moving up the wellbore. If the solids are not moving, the viscosity of thefluid or the flow rate should be increased to assist in the lift of these particles.In the worst case of milling operations in which steel particles are to be lifted from the wellbore, themost effective fluid appears to be a mud with a very high yield point. Experience in several areas hasshown that a yield point of 100 or more is necessary to achieve removal of the cuttings. If the cuttingsin a milling operation are not removed, the mill will turn <strong>and</strong> grind on the cuttings <strong>and</strong> penetration willbe effectively stopped.Pressure EffectsHigh- <strong>and</strong> low-pressure wells both create special problems for solids removal from a well. In the caseof high reservoir pressure wells, a heavy fluid will be needed to maintain well control by increasingfluid density across the pay zone. For other than clear brines, an increase in fluid density often bringsa friction pressure increase which can reduce circulating rate. In low reservoir pressure wells, supportinga full column of fluid is often difficult. In these cases, foamed fluids with hydrostatic heads of 2-6Ib/gal are often satisfactory alternatives. Besides having a low fluid density, the foams have excellentlift capacity when compared to gelled waters. In the case of wells with low fracture gradients, caremust be taken to prevent holding large backpressures on the well while circulating. Backpressureeffects are added to the weight of the fluid in the well to determine the effective hydrostatic head at theformation phase. Large hydrostatic heads should usually be avoided from a fracturing danger st<strong>and</strong>-15-1 1
point <strong>and</strong> also from erosional considerations in the area near the end of the wash pipe or tubing.Chokes have been suggested as a method of control to avoid downhole backpressures; however,chokes must be rigged with solids control capacity to prevent abrasion of the choke by solids.Kill ProceduresSeveral types of shut-in procedures are useful in well completion operations. The type of kill procedurewill depend upon the type of rig. Adams lists the shut-in procedure variations according to type ofrig <strong>and</strong> operation encountered:’92i5 For further information, the reader is referred to Adams’ literature.1. Drilling or workover - immobile rig2. Tripping - immobile rig3. Drilling or workover - floating rig4. Tripping - floating rigAn immobile rig does not move in relation to the work string during operations.’ Shut-in procedures forworkovers are:1. After sign of kick, raise the kelly above rotary.2. Stop mud pumps.3. Close annular preventer.4. Read <strong>and</strong> record SITP, SICP, <strong>and</strong> pit gain.Kicks during a tripping operation are frequently missed in the early stages because the crew is occupiedwith tubing h<strong>and</strong>ling.1. Set the top tool joint above the slips when the kick is detected.2. Install <strong>and</strong> makeup a full opening, fully opened safety valve in the work string.3. Close the safety valve <strong>and</strong> blow out preventer.4. Pickup <strong>and</strong> makeup the kelly.5. Open the safety valve.6. Read <strong>and</strong> record the SITP, SlCP <strong>and</strong> pit gain.The use of the full opening valve permits entry of logging or perforating equipment.Operations from a floater must take into account the problems of pipe movement, even when the vesselis equipped with a motion compensator. A problem common to the floaters is that the operatormust space out the string so that a tool joint does not interfere with the closing of the preventer elements.This is complicated when the BOP is located on the sea floor. To achieve a solution, the ramsshould be closed, then the string slowly lowered until a tool joint contacts the rams. The position of thekelly can then be marked (Adams).15-12
1. When a kick is detected, raise the kelly to the position of the previous space out test (tool jointabove the rams).2. Stop the mud pumps.3. Close the annular preventer.4. Close the upper set of pipe rams.5. Reduce the hydraulic pressure of the annular preventer.6. Lower the pipe until it is entirely supported by the rams.7. Read <strong>and</strong> record SITP, SlCP <strong>and</strong> pit gain.By hanging the string off of the close pipe rams, the wear on the preventers caused by vessel motionis minimized.Shut-in procedures during tripping on a floater combine some of the previous techniques.1. When a kick is observed, set the top tool joint on the slips.2. Install <strong>and</strong> makeup a full opening, fully opened safety valve in the work string.3. Close the safety valve <strong>and</strong> the annular preventer.4. Pickup <strong>and</strong> make up the kelly.5. Open the safety valve.6. Read <strong>and</strong> record SITP, SlCP <strong>and</strong> pit gain.After the shut-in pressures are measured, the kill fluid weight must be calculated. Normally, the shut-intubing pressure is used since it is less affected by encroaching fluids. The following equations may beused to estimate the fluid weight:(S/TP+ Pht)MKw = 0.052 x Depth- BHP0.052 Depthwhere:Adkw = fluid weight necessary to kill the well, Ib/galSlTP = surface shut-in tubing pressure, psiPht = hydrostatic tubing pressure, psi = density x depthBHP = bottomhole pressureThe Pht term is not useful when the tubing is filled with different density fluids.15-13
CirculatingWhen the string is near the bottom of the well, circulating the kick out of the well is the most commonkill. The rig pumps are normally used <strong>and</strong> an adjustable surface choke is used to hold a backpressure.The back pressure is especially useful as gas nears the surface to prevent rapid gas expansion <strong>and</strong>sudden fluid density decrease. Conventional or reverse circulation may be used depending on downholeequipment. Reverse circulation is usually not used when nozzles on a bit or in a wash tool mightbecome plugged by cuttings picked up in the well.Circulation will cause both the tubing pressure <strong>and</strong> the annulus pressure to change. The tubing pressurewill rise steadily then fall as a kill is achieved, Figure 15.2. The casing pressure will fluctuate,especially as the kick gas nears the surface (in normal circulation).BARRELS F'UYPEDFigure 15.2: A pressure record of a circulation kill of a kick.Kicks that occur when a string is not on bottom require bull heading, lubricating, concentric tubingwork, or snubbing (also called stripping-in). Snubbing is a operation that inserts the tubing into thewell while maintaining a seal with special equipmenLG8SnubbingSnubbing units provide a convenient method for running pipe in <strong>and</strong> out of wells under pressure. Asnubbing units uses unidirectional slips that force pipe into or retrieves it from a well that is underpressure. The force applied to the slips to run the tubing into or out of the well may be from hydrauliccylinders or from wireline assistance from the rig. The ease with which the pipe is forced into the wellis dependent upon whether the pipe weight exceeds the mathematical product of the closed-end pipearea times the wellhead pressure.In the early part of the snubbing operation, the snubbing unit is forcing the pipe into the hole againstthe pressure. When the weight of the pipe offsets the pressure effect, the breakover point has beenreached, <strong>and</strong> the operation changes from snubbing (pushing into the well against pressure) to stripping(holding back on the pipe <strong>and</strong> maintaining the seal. The breakover point can be easily calculated.Example 15.5Determine the force created on closed end, 3-1/2", (10.2 Ib/ft, 2.922" i.d.) tubing, in a hole filled with10 ppg brine <strong>and</strong> a surface pressure of 1500 psi.15-14
Force = (3.5)2 (0.7854) (1500) = 14,432 IbThe breakover point will be reached (if pressure remains constant) when:has been run into the hole.14' 432 lb = 1415 ft of 3-1/2"pipe10.2 lb/ftSnubbing units offer advantages since they can operate efficiently at high pressures <strong>and</strong> allow thepipe rotation. The units may be rig assisted, using the drawworks to provide power or may be hydraulicallyoperated units that are st<strong>and</strong> alone equipment. Capacities of the snubbing units range from 1"to over 5-1/2" pipe. Various weight capacities are available. A chart on a few of the units is provided inFigure 15.3. Regardless of the system employed to place the pipe into the well, pressure in the wellborewill increase since volume is being added. Proper pressure maintenance (bleeding off pressureas pipe is run in) must be used to prevent either fracturing of the formation or entry of additional fluidinto the wellbore as pipe is withdrawn (add fluid). The two processes most often used are the volumetricmethod <strong>and</strong> the pressure method.- 11111Ton8amControlU d l1 Double8have: Lingblock <strong>and</strong>hookter balance\ weightsequAliring1WPtripper Stati-rYrubber 'lip'Vent lineAbove left: hydraulic snubbing unitAbhbooa right: nachanical, rig aalist anubbing unit5elw: BOP sshsmatic for a snubbing unit(From Franklin <strong>and</strong> Abel, World<strong>Oil</strong>, Jan. 1989)Figure 15.3: Equipment usedin snubbing <strong>and</strong>stripping.L4gg.t. et al.SPE 22824)As the pipe goes into the well, the pressures will rise due to compression of the fluids. If the pressurerise is uncontrolled, the formation will fracture. To reduce the pressure, a volume of fluid equal to thevolume of pipe force into the well is bled off. The total displacement of the closed-end string is used inthe calculations since a backpressure valve is placed in the string at the first joint snubbed in. Operationof the choke is of critical importance to prevent too much surface pressure.815-15
The pressure method uses the surface pressure to balance the bottomhole formation pressure <strong>and</strong>prevent further entry of fluids. The surface pressure used is the dynamic pressure rather than thestatic pressure from the BOPs, <strong>and</strong> the process can be used on snubbing in <strong>and</strong> out, while the volumetricmethod is useful only in running in. The pressure method provides more accurate volume control.CompletionMlorkover FluidsRegardless of the intention of the workover or completion, the fluids used must satisfy at least twoconsiderations:’ 0-131. Control the well.2. Protect the formation against permanent permeability damage.Figure 15.4 shows the densities <strong>and</strong> safety information on the most common workover <strong>and</strong> kill fluids.FluidDensity RangeDensity RangeFigure 15.4:Common workover fluid propertiesThe correlation between API gravity <strong>and</strong> specific gravity is:Normally, the least expensive fluid that satisfies the two major conditions <strong>and</strong> can still be used in thelocation is selected for use. The fluid selected for use must be considered as just a base fluid-chemical<strong>and</strong> physical operations are usually required to make an acceptable, fluid for long term use.Produced waters, fresh waters, <strong>and</strong> surface brine waters (brackish) all have to be treated. Each hasits own individual problems. Produced waters have oil carryover, scale potential, suspended solids,15-16
<strong>and</strong> corrosion products. Fresh water has oxygen or other gases, solids, <strong>and</strong> bacterial problems, plus itmay need to be treated to prevent clay swelling in sensitive s<strong>and</strong>stones. Brackish water or sea watercontains several forms of detrimental bacteria, gases <strong>and</strong> may form sulfate scales when mixed withformation waters with a high calcium or barium content.Hydrocarbons liquids for workover fluids may be produced oil or refined product depending on theneed <strong>and</strong> the economics. Produced oil is the most common, but can actually be damaging if allowedto weather or if the oil forms emulsions with water from other zones. Refined products such as diesel,kerosene, xylene, etc., are alternatives for special applications. Even refined products, in the instanceof diesel, can be damaging, however, because of the large amount of filterable solids (usually waxes)that may cause plugging damage.Although gases are usually not considered workover fluids, gas-in-water emulsions, or foams, arevery useful for pressure control in low pressure Stable foams with densities of 1 to 5 Ib/gal areachievable. Since one of the criteria for a well completion fluid is that it control the well, the density ofthe fluid must be high enough to exert an outward differential pressure with the depth of the fluid to beused. If the pay is a multiple completion, all the exposed pays must be controlled at once. Obviously,this means controlling the highest pressure without breaking down the easiest fractured zone.A variety of soluble salts may be added to water to bring the density to values in excess of 16 Ib/gal.The type of salt that is used will depend on the sensitivities of the formation (if any) or scaling tendenciesof any combination of the salt laden workover fluid <strong>and</strong> the formation water, <strong>and</strong> it will alsodepend on what weight of brine is needed. Low weight brines, below 10 Ib/gal, may be attained bypotassium chloride or ammonium chloride, both of which are relatively expensive or by sodium chloride,which is often available as produced field salt water. Moderate weight brines of 10 to 14.5 Ib/galare calcium chloride (to 12 Ib/gal), calcium bromide, or mixtures of the two. Heavy weight brinesencompass calcium bromide/zinc bromide <strong>and</strong> zinc bromide brine~.l~-~l The obvious drawbacks toheavier weight brines are cost <strong>and</strong> environmental concerns. Also, an increase in brine weight usuallyincreases corrosion. The less obvious problem is one of temperature stability <strong>and</strong> dilution. Addition ofsome salts, especially in low concentration, often causes a freezing point depression, which is usefulin cold operation areas. Further addition of salt however, especially near the saturation point, producesa solution with an apparent higher “freezing point.” Actually, the salt saturation point decreaseswith decreasing temperature but salt precipitate may plug lines, valves tubing as temperature isreduced <strong>and</strong> salt solubility is lost. Temperature stability diagrams, Figures 15.5, are available for allthe common heavy clear workover brines <strong>and</strong> the storage <strong>and</strong> use operations should remain in thesolubility envelope. Remember the special case of offshore completions that the minimum temperaturemay be reached at the seafloor. At the higher densities, the actual density of the fluids maychange by a few tenths of a lb/gal due to thermal expansion as they are pumped into a hot well.Density Correction - Temperature OnlyDcDcDmTmVeTc= Dm [l + Ve (Tm- TA]= Corrected density (density at 60°F (16OC)= Measured density= Temperature at which Dm is measured= Volume expansion factor= St<strong>and</strong>ard formulation temperatureVe x 10+~3.494.062.80Density (PPa9.0 NaCl9.5 NaCl12.0 NaBrBrine15-17
706050II. 4030DYE 20P2 10e2 0s4 -103 -20x& -30-408 9 10 11 12 13 I& 15 16 17 18 19(Bleakley, PEI, Aug. 1980)Figure 15.5: Crystallization points of some clear brines showingerratic behavior at different compositions. The anomalyin the crystallization temperature of CaC12/ZnBr2/-CaBr2. Brines formulated in different ways will havedifferent crystallization behavior.Example 15.6(from Osca Brine Technical Manual)15-18
~What is the density at 60°F (1 6°C) of a fluid with a 16.4 ppg density at 85°F (29"C)?Dc= (16.4) [I + 0.000252 (85 - 60)]Dc= 16.5 ppgExample 15.7What is the density at 275°F (135°C) of a brine with a surface density of 14.0 ppg at 60°F (16"C)?14.0Dm= D, [i + 0.000253 (275 - SO)]= 13.3ppgBrine TypeTable 15.1Upper DensityLimitSaturationCrystal.Temp.The volume corrections in Table 15.2 help convert density to other commonly used factors.To Convert From To Multiply BykilogramSA pounds per gallon 8.33pounds per gallon (US) grams per liter 120pounds per gallon (US) kilograms per liter 0.12pounds per gallon (US) kilograms per cubic meter 120pounds per gallon (US) pounds per cubic foot 7.48All aqueous brines can be diluted by water from any source, <strong>and</strong> the issue of dilution is one without asolution. The best treatment of the fluid involves adequate pressure controls to minimize mixing (<strong>and</strong>weight reduction) by formation fluids. The heavier brines should also be stored in covered tanks tominimize fresh water addition by rain or absorption. Changing brine density by adding salt must bedone carefully to end up with the required weight <strong>and</strong> to avoid salt precipitation. Different techniquesare used for single salt fluids (e.g., NaCl or CaCI,) <strong>and</strong> two salt fluids.15-19
~ ~~Example 15.8Density increase in a single salt fluid.A tank has 200 bbl of a 10.5 Ib/gal CaCI2 brine. The required density is 11 .O Ib/gal. Determine theamount of CaCI2 to add <strong>and</strong> the final volume of the brine.VjDjDfW,SjSf= 200 bbls= 10.5 Ib/gal= 11 .O Ib/gal= 0.906 bbl water (from Table 15.3)= 0.880 bbl water (from Table 15.3)= 123.9 Ibs per barrel (from Table 15.3)= 155.2 Ibs per barrel (from Table 15.3)Salt addition (lb) = Vi[( w) WiSf - Si]= 7177 lbs of CaC12 ( added)Final volume = = 206 Ibs of 11 .O Ib/gal brineTable 15.3: Calcium Chloride (94%-97% purity) Data for Brines1 Density,7O0F I For One Barrel BrineL---PP9Pounds Dry CaCI2Barrels Fresh Water8.5f.6 0.9969.0 34.90.9779.5 63.80.95610.0 93.60.93210.5 123.90.90611 .o 155.20.88011.5 186.30.847Example 15.9Density increase in a two salt brine.A tank has 400 bbl of 12.5 Ib/gal CaBr2/CaC12 brine. The brine density must be raised to 14 Ib/gal.Determine how much of each salt should be added <strong>and</strong> the final volume of the brine after densityadjustment.Vj=400 bbl15-20
DiDf= 12.5 Ib/gal= 14.0 Ib/galSil = initial wt of CaBr, (from Table 15.4) = 71.1 IbSE = initial wt of CaCI2 (from Table 15.4) = 179.9 IbS, = final wt of CaBr2 (from Table 15.4) = 189.6 lbSh = final wt of CaCI2 (from Table 15.4) = 149.3 lbWj = initial water volume (from Table 15.4) = 0.784 bblWf = initial water volume (from Table 15.4) = 0.712 bblW, = added water volumenUudd water requirementwa= vi [--s;awfwiWa = 400[ (179'9) (OS7l2) -0.7841 = 29.6 bb/( 149.3)Quantity of CaBr2 added$--- s, = Si2SfIsf2s,]Final volumeVf = 400[=] 149.3 = 482 bblTable 15.4: 95% CaBr,, 94% CaCI,, <strong>and</strong> Water Data for BrineDensity, 70°FPP911./12.012.5For One Barrel BrinePounds 95%, Pounds 94% Barrels(dry) (dry) CaCI, Waterf .91 196.1 6 0.82231.60 190.05 0.80771.08 179.86 0.78415-21
Table 15.4: 95% CaBr,, 94% CaCI,, <strong>and</strong> Water Data for BrineThe addition of large amounts of calcium bromide required extra fresh water to avoid precipitating thecalcium chloride. The addition of both the fresh water <strong>and</strong> the calcium bromide increased the total volumeof the brine.When brines are mixed (no dry salt addition), a straight ratio of densities can be used.Example 15.10Decreasing density of brine.Decrease the density of 9.9 Ib/gal sodium chloride brine to 9.4 Ib/gal by adding fresh water(8.33 Ib/gal). The initial brine volume is 150 bbls.0; = 9.9 Ib/galDf = 9.4 Ib/galDa = 8.33 Ib/galVj = 150 bblsVolume of 8.33 Ib/gal water to be addedWhen density is increased by adding a heavier brine, the formula becomes:Once the base fluid <strong>and</strong> the weighting agent have been selected, an additive package is needed tocondition the fluid to the individual needs of the well. The following list of additives is by no meanscomplete, but it does include the more important additives <strong>and</strong> the basic reasons for their use. Selec-15-22
tion of additives should be on an as needed basis-do not add anything that isn’t absolutelyAdditives may counteract each other <strong>and</strong> each one drives up the price of the fluid.needed.MaterialViSCoSitierSSurfactantsBridging AgentspH controlInhibitorsBactericidesUseHuid loss control, gas migration, suspending aidLoad fluid recovery aid, now emulsifiersFluid loss controlClay damage control, corrosion controlScale <strong>and</strong> corrosion controlControl bacteria countsBecause of the cost of workover fluids many are cleaned <strong>and</strong> recycled. This reclamation is particularlycommon on the more expensive bromide brines.When the required fluid density exceeds the upper limit of the density of the clear brines or when theclear brines cannot be used because of environmental concerns or cost (cost of some of the zincbrines may exceed several hundred dollars per barrel), solid weighting additives are suspended in theworkover fluid. The materials, usually carbonates, can add significant weight to a fluid.1 Material I Specific Gravity-CO3FeC03BaC03Fe2C03Weight Increase Over Base FluidIb/gal (from Patton)222. 3.53.85 6.54.43 8.05.24 10.0The biggest problems with the addition of the solids is (1) the difficulty in keeping the particles suspended,<strong>and</strong> (2) the possibility of formation permeability damage from a solids laden fluid. Both problemsare serious but neither is insurmountable-just difficult. Addition of viscosifiers help suspend thesolids <strong>and</strong> permeability damage may be minimized by using a size graded material. Proportions offine, medium, <strong>and</strong> coarse granules have been shown to control fluid loss more rapidly than a singlesize granule dispersion.Viscosifiers are usually polymers <strong>and</strong> less commonly clay or other minerals that increase the viscosityof the water. The increase in viscosity slows the rate of fluid leakoff into the matrix of the formation <strong>and</strong>improves the ability of the fluid to hold particles in suspension. Polymers are compounds with repeatingmolecular units. Examples are guar, cellulose <strong>and</strong> various other synthetic <strong>and</strong> modified natural orcreated base products. Concentration of the polymers in workover fluid ranges from 0.25 to over5 lb/bbl. The polymer provide a useful service but most break down in time or are attacked by bacteria.Surfactants are one of the largest families of workover <strong>and</strong> stimulation related chemicals. A surfactantis a compound of water soluble group <strong>and</strong> an oil soluble group. Because of their unique structure, theycongregate at <strong>and</strong> modify the surface of liquid <strong>and</strong> gas (surface tension), immiscible liquids (interfacialtension), <strong>and</strong> liquid <strong>and</strong> solid (contact angle). The tension values of liquids are the result of the moleculesof that fluid exerting a mutual attraction for each other. The greater the attraction, the greater thesurface tension <strong>and</strong> the greater the work required to rupture the surface.MaterialWaterNormal Surface Tension/2 dyneskm15-23
Mercury487 dynes/cmSurfactants have the ability to reduce the tensions by adsorbing at the interface. The modified interfacethen has a different character as the surfactant molecules orient themselves for the lowestenergy environment. Surface tension reductions of over 50% are possible for many systems.Surfactants may be of hundreds of different chemical formulas but are usually divided into just fourtypes; sorted by electric charge.Anionic- the water soluble end has a negative charge.Cationic- the water soluble end has a positive charge.Nonionic- the water soluble end has no charge.Amphoteric- the charge on the water soluble end depends upon the pH or other factor.The surfactants, regardless of charge, may reduce the surface tension, interfacial tension, or contactangle. The difference is that some surfactants are attracted to <strong>and</strong> readily adsorb on certain surfaces--a trait that is used to advantage for well designed products <strong>and</strong> poses problems for indiscriminatelyused surfactants. Additionally, not all surfactants are intended to reduce surface tension, some, suchas corrosion inhibitors, are intended to plate out. In general, with surface tension reducing products,avoid the use of cationic surfactants in s<strong>and</strong>stones <strong>and</strong> anionic surfactants in limestones. In the specialcase of fluids that will undergo large losses to the formation, it has been shown that even nonionicsabsorb to some extent. Other systems such as alcohols may need to be considered. The reasonsurfactants absorb to certain surfaces is governed mostly by charge attraction. In this aspect, the wettabilityof the formation plays an important role. Wettability is a descriptive term, but not highly exact,of whether a solid surface is coated by or is receptive to oil or to water. The electric charge attractionor repulsion may be one factor in wetting of a formation since silica surfaces are usually slightly negative<strong>and</strong> carbonates have slightly positive charges in the most common naturally occurring pH range.If the surfactant is attracted to the rock by an opposite charge, the water soluble end is next to the surface<strong>and</strong> the oil soluble end is next to the fluid-leaving the “surface” oil wet. When strong attraction isnot evident, the surface may be water wet or indeterminate.Although this explanation is reasonably sound, enough variations are known so that it is not held to beexact. The wettability is very important, however. Its effect on the relative permeability of a fluid flowingthrough a rock can be very significant as permeability to oil may be cut in half by introduction <strong>and</strong>binding of a water phase where none existed before. In spite of this data, as long as the water saturationis low, the preferential condition for oil flow is a water wet pore wall. This occurs because thewater layer occupies less of the pore throat area than an oil layer (molecular thickness).Emulsion breakers or de-emulsifiers are chemicals that help reduce the film strength on the dispersedor noncontinuous phase droplets <strong>and</strong> aid in the coalescence <strong>and</strong> coagulation of the small drops intolarger drops that will settle more easily. These chemicals are emulsion specific; they work best on aparticular emulsion <strong>and</strong> do not work at all on some emulsions. Because of their specific nature, theymust be suited for the exact emulsion problem in the well; a difficult job if the emulsion properties arenot known in advance.Emulsion preventers or nonemulsifiers prevent the formation of emulsions. Again, they must beselected based on the character of the water, oil, <strong>and</strong> solids encountered in the well. The need to runcompatibility tests on samples of well fluid that are as near as possible to the character of downholesamples cannot be overstated. Samples change character with changes in temperature, pressure,atmosphere <strong>and</strong> time.15-24
An alternative to the surfactant based emulsion preventers <strong>and</strong> emulsion breakers are the alcohols<strong>and</strong> some of the mutual solvents. These materials are effective over a much larger range of emulsionsthan are the surfactants but are more expensive to use since they are typically in 1 % to 10% concentration,while the surfactants are normally effective in the 50 to 10,000 ppm range. The selection of asurfactant, mutual solvent or solvent should be based on performance <strong>and</strong> then on total cost of thediluted system.Use of any type of surfactant at a greater concentration than the test maximums should be strictlyavoided. Surfactant properties, particularly in the performance of demulsifier <strong>and</strong> nonemulsifier chemicalswill change with concentration <strong>and</strong> the same materials that broke or prevented emulsions at oneconcentration may actually create emulsions at another concentrations. This is true of both surfactants<strong>and</strong> the surfactant based mutual solvents.When a specialized workover fluid is based on an emulsion, the surfactant emulsifier should provide astable emulsion without creating formation damage. These emulsified workover fluids exhibit muchhigher viscosities than either of the base fluids. Unlike the base fluids, however, emulsions may bethinned or completely broken by shear from the pumps or through tools. The physical character <strong>and</strong>thermal stabilities of the emulsion must be known before use.Fluid loss control during workovers is critical to maintain sufficient fluid head in the wellbore to controlthe well. The viscosifiers, already discussed, are one method that is often useful in low permeabilitieswhere the dominant loss is through the matrix. In higher permeability situations, the polymer gels areoften highly concentrated <strong>and</strong> placed as pills of near solid material. These gel block treatments do notusually fill the whole wellbore, but rather just the area of the leak-off <strong>and</strong> a few feet above <strong>and</strong> belowthe zone. They are designed to hold leakoff to a minimum by their very large resistance to deformationor flow. They cannot be used in most applications as wellbore plugs between areas of the wellborewith large differential pressures. Breakers, either external or internal, or mechanical methods arerequired for removal.When the leakoff is through very highly porous (vuggy) zones or through open natural fractures, solidparticles such as those materials shown in the following paragraph are often needed.I Material I Form I Removal Technique IIINaphthalene I flakes I gas, solvent, some 011sbenzoicflakescalcium carbonate flakes, pelletsrock woolfibersorganic resinpelletssaltpelletsgas, solvent, some oils, hot wateracidacidsolvents, oilswater, undersaturated brines & weak acidsNotice that the materials in the preceding paragraph have a solvent <strong>and</strong> that many of the lost circulationmaterials, LCMs, used in drilling are not included. Most drilling LCMs do not have solvents <strong>and</strong>should not be used in workovers of wells with exposed pay zones.For a pill of fluid loss control material to work, it must reduce the fluid lost from the well to a previouslyset value. The performance of the fluid loss control, FLC, material must be stable for the life of theworkover or a procedure to recognize need <strong>and</strong> add pills must be available. Use of materials such assalt or other readily soluble forms must take into consideration that few seals produced by FLC materialsare ever leak proof <strong>and</strong> that even a minor rate of loss will eventually move a spacer fluid volumethrough the pack <strong>and</strong> expose it to fresher fluid or other solvents that may follow. To offset the loss ofFLC material, periodic reapplication of the pills are common.pH control is important where:15-25
1.2.3.4.5.The clays are sensitive to a certain pH fluid.Polymers may cross link or break the cross link with a shift in pH.Corrosion may be significantly accelerated at a low pHScale may form at low or high pHs.Soluble ions may precipitate.6. Surfactant performance may be altered.The pH is commonly adjusted by the addition of small amounts of a pH modifying chemical called abuffer. The best pH range will depend on the overall requirements of the well.Inhibitors to prevent scale deposition from waters, wax or asphaltene formation from oil or corrosionfrom gases or water are normal additives to a workover fluid. Even when used, however, the inhibitorsare normally in the part per million range. Since most workover fluids are water based, scale inhibitors<strong>and</strong> corrosion inhibitors are the most common. The need for either additive may be justified with thehelp of scaling tendency programs or corrosion guidelines. The inhibitors are especially vulnerable tointerference from other additives <strong>and</strong> system performance must be checked before the system isapplied.Bactericides are used wherever there are bacterial colonies in the base fluid, polymer or other foodsource in the finished mixture, or when the treatment is designed to reduce the activity of an existingdownhole bacterial infestation. Bactericides may be of the common gluteraldehyde base, a calcium,sodium, or potassium hypochlorite or other type. Rotation of bactericides is useful for best protection.Failure to use bactericides where contamination is known or over about 60°F surface temperaturesmay render a gelled system useless in a few hours.Additional additives such as oxygen scavengers, antisludgers, or other materials may be needed.In spite of all the ifs, the workover fluid should be as simple as possible, <strong>and</strong> the additives-if any arerequired--should be designed as a system.Stabilizing the formation clay is one of requirements of any drilling, workover, or stimulation fluid. Theproblem is determining when clay stabilization is needed. Simple tests that show clay swelling effecton permeability by flowing one normal sodium chloride followed by fresh water are useless in predictingclay response unless those solutions are to be used in the well. A better test is to flow the workoverfluid through a core from the zone of interest. Other information on clay audits effects arecontained in the section of formation damage.Before the Job QICThe physical selection of a workover fluid <strong>and</strong> its effect on the well must be tempered by how it can beapplied. Even the cleanest fluid, applied through silt filled lines <strong>and</strong> hoses or stored in tanks previouslyused for mud, cement h<strong>and</strong>ing, or stimulation flowback can become damaging. Much of the formationdamage seen after a stimulation or workover is a result of our consistent refusal to clean up our act<strong>and</strong> force the fluid h<strong>and</strong>ling companies to clean up theirs. We pay heavily for our folly in lost production<strong>and</strong> plugging of good wells.The following checklist is a compilation of the thoughts of many authors <strong>and</strong> should be considered aminimum.1. Start with a good quality, low (quantity) suspended solids fluid.15-26
2. Filter according to established specs.3.4.5.6.Transport, mix, <strong>and</strong> store the workover fluid only in clean covered tanks.When filtering, pump from the “dirty fluid tank through the filter to a clean fluid tank. Do not circulateback to the dirty tank.Disperse <strong>and</strong> hydrate polymers to get the least “fish eyes.”Use only clean breaking polymers.7.8.9.Use only fresh, filtered crude or refined hydrocarbon when an oil workover fluid is needed. Donot use oxidized crude.Do not switch from mud to completion fluids by just cleaning the tanks. Flush out <strong>and</strong> cleanpumps, manifolds <strong>and</strong> flowlines.Condition the mud in the wellbore before changeover to a completion fluid. Conditioning toremove cuttings <strong>and</strong> high solids mud may take 24 to 48 hours or more, not just bottoms up.10.Avoid painted tools.11.Use pipe dope sparingly on the joint pin, not the box.Fluid FiltrationPractical filtration means removing some of the undissolved solids from the water, acid <strong>and</strong> oils thatare used as completion <strong>and</strong> stimulation fluids. Even water that looks perfectly clear has some solids.Waters that are murky, dark or outright muddy will have enormous amounts of solids <strong>and</strong> may be moredamaging than a properly made drilling mud.Feeling for <strong>and</strong> against the use of filters are often severe.1. “I don’t like to use filters, they plug up too rapidly,” - unnamed field foreman.2. “Producing formations are the most expensive <strong>and</strong> the most effective filters k n~wn.”~~*~~The preceding two quotes illustrate the need for information about filtering. Much of the formationdamage that a completion engineer faces is nothing more than a self-inflicted wound.Research on plugging by particles conducted by Tuttle <strong>and</strong> bark mar^^^ has found a direct correlationbetween the dispersed solids content <strong>and</strong> permeability reduction when using high permeability cores.This data, Figure 15.6, shows that water containing more than approximately 2 ppm of dispersed solidswill significantly reduce permeability in a very short time. The data also showed that backflowing<strong>and</strong> acid treating of the damaged plugs would restore only about 50% of the initial core permeability.Other investigators have indicated similar findings.28 A field study conducted by Oliver2’ showed thatwhen a number of compatible wells were treated with completion fluids filtered to 10 microns, thewells had a 45% greater productivity than wells treated with fluids filtered to 25 microns. This is a significantincrease in productivity caused simply by cleaning the injected fluid.Unfiltered fluids, particularly those which have a large amount of solids, may cause severe damage<strong>and</strong> may be responsible for many workover failures. There are several different methods for filtrationthat will provide reasonably clean, inexpensive fluid at relatively high flow rates.15-27
(Tuttle & Barkman, SPE)Figure 15.6: The rate of permeability reduction of a 450 mdCypress s<strong>and</strong>stone core when exposed to varioussource waters with entrained solids.The filtration process is not as simple as ordering out a filter. Filter type, filter cycle life, amount of solidsremoved <strong>and</strong> rate are dependent upon filter material <strong>and</strong> the properties of the fluid being filtered.The higher viscosities of the brines in use today create special problems for filters. The work of Glaze<strong>and</strong> E ~hols~~ pointed out several areas that must be considered:1. Flow density (volume of solids per unit of fluid) is used to determine optimum fluid throughputrate.2. Viscosity slows filtration in indirect proportion to the amount of viscosity.3. Filter life is affected, among other factors, by initial differential pressure <strong>and</strong> flow density.4. Most filtration is a combination of cake <strong>and</strong> depth filtration. This means that the best filtrationoccurs just before a filter plugs up.5. Pressure differential on the filter should be as low initially <strong>and</strong> is expected to increase withthroughput.Even a cleanly filtered brine, however, is still subject to contamination by picking up material on thedownstream side of the filter. This may include mud on the walls of tubulars, scale, rust, bacteria <strong>and</strong>pipe dope. When cleaning a well prior to stimulation, two or three casing scraper runs may be neededto remove drill mud solids, mill scale <strong>and</strong> corrosion particulates before chemical treatment. Storagetanks that are utilized for fluid h<strong>and</strong>ling <strong>and</strong> all manifold <strong>and</strong> piping must also be cleaned. It is recommendedthat downhole tools should be used unpainted <strong>and</strong> made up using pipe dope that has beenapplied very sparingly to the pin ends only.26 Doping the box of the connection will squeeze excesspipe dope into the tubing <strong>and</strong> form a very low permeability plug over the face of the formation. Thepipe dope problem has been well known for many years, yet drilling <strong>and</strong> workover crews that have noresponsibility for well performance routinely heavily dope connections to prevent leaks <strong>and</strong> joint breakoutproblems. This excess dope is one of the main causes of formation damage in a new well.15-28
The level of filtration is really two things: the size of particles that are removed <strong>and</strong> the percentage oftotal particles that are removed. The first factor is influenced by the size of the particles passing the filter(the micron rating) <strong>and</strong> the second, called the beta rating, is a measure of both filter efficiency <strong>and</strong>fluid cleanliness.The first confusion point in filter selection is the so-called micron rating. Simply put, the micron measurementrefers to the maximum size of particle that can pass through the filter. As with most simpledefinitions, it is not that simple. There are two micron filtration ratings: absolute <strong>and</strong> nominal. Neitherrating is really defined by hard tests <strong>and</strong> remains the subject of debate. Absolute numbers usuallymean that the micron rating is the largest size hole in the filter, <strong>and</strong> the particles passing through mustbe smaller than the hole. The problems with this nomenclature are in how those holes are measured.Nominal numbers are not a measurement of the holes in the filter, but of the particle size passingthrough the filter. The difference in these two meanings seem slight; however, it is not the end of thedefinition or the influencing factors.Flow rate, pressure <strong>and</strong> the amount of solids on the filter affect the filtration. Nominal filters are usuallywound string or woven materials. At high rates <strong>and</strong> pressures, the fibers can be forced aside <strong>and</strong>much larger particles can pass through the filter. As the filter is used, solids buildup on the surface ofthe filter. This “bed” of solids forces the fluid <strong>and</strong> solids to flow between the solids particles before itcan reach the filter. With time, the filter gradually becomes covered <strong>and</strong> becomes a more restrictive filterbecause of the smaller pore size. Thus, both nominal <strong>and</strong> absolute filters are least efficient whennew <strong>and</strong> most efficient with buildup of a bed of particles. Unfortunately, as the bed of particles builds,the flow rate of fluid that can pass through the filter quickly diminishes <strong>and</strong> pressure increases. Soon,a new filter must be used <strong>and</strong> the process starts over.Out of the confusion on micron rating came the beta rating, a measure of how much solids areremoved by a filter.31 To get the beta rating, a dispersion of solids in water are flowed through a filterat a set rate. The amount of solids in the water challenging the filter is compared with the amount ofsolids in the water coming through the filter.Influent Concentration= Effluent ConcentrationThe “Influent” <strong>and</strong> “Effluent” concentrations refer to the upstream <strong>and</strong> downstream (respectively) particlepopulations or counts at a certain size particle. For example, if over the useful life of the filter,100,000 particles of a size greater than or equal to or greater than 2 pm (microns), are trapped on thefilter <strong>and</strong> 100 particles of a size equal to or greater than 2 pm pass through the filter, then the betaratio of the filter for 2 micron, or B2, equalsB2 =100,000100= 1,000For every 1,000 particles of 12 pm that are inbound with the water, 1 particle gets through. Inversely,999 particles are stopped, so the efficiency of the filter is 99.9%.Bx- 1x 100BXYO Cumulative removal efficiency = -The beta ratio <strong>and</strong> the cumulative removal efficiency percent for various levels of filtration are given inFigure 15.7, (West).32 A minimum beta ratio of 100 for 2 micron particles, p221 00, is recommended forstimulation <strong>and</strong> completion operations.15-29
Rdation8hip between bota ratio <strong>and</strong>percent cumulative nmoval effickncyCumulrtiw mwalBarn nua cfflcieny, %1 02 504 755 8010 9020 959898.6799.0099.9099.94(West, PEI)Figure 15.7: The relationship of the beta factor tothe removal of solids from the filtrate.The 2 micron level has been determined by several researcher^.^^^^^ Their tests show that particlesslightly larger than 2 microns can promote significant formation damage. Information available fromHashemi <strong>and</strong> Ca~thien,~~ Figure 15.8, show the damage occurring from a variety of particle sizes in acore flow experience. From this data, it can be easily seen that filtration to 2 micron or less should bea stringent requirement. Even in the high permeability formations of the North Sea, Matthews, et al.,%showed the need for filtration.0 4 8 12 16 20 24pore volumes injected(Hashemi 8 Caothein, OGJ)Figure 15.8: The effects of the level of filtration on thepermeability of a core.As important as filtration is, it is only the first step in the solids removal process. For a full treating forcleanup of a fluid during circulating, the equipment would include, in order: a shale shaker, settlingtank, desilter, centrifugal separator, <strong>and</strong> a set of final polishing filters. Other equipment might include adiatomaceous earth filter between the centrifugal separator <strong>and</strong> the polishing filter.The nominal cartridges are the most common polishing <strong>and</strong> filtering systems.1° They are cylindricaltubes or socks of filter material that can block particles as the fluid flows through the filter. The elementof the filter is usually made from polypropylene batting, string-wound polypropylene, graded densityspun polyester or cotton cloth. Flow through the filter proceeds from the outside to the inside. Theparticles that are stopped on the filter are blocked mainly on the outer surface with some small particleslodged within the matrix of the filter or carried completely through the filter. Phenolic impregnated15-30
filters should not be used. The phenolic residue washes off the filters <strong>and</strong> severely damage the poresof the rock. Cartridge filtration uses two filter pots or chambers with 50 micron filters feeding into athird chamber with filters. With this system, the 50 micron filter pots can be pulled off line one at a timeto change filters without interrupting the filtration process until the 2 micron filters need to bechanged.35 Changing the filters at a certain psi drop is recommended for optimum filtration <strong>and</strong> flowrate. An example limit, from Sparlin <strong>and</strong> Guidry, is to change polypropylene filters when the pressuredifferential reaches 35 psi.The performance of the cartridges are dependent on the surface area available to process flow. Thus,cartridges which offer a large surface area such as the pleated cartridges, are much more durable <strong>and</strong>have a longer life than the plain round cartridges. As previously stated, the filtration efficiencyincreases with the buildup of solid particles trapped on the outside of the surface. The limit to thisincrease in efficiency is when the filter fails <strong>and</strong> bypasses a large amount of the material into thedownstream ~ ystem.~~~~~Changing filters out at the right time is critical to the success of the filteringoperation.The absolute filters can be used for acid filtration if the proper element is used. A series of tests byHouchin, et al.,’3 showed the best filter life was attained with polypropylene filters. These tests alsoshowed:1. The pleated type (absolute) filters were more effective than depth type filters.2. Mutual solvents in the acid extended the filter life of all elements but may cause some particlebypass in 2 micron absolute systems.3. Higher corrosion inhibitor loadings cause shorter filter life, although it appears that it is only theinert solids in the inhibitor that are filtered out.4. Filters may remove some surfactants - testing is required with the specific additives. (If the filterremoves the surfactant, the formation will probably remove it as well.)5. Chemicals such as oil soluble resins <strong>and</strong> all diverts <strong>and</strong> fluid loss additives should be addeddownstream of the filter.6. Powdered additives <strong>and</strong> additives that have slow solubility should be mixed well in advance. Theinsoluble material should be allowed to settle out.The third type of filtration is diatomaceous earth or DE.38 Diatomaceous earth is the siliceous remainsof marine algae. Because of its consistent size, the DE material is built up on a dressing medium orscreen <strong>and</strong> DE filter aid fed in with the water to establish a continuous <strong>and</strong> very economical method offluid filtration. The DE units are very sensitive to pressure fluctuations <strong>and</strong> backwash <strong>and</strong> should berun with a final cartridge filter downstream to remove the small DE particles that are often sweptthrough with the filtered fluid. Large frame DE filters are available that can filter at reasonably hightreatment rates with a minimum of continuous maintenance.In a field <strong>and</strong> laboratory work, Houchin, et a1.,36p37 rates the various types of filtration system <strong>and</strong> commentson the level of filtration <strong>and</strong> its importance to prevention of formation damage. These authorsquote a level of filtration based on the average pore throat diameter with regard to the type of fluidbeing flowed. They also note that nominal <strong>and</strong> absolute cartridge ratings cannot be compared: a new10 micron absolute filter can remove more solids <strong>and</strong> finer solids than some 2 micron nominal filters.One solution to this rating problem is to always specify a beta rating when ordering filters.Particles of a size 116 to 112 the size of the average pore throat diameter should be removed by settling,flocculation or screening to minimize surface restrictions of the pores.2 The action of fine parti-15-31
cles in brines to form a double charged layer <strong>and</strong> the resultant electric charged particle clumpingmakes filtration of the particles easier. Surfactant addition disperses the particles <strong>and</strong> make filteringless efficient. Houchin recommends a filtration level of:Level of filtration = Avg Pore Throat Diameter x 0.20The minimum filter size recommended is 2 micron. Although 0.5 micron filters are available, their useshould be limited to special applications, very sensitive formations, <strong>and</strong> removal of bacteria.Houchin, et al., point out that the DE filters are the most cost effective devices for brine filtrationprojects. However, DE filters cannot be used with acid stimulation fluids or some gelled brines.When polymer gelled fluids are to be used, fine filtration of the fluid should take place before the gel isadded. A course filter should be in the downstream line to remove the microgals that result fromincomplete hydration of the polymer structure. In most field operations, a shear device is used toimprove the dispersion <strong>and</strong> the viscosity of gelled fluids. When gelled fluids are filtered, the level of filtrationcan generally not be finer than 10 microns.Cleaning fluids in tanks requires flow from the dirty tank, through a filter <strong>and</strong> into a clean tank. Circulatingfrom a dirty tank through a filter <strong>and</strong> back into the dirty tank cannot satisfactorily clean the fluid.Field Testing <strong>and</strong> Measurement of “Clean”There are few established field tests for estimating fluid cleanliness. Most rapid measurements useNTUs (National Turbidity Units). This test involves shining a light of known intensity through a setdiameter glass tube filled with the water <strong>and</strong> measuring how much light is received. Water color <strong>and</strong>iron in solution may affect the test. A better method, although not practical for many field jobs are theparticle analyzers or filter paper tests.ApplicationThroughout any workover operation, the criteria of well control must be stressed.The pressures encountered in a formation are usually categorized as low pressure, normal pressure,or high or abnormally pressure. Normal pressure is the pressure exerted at any depth by a full column(to the surface) of saturated NaCl water, a gradient of 0.47 psi/ft. Although high pressures are moredifficult to h<strong>and</strong>le, the most problems occur with normally pressured <strong>and</strong> slightly low pressure wells.There are three methods of workovers that may be used, provided the proper well conditions are satisfied:underbalance, neutral <strong>and</strong> overbalanced. Underbalanced workovers do not totally control theformation pressure, thus some inflow is expected. This technique is only used in those wells (almostalways under pressured) that will not flow to the surface, or where a minimum of surface equipment(lubricator) will withst<strong>and</strong> the pressure during the operation. The technique .has enormous advantagessince none of the workover fluid enters the zone. In very low pressure zones, mechanical isolation isoften required in combination with a very light weight fluid to prevent excessive fluid entry <strong>and</strong> formationdamage.In balanced workovers, the workover fluid weight is matched as closely as possible to the formationpore pressure. Advantages are minimum fluid entry <strong>and</strong> potential damage. To use the techniquerequires a very accurate knowledge of the pressure in the zone. Tripping must be done very carefullyto avoid swabbing the well.Overbalanced workovers use a fluid that exerts a higher pressure than the pore fluid. Although this isthe most common method, it can be the most damaging since it permits the entry of the workover fluidsinto the formation. Significantly higher weights of fluids should be avoided for two reasons: a highloss of fluid through the matrix <strong>and</strong> the possibility of fracturing the formation. Formation fracturing may15-32
occur any time the pressure exerted by the fluid exceeds the fracture initiation pressure of an exposedzone.Kill String CompletionsDeep, high pressure gas wells are a challenge to complete since they may often have trace to considerableamounts of H2S, CO2 <strong>and</strong> high chloride water. In addition to high bottomhole pressure, if theformations are hot, it increases the problems involved in both corrosion <strong>and</strong> in killing the wells when aproblem is presented. See the chapter on corrosion for more information.One way of h<strong>and</strong>ling a problem with this type of operation is to use a dual string completion. In this situation,a small diameter (usually 1 in.) string is set through the packer into a kill block immediatelyabove a production packer. A schematic of this operation is illustrated in Figure 15.9. This type operationcan be used in both tubingless completions where the tubing is completely cemented in <strong>and</strong> otheroperations.Figure 15.9: A small diameter kill line runinside larger tubing.Returning Wells to OperationReturning wells to production or injection after a workover is usually not an involved process, if theworkover was designed <strong>and</strong> applied in a way that minimizes formation damage.In a well on artificial lift, the technique is no more involved than running in with the pump <strong>and</strong> placingthe well on production. A clean up period is usually expected during which time the load fluid shouldbe mostly recovered <strong>and</strong> hydrocarbon flow initiated. The load fluid is rarely all recovered--trapping inpores of the formation or blowing back as a mist with gas often accounts for a substantial amount ofvolume.In flowing or gas lift wells, an assist by jetting or swabbing is often needed. These operations lower thebottomhole wellbore pressure, creating an inward pressure differential. Swabbing is a wireline operationin which a swab cup apparatus, Figure 15.1 0, is dragged upward in the tubing at high speeds. Thefluid ahead of the swab is driven up the wellbore as a piston, momentarily reducing the hydrostaticweight of the column of fluid. At the top of the swab travel, the swab is dropped through the st<strong>and</strong>ingfluid to the starting point <strong>and</strong> the cycle is repeated. Swabbing on a well for 2 days or more is notuncommon when the loss of fluid is severe.Jetting fluid from a well is usually accomplished with a coil tubing unit <strong>and</strong> nitrogen. The coil tubing isrun to a point, usually somewhere above the zone so that an underbalance can be created <strong>and</strong> thenitrogen is flowed down the coiled tubing <strong>and</strong> up the coiled tubinghbing annulus. This is a temporaryform of gas lift. In zones sensitive to gas (oil reservoirs above the bubble point), placing the end of the15-33
Figure 15.10: A sketch of a swab cup unit.tubing several hundred feet above the perfs can effectively utilize the technique without endangeringthe oil zone.Workover <strong>References</strong>1.2.3.4.5.6.7.8.9.10.11.Adams, N.: “Kicks Give Clear Warning Signs,” <strong>Oil</strong> & <strong>Gas</strong> J. (Oct. 15, 1979), pp. 132-142.Adams, N.: “Pressure-Control Procedures During Workover Differ From Drilling,’’ <strong>Oil</strong> & <strong>Gas</strong> J.(Aug. 10, 1981), p. 119-126.Adams, N.: “Killing a Producing Well,” <strong>Oil</strong> <strong>and</strong> <strong>Gas</strong> J. (Aug. 17, 1981) p. 115.Adams, N.: “What to Remember About Bullheading,” World <strong>Oil</strong>, (March 1988), p. 115Adams, N.: “Deep Waters Pose Unique Well Kick Problems,” Pet. Eng. Int,, (May 1977), p. 25.Adams, N.: “Conventional Rigs, Snubbing Units H<strong>and</strong>le a Variety of Workover Jobs,” <strong>Oil</strong> & <strong>Gas</strong>J., pp. 75-78.Adams, N.: ‘Stripping, Snubbing, Hot Tap-Last Resorts in Well Control,” <strong>Oil</strong> & <strong>Gas</strong> J. (Mar. 10,1980), pp. 100-1 06Adams, N.: “Choke Devices, Mud System Aid Well Control,” <strong>Oil</strong> <strong>and</strong> <strong>Gas</strong> J., (Oct. 12, 1981),p. 91.Lapeyrouse, N. J.: “Formulas <strong>and</strong> Calculations for Drilling, Production <strong>and</strong> Workovers,” GulfPublishing Co., Houston, 1992.Hall, B. E.: ‘‘Workover Fluids, Part 1 ,’I World <strong>Oil</strong> (May, 1986), pp. 11 1-114.Hall, B. E.: “Workover Fluids, Part 2,” World <strong>Oil</strong> (June, 1986), pp. 64-67.15-34
12.13.14.15.16.17.18.19.20.21.22.23.24.Hall, B. E.: “Workover Fluids, Part 3,” World <strong>Oil</strong> (July, 1986), pp. 65-68.Hall, B. E.: “Workover Fluids, Part 4,” World <strong>Oil</strong> (Oct. 1986), pp. 61 -63.Hall, B. E.: ‘‘Workover Fluids, Part 5,” World <strong>Oil</strong> (Dec., 1986), pp. 49-50.Millhone, R. S.: “Completion Fluids for Maximizing Productivity State-of-the-Art,” J. Pet. Tech(Jan. 1983), pp. 47-55.Adams, N.: “How to Use Fluids to Best Advantage,’’ <strong>Oil</strong> & <strong>Gas</strong> J. (Nov. 9, 1981), p. 254, 259,261, 262, 267, 269, 270, 275.Bleakley, W. B.: “Clear Completion <strong>and</strong> Workover Fluids - What They Are, What they’ll Do,” Pet.Eng. Int. (Aug. 1980) 19-22.Place, J., Paul, J. R., Sigalas, A.: “High Density Clear Fluids for Completions <strong>and</strong> Workovers,”Paper EUR 261, presented at the Eastern Offshore <strong>Petroleum</strong> Conference, London, Oct. 21-24,1980.Stauffer, R. J.: “Calcium Bromide Based Completion Fluids,” Paper SPE 5774, presented at theEuropean Spring Mtg. Amsterdam, April 1976.Spies, R. J., Himmatramka, A. K., Smith, J. R., Thomas, D. C.: “Field, Experience Utilizing HighDensity Brines as Completion Fluids,” SPE 9425, presented at the 55th Annual Mtg., Dallas,Sept. 21-24, 1980.Conners, J. H., Bruton, J. R.: “Use of Clear Brine Completion Fluids as Drill-in Fluids,” SPE8223, presented at the 54th Annual Mtg., Las Vegas, Sept. 23-26, 1979.Patton, L. D., Abbott, W. A.: “Considerations for Selecting Well Servicing Fluids,” Pet. Eng. Int.(Feb. 1980), p. 50, 52, 56.Pardo, C. W., Andrus, T. S., Bibb, B.E., Bibb, S. E.: “Foam Recompletions of High-Angle, LowPressure Dry <strong>Gas</strong> Wells, Offshore Lousiana,” SPE 18844, Prod. Oper. Symp. Okla. City,March 12-1 4, 1989.Adams, N.: “How to Control Differential Sticking,” Pet. Eng. Int., (Oct 1977), p. 40.<strong>References</strong> on Filtration25. Sparlin, D. D.: “Advances in Well Completion Technology,” JPT, (Jan. 1982), p. 17-18.26. Maly, G. P.: “Close Attention to the Smallest Job Details Vital for Minimizing Formation Damage,”SPE 5702, Formation Damage Symposium, Houston, Jan. 29-30, 1976.27. Tuttle, R. N., Barkman, J. H.: “New Nondamaging <strong>and</strong> Acid-Degradable Drilling <strong>and</strong> CompletionFluids,” JPT, (Nov. 1974), pp. 1221-1226.28. Contu, L. A., Nall, A. E.: “Field Development of D.E. <strong>and</strong> Cartridge Filters for CompletionNVorkoverFluid Filtration,” SPE 16933, 62nd Fall Meeting, Dallas, Sept. 27-30, 1987.29. Oliver, D. A.: “Improved Completion Practices Yield High Productivity Wells,” Pet. Eng. Int., (April1981) 23-28.15-35
30. Glaze, 0. H., Echols, J. B.: “Filtering <strong>Oil</strong> Field Brines Is Not that Simple,” World <strong>Oil</strong>, (Oct. 1984),pp. 85-88.31. Ammerer, N. H., Jewell, J. E., Hashemi, R.: “Completion Fluids: A Generic Overview,” Pall WellTechnology, also published in Drilling (May, June, Aug. 1983).32. West, R. D.: “Proper Filtration Cartridges Improve Particle Removal,” Pet. Eng. Int. (Feb. 1988),pp. 36-42.33. Hashemi, R., Caothien, S.: “Benefits of Solids Filtration Evaluated,” <strong>Oil</strong> <strong>and</strong> <strong>Gas</strong> J, (Jan. 27,1986).34. Matthews, R. R., Tunal, T., Mehdizdeh, P.: “Evaluation of Seawater Filtration Systems for NorthSea Application,” JPT (May 1985), 843-850.35. Sparlin, D., Guidry, J. P.: “Study of Filters Used for Filtering Workover Fluids,” SPE 7005, FormationDamage Symposium, Lafayette, Feb. 15-1 6, 1978.36. Houchin, L. R., Dunlap, D. D., Hutchinson: “Formation Damage During Gravel-Pack Completions,”SPE 171 66, Formation S<strong>and</strong> Control Symposium, Bakersfield, Feb. 8-9, 1988.37. Houchin, L. R., Dunlap, D. D., Hudson, L. M.: “Field Mixing <strong>and</strong> Filtration of Acid Stimulation Fluids,OTC 5244, 18th OTC, Houston, May 5-8, 1986.38. Barron, W. C., Young, J. A., Munson, R. E.: ”New Concept - High Density Brine Filtration Using aDiatomaceous Earth Filtration System,” SPE 10648, Formation Damage Symposium, Lafayette,March 24-25, 1982.39. Skalle, P., Podio, A. L.: “Trends Extracted from 1200 Gulf Coast Blowouts During 1960-1 996,”World <strong>Oil</strong>, pp. 67-72, June 1998.15-36
Chapter 16: High Temperature, High PressureCompletionsHigh temperature, high pressure (HTHP) completions represent one of the most difficult frontiers forthe petroleum industry. Most of the available completions technology begins to fail at approximately250°F. Pressure threshold for HTHP wells is harder to define with some sources referencing a totalpressure, while other engineers think of any pressure over a gradient of over 0.46 psi/ft as a highpressure well. Industry experience with HTHP completions has been checkered by both success <strong>and</strong>failure. In the final analysis, HTHP wells are often an expensive learning process. For more informationon HTHP completions, the reader is referred to World <strong>Oil</strong>’s “High Pressure Well CompletionsH<strong>and</strong>book (1 978) by Snyder <strong>and</strong> Suman.’True high temperature, high pressure wells account for only a few percent of the yearly well total, yeta single mistake or failure in these wells can easily cost in excess of a million dollars. The low well frequency<strong>and</strong> the high cost of both wells <strong>and</strong> workovers make learning difficult. Most engineers mayonly be exposed to a h<strong>and</strong>ful of HTHP wells in their careers.High formation fluid pressures are usually caused by one of two conditions. The most common sourceof high pressures, especially geologic areas with rapid sediment accumulation <strong>and</strong> seal forming conditions(marine deposited shales), are entrapment of a formation by impermeable shales soon after theformation is filled by hydrocarbons. The fluids in the closed “cell” prevent further compaction of the formationby supporting most of the overburden load. Porosity reduction <strong>and</strong> the related increase inbonding strength increase, common with increasing depth due to weight of sediments, is stopped insome cases because formation water volume <strong>and</strong> movement is limited. Stopping compaction preservesporosity. High pressure zones are often associated by high formation porosity, as shown by theporosity recording with depth for a high pressure zone in Figure 1 .* The other common contribution todevelopment of high formation pressure is lifting a formation to a shallower level by a salt dome movementor geologic thrusting.In general; buried formations should have fluid pressures that do not exceed the weight of the overburden,a value of about 1 psi/ft. This is the normal upper limit. Overburden gradient, however, canvary widely from place to place. Even in a single well, the overburden may change rapidly in responseto lighter weight sediments or supporting arches in the structure of the formations.The depth at which high pressure formations are found may vary from over 20,000 ft (6,100 m) to lessthan 2,000 ft (610 m). This depth insensitivity makes drilling in these areas difficult. Warning signs thata high pressure formation is being penetrated may include unexplained increase in porosity, a change(usually an increase) in drilling rate, a change in temperature gradient, long, thin cuttings, <strong>and</strong> thepresence of a dense sealing formation. Other means of detection include seismic data (with properinterpretati~n),~ experience in the area, geologic markers, <strong>and</strong> after-the-fact detection such as kicks<strong>and</strong> logging.In order to successfully drill any formation, two pieces of pressure information are needed: the porepressure <strong>and</strong> the formation fracture breakdown pressure. For conventional drilling, the mud weightmust exert enough pressure to control the pore pressure while staying below the fracturing pressure.In some high pressure formations, particularly those with poor formation consolidation <strong>and</strong> in highlydeviated wells, the working window between pore pressure <strong>and</strong> fracture pressure may be very small.In very unusual cases where the window between pore pressure <strong>and</strong> fracture pressure is too small fornormal operations, special procedures such as underbalanced drilling or drilling without returns maybe an option. Both procedures are higher risk than normal drilling practices.The selection of the number of casing strings for the well is h<strong>and</strong>led in the same manner described inChapter 2. When the mud weight to control one zone will nearly break down (fracture) another zone,another casing string or liner must be run to protect or isolate the upper zone. There is usually a safety16-1
'IY2?-6-8-101214---161 I I I I I I0 10 20 30 40 50 60 'Poroslty, 4'Figure 16.1: Porosity increase in both the sealing shale <strong>and</strong>the reservoir rock in a high pressure zone.factor set on the mud weight difference between pore pressure <strong>and</strong> fracture breakdown that is equal tothe swab effect. An example of a plot of mud weight versus true vertical depth is shown in Figure 2.The depth at which increasing mud weight, needed to control pore pressure in deeper zones, breaksdown upper zones is indicated by the intersection of the vertical dashed lines (drawn from the mudweight) with the calculated fracture gradient.4High temperatures are often associated with high pressure formations merely because of the depth atwhich both are found. In other cases, geothermal or volcanic activity or proximity may raise the geothermalgradient. In high temperature areas such as the U.S. Gulf Coast, maximum temperature gradientsmay approach 2°F per 100 ft (3.6OC per 100 m). The normal gradient is 1 OF per 100 ft (1.8"C per100 m).Abnormal pressure cells, sealed with thick caprocks may not generate heat, but they are effectiveinsulators, keeping heat from being dispersed. Salt domes, another cause of high pressures, areexcellent insulators.Obtaining accurate formation temperature is difficult. Circulating mud temperatures, even measured atbottomhole, may be 30" to over 50" below maximum formation temperature in hotter zones. Estimationof temperature requires multiple runs on shut-in wells. The length of shut-in time depends on temperature<strong>and</strong> how long the well had been circ~lated.~Completions OperationsThe conventional approach to HTHP wellheads is to select the components so that they are rated toworking pressures <strong>and</strong> temperatures equal or greater than those expected on the well.' The problemwith this philosophy is that sometimes the components react together in ways never imagined at lowpressures <strong>and</strong> temperatures. Where possible, it is better to select wellheads <strong>and</strong> other equipmentbased on system ratings <strong>and</strong> tests.I16-2
--. I I I I I 1 IFigure 16.2: Mud weight increase with depth <strong>and</strong> the “window”between pore pressure <strong>and</strong> fracture gradient. The windownarrows with increasing depth.The idea behind wellhead design is to design for the worst possible case. The worst case is usually(but not always) the full formation pressure, less a dry gas gradient. Special cases may includeextreme high pressure salt water formations, acids, thermal stimulation, or corrosive gases.The first casing head or spool must h<strong>and</strong>le pressures produced by any zones that are drilled or completedbefore the next full string is run <strong>and</strong> cemented. The uppermost head must h<strong>and</strong>le the highestpressures produced during drilling, completing or production. The wellhead components are stackedwith pressure ratings increasing by one full step (i.e., 3,000 psi to 5,000 psi to 10,000 psi) whenneeded. As pressure ratings are increased, the lower pressure components below must be isolatedfrom the higher pressure. On HTHP wells, flanged connections are the norm. In most completions, aprofile is included in the top of the tubing that allows setting a plug to seal off pressure when a surfacevalve must be changed. The plug must have an equalizing feature that allows pressure equalizationbefore the plug is released.Materials for components <strong>and</strong> seals are selected for both pressure <strong>and</strong> temperature criteria, but corrosionprotection is the overriding consideration. Materials are specified by API spec 6A <strong>and</strong> by NACEst<strong>and</strong>ard MR-01-75 for sour gas (H2S) service. Seals are almost always metal to metal.High temperature, high pressure formations are often a combination of the worst problems involved inboth high pressure completions <strong>and</strong> high temperature completions. When these two problem areasact in concert, the failure rate is often severe.One of the major problems in HTHP wells is increased corrosion <strong>and</strong> erosion/corrosion. Increased corrosionmay be due to CO2 or, more likely, to a variety of problems caused by H2S. Completions in high16-3
temperature, high pressure sour gas wells are among the most difficult operations in the completionsfield. H2S is not only severely corrosive, it is also a poisonous gas which must be prevented fromuncontrolled venting into the atmosphere. In the case of H2S effect on equipment, installation of materialsknown to be resistant to stress sulfide cracking is the most practical method of preventing failure.Erosion may be triggered by high pressure gas flow, liquid flow, droplets, bubbles, or solids.Casing grades for HTHP wells are selected by the same process as convention wells: production <strong>and</strong>completion requirements, plus: burst, collapse, tensile, corrosion, <strong>and</strong> cost. Because of the increasedcost of strings designed for worst possible cases, some operators may include cement support inpressure protection <strong>and</strong> may include buoyancy in tensile calculations. While the use of buoyancy isfeasible, especially since high pressure zones are dependent on full mud columns, assuming thatcement support is always available will lead to problems. Collapse <strong>and</strong> burst safety factors mayincrease slightly in HTHP wells, especially where corrosion is a problem.In terms of application, the number of casing grades <strong>and</strong> weights on location should be minimized.This, in turn, minimizes the chances of placing an unsuitable joint in the wrong place in the casingstring.With HTHP wells, selection of a premium connection is a must. The high tension loads in deep wellscan often pull apart API connections. With API connections, the connection is often weaker than thebody strength.Cement blends for HTHP wells will usually focus on an efficient retarder system, often in a weightedcement system. The slurry must remain pumpable throughout the job <strong>and</strong> help remove gelled mudfrom the annulus. After setting, the cement must not deteriorate with time. Weighting agents includebarite (BaS04), iron compounds, <strong>and</strong> s<strong>and</strong>. Other processes such as combining blast furnace slagwith drilling mud to set the mud in the annulus (mud-to-cement techniques) may produce a heavycement material but questions have been raised about cracking <strong>and</strong> ~trength.~,~Because liners are a common completion on HTHP wells, special considerations must be given toliner cementing, especially where clearances are marginal (or less) by conventional cementing guidelines.Additional problems may be created by thick mud cakes <strong>and</strong> gas cutting of the cement by highpressure gas as the cement sets <strong>and</strong> hydrostatic weight is lost. Typical liner clearances are shown inthe following data for several common liner applications.'Liner Size(inches)Hole Size(inches)Casing "pper(inches)Clearance(inches)Completion mechanics such as packer <strong>and</strong> tubing selection are dependent on controlling forces <strong>and</strong>tubing movement as the steel tubulars respond to the influences of pressure <strong>and</strong> heat. Most of theinformation is covered in Chapter 4 <strong>and</strong> the section on thermal completions in Chapter 8.16-4
BrinesThe Industry HTHP experience with brines is documented, but well understood in only a few cases. Anumber of problems may occur with brine type <strong>and</strong> density range, corrosion behavior, temperatureeffects, dilution <strong>and</strong> damage effects (scale, mineraVfluid reactions, etc.).Calcium carbonate development in calcium brines at 3OO0F, indicates that use of calcium-complexedbrines or elimination of the calcium are the only reliable ways to control scale development. Inhibitorsare only effective in low concentration calcium brines.Crystallization temperatures (salt dropout or precipitation at low temperatures) become important inwinter storage, as the brine is circulated past the mud line in offshore wells in deep water or in permafrostareas.One of the biggest needs in the area of HTHP brine application is an effective fluid loss additive fortemperatures above 300°F. Starch <strong>and</strong> most polymers break down below or at this temperature. Carbonatedispersions depend on these viscosifiers for suspension. Organic resins have an upper temperaturelimit of 230°F to 270°F. Higher temperature polymers are available, such as somepolyacrylamides; however, the formation damage from these nonbreaking polymers can be severe.Typical brines for high pressure wells are shown in the following table. Remember that brines are solutionsof salts in water. The amount of salt that will dissolve is related to the type of salt <strong>and</strong> the temperatureof the fluid. Salt mixed to the saturation point at surface temperature will be undersaturateddownhole (except for inverse solubility). A problem with salt drop out can occur; however, when eitherpermafrost formations or sea floor temperatures reduce brine temperatures below the temperatureneeded to keep all the salt in solution. In these cases, solid salt plugs can form in the tubing. Problemsmay also arise with sudden pressure changes (pressure reductions) that will cause sudden precipitationof a super saturated solutions. Both of these causes have produced salt plugs in tubing thatrequired wash out operations with coiled tubing. Other, less frequent causes of "salting out" or precipitationin brines include gas evolution during production or gas percolation. <strong>Gas</strong> expansion cools thesurroundings.Brine TypeSodium GhlorideCalcium ChlorideCalcium BromideCaCI2 - CaBr2ZnBr2 - CaBr2Wt. Range Wt. Range(I blgal) (kg/l)8.3 - 10 1-1.28.33 - 11.3 1-1.358.33 - i 1.7 1-1.410.9 - 16.4 1.3- 1.9715 - 19.2' 1 .a - 2.3Besides brin weight d muds have often been used as kill or completion fluids, although formationpermeability damage from the fluid is usually severe. Newer muds with graded calcium carbonateblends are showing very good performance <strong>and</strong> minimal formation permeability damage. The problemswith muds is that many of the polymer <strong>and</strong> starch viscosifiers begin to break down at temperaturesover about 350°F (177°C).StimulationProblems with deep, hot or high pressure wells also affect stimulation attempts. In a Chevron reporton the Norphlet core tests (400°F; 20,000 ft; 10,000 psi) for the Gulf of Mexico, acidizing for removalof some forms of formation damage was possible with blends of HF (hydrofluoric) <strong>and</strong> acetic.8 Otherwork, published <strong>and</strong> unpublished, document failures due to corrosion, especially with HCI at high temperatures(t > 250°F). Corrosion inhibitors <strong>and</strong> inhibitor aids (usually metal salts) are necessary. Protectiontime at high temperatures is short.16-5
Fracturing in the HTHP reservoirs is on a case-by-case review. Frequently, even a small frac, thoughexpensive because of the required high strength proppants, can produce very good productionimprovement. Fracs are an excellent tool for bypassing damage. Because of the conductivity requirementsin most high capacity wells, tip-screenout designs should be considered for fracturing.Formation DamageThe types of formation damage from HTHP wells may not be much different than other wells, but thelevel of severity may be much greater due to the large amount of produced fluid cooling. Scales <strong>and</strong>paraffins are obvious problem areas, particularly on start-up until temperature differentials stabilize.Development <strong>and</strong> infield well design must be based on what is learned in discovery <strong>and</strong> confirmationwells. In this manner, early problems in these areas can help with early solutions. Both scale <strong>and</strong> paraffinprecipitation will change as the reservoir is depleted. Completions that have enough flexibility toh<strong>and</strong>le changing needs will be more economical over the productive life of the field.Because of the limitations of acids in the HTHP wells, formation damage is very often difficult toremove. Inhibition <strong>and</strong> damage bypass designs become very important. The best methods of preventing,removing, or bypassing formation damage begin with a knowledge of what is causing the formationdamage. Most HTHP formation damage begins with the drilling <strong>and</strong> completion fluids <strong>and</strong>practices <strong>and</strong> may often be a function of a very conservative attitude. Excessive mud weights <strong>and</strong> solidsloaded fluids are often severely damaging. If the drilling mud overbalance, for example, is morethan about 11 00 psi over the pore pressure, the DST (drill stem test) of the well will tend to show a dryhole, even in a productive zone. The best approach, especially in a HTHP well, is the informedapproach. Money spent to collect <strong>and</strong> analyze early pressure <strong>and</strong> temperature data can pay a verygood return in selecting the right mud weights <strong>and</strong> additives. Specific areas to examine to reduce formationdamage include:1. Limit the overbalance to no more than 300 to 500 psi in highest productivity zones.2. Avoid fracturing the rock with mud.3. Avoid large fluid losses, even clear brines, to the formation.4. Clean the well up as soon as possible.5. Look for signs of brittle formation failure such as accumulation of wellbore fill. The wellbore mustbe kept clear.6. Keep liquids from accumulating in the wellbore. Liquid buildup reduces production by holding abackpressure on the formation <strong>and</strong> may create water blocks.7. Test for <strong>and</strong> stop zone-to-zone crossflow.8. Use compatible mud sweeps <strong>and</strong> mud cake removal steps prior to the cement job. These steps,along with pipe centralization <strong>and</strong> movement, can help eliminate mud channels <strong>and</strong> water leaks.9. Consider damage bypass mechanisms such as extreme overbalance surging or perforating <strong>and</strong>short fractures if formation damage is more than a few inches beyond the formation face.10. Evaluate the performance of each step in the completion to decide on changes to help optimizethe well.Chemical treating (nonacid) is one possibility in these wells. A number of EDTA, DTPA <strong>and</strong> other proprietarychemicals have been advanced <strong>and</strong> tested for scale removal. Calcium sulfate removal is welltested, while barium sulfate removal is starting to show promise. Solvents are also frequently useful.16-6
Paraffin <strong>and</strong> asphaltene removal, for example, is a matter of solvency, heat <strong>and</strong> agitation. In general,xylene is the best chemical from a solvent removal st<strong>and</strong>point. Other materials such as kerosene (notdiesel) may be effective <strong>and</strong> are more environmentally friendly.Well designs that minimize sudden pressure drops in the string also minimize places for scale <strong>and</strong>paraffin to form.Well DesignIn the area of well completions, HTHP design criteria should focus on:1. overall feasibility of drilling <strong>and</strong> completion techniques with available equipment, (This includesthe ability to h<strong>and</strong>le solids at the higher flow rates <strong>and</strong> pressures.)2. feasibility of tieback operations versus the use of consistent tubular size,3. lifetime of producing wells <strong>and</strong> behavior during depletion (casing corrosion, collapse, etc.),4. prevention of incidental charging of upper permeable zones by cross flow (through poor cementisolation),5. condensate behavior during production (location of the condensate dropout point during productionof gas),6. subsurface safety valve size, depth <strong>and</strong> design,7. wellhead <strong>and</strong> tree layout <strong>and</strong> design - primary interest is ease of intervention <strong>and</strong> safety.Christmas tree designs should include the following considerations:1. maximum wellhead flowing temperature,2. shut-in wellhead pressure,3. maximum wellhead pressure,4. production outlets, including inhibitor injection access,5. kill <strong>and</strong> ventline outlets,6. swab valve access (wireline intervention),7. profiles at the top of tubing to allow valve changes in wellheads.Completions EquipmentMobil’s completions in the Norphlet formation of the Mobile Bay (Mary Ann <strong>and</strong> Mobile 823 Fields) arechallenging because of depth (>20,000 ft), temperature (4OO0F), pressures (1 0,000 to 20,000 psi) <strong>and</strong>gas composition (8.5% H2S <strong>and</strong> 3.5% CO2). A number of conclusions are available from Mobil’sdesignsg1. A single CRA string with all CRA (Chemically Resistant Alloy) Components has proven satisfactory.Mobil uses C-276, a nickel-based alloy with excellent high temperature corrosion resis-16-7
tance. Another cheaper nickel-based alloy, G-50, has been successfully used in the loweststressed sections of the tubing string.Galling of the CRA tubing is eliminated by s<strong>and</strong> blasting an anchor pattern onto the thread <strong>and</strong>box. The blasting smooths rough edges <strong>and</strong> provides a textured surface to retain pipe dope.Spray molybdenum <strong>and</strong> a high temperature pipe dope compound are applied to the clean, drythread. Makeup is at 8 to 12 RPM until the joint is shouldered.Proper h<strong>and</strong>ling of the tubing is critical. Pipe is racked <strong>and</strong> b<strong>and</strong>ed during storing <strong>and</strong> shippingso that there is no metal contact between the tubes. The threads are protected with nonmetal,premium thread caps. At the rig, the tubing is h<strong>and</strong>led with nylon slings <strong>and</strong> rubber-lined pickup<strong>and</strong> tear down equipment. The elevators are designed for maximum die contact <strong>and</strong> minimumpenetration. H<strong>and</strong>ling damage, beyond a set level of maximum pipe body penetration is causefor rejection.2. The tubing hanger, tree <strong>and</strong> production chokes are all C-276, alloy 625, 718 or other. A manuallower block master valve, a hydraulically actuated upper master valve, a thermal well flange <strong>and</strong>a manual crown valve are used in the head. Tree valves are manufactured with all metal singleslab gates <strong>and</strong> seats. The kill side was fitted with a check valve to accommodate continuousinjection of corrosion inhibitor across the tree for protection downstream of the choke. The corrosioninhibitor injection point had to be moved downstream of the choke, however, because offoaming of the corrosion inhibitor.The most successful seals were elastically deformed metal-to-metal. Both plastically deformedmetal-to-metal <strong>and</strong> elastomeric seals on the tubing layer proved unsatisfactory. The elasticallydeformed metal-to-metal seals outperformed the other seals during extreme pressure <strong>and</strong> temperaturecycling. Common wellhead temperatures may range to 350°F.Mobil reports frequent failures in production chokes. The failure of the choke needle appears tobe mechanical but may be influenced by corrosion.3. After failures with subsurface safety valves manufactured from Alloy 71 8, the valves wereswitched to C-276. The SCSSVs, installed at a depth of 300 ft, are tubing retrievable flappermodels. The outer hydraulic fluid control line is Alloy 825. A synthetic hydraulic fluid is preferredto organic fluid (organic fluid was coked by high temperatures).4. A PBR (polished bore receptacle) provides annular seal. The PBR is C-276. No problems havebeen encountered with these units. The principle behind Mobil’s PBR is to maintain the tubingseals in a static position during all routine operating <strong>and</strong> producing conditions. The tubing isl<strong>and</strong>ed on the load shoulder with sufficient weight to prevent movement of the seals during cold(shut-in) conditions. The primary production seals are positioned sufficiently deep into the PBRto accommodate any upward seal movement that may occur during kill or stimulation operations.5. Perforating was the most unreliable <strong>and</strong> troublesome of all completion operations. Both wireline<strong>and</strong> TCP (tubing conveyed perforating) have been used. Major problems have been with nondetonation(additional runs) <strong>and</strong> low order detonation (burst gun bodies requiring rig fishing).6. Mobil requires tight QNQC <strong>and</strong> Inventory Control on all components. A comprehensive productspecification is prepared for each completion component covering details from dimensions <strong>and</strong>tolerances to metallurgy <strong>and</strong> strengths. Inspections including basic visual, nondestructive <strong>and</strong>sometimes destructive testing are required at every step.Subsurface Safety ValvesSurface-controlled subsurface safety valves or SCSSSVs are required in most offshore <strong>and</strong> manyenvironmentally sensitive locations. The designs for high temperature, high pressure completions may16-8
have differences in comparison to the regular SCSSSVs. In high temperature, high pressure completions,the seal area is one of the predominant differences in the valve systems. The metal-to-metalseals offered by several companies have replaced the elastomer seals for either low pressure or highpressure applications. The most common SCSSSVs are the flapper-type subsurface safety valves.Other valves have been used with moderate degrees of success. In an early study, Amoco cited alower failure rate of flapper-type valves than ball valves.1° This study has been backed up by a majorstudy by SINTEF.” The conclusions of this report in all wells in the database which were taken fromthe North Sea fields reached two conclusions:1. Tubing retrievable valves are significantly more reliable than wireline retrievable valves.2. Flapper valves are more reliable than ball valves.The reliability of tubing retrievable subsurface safety valves is influenced by severalMostof these are due to removal of a few external factors that affect wireline retrievable valves. A tubingretrievable valve does not depend upon wireline or TFL (through flowline) operation to ensure that it ismechanically locked in place. The tubing retrievable valve is in the well at all times <strong>and</strong> is less likely tohave been removed for repair or workover of the well. The wireline retrievable valves must be latchedinto an appropriate l<strong>and</strong>ing nipple that is placed in the tubing string. This may incorporate several sealbores. Malfunction of the external packing in these seals is one of the common reasons for retrievablevalve failure.The type of valve, either flapper or ball valve, can make a difference, as pointed out in the SINTEFstudy. The flapper valves have the advantage of being opened by pressure on the topside whenequalizing is needed. Ball valves, however, must be opened <strong>and</strong> closed by piston action. Hence, whenan opening system is not available or is not operating in the ball valve, the string may have to bepulled to repair the problem.A number of pressure equalizing features are available on both flapper <strong>and</strong> ball valves from flowmazes to rather complicated piston arrangement^.'^^^^ In general, the simpler the pressure equalizingmechanism, the more reliable it will be.Some arguments have arisen over whether the safety valves are a safety asset or a safety liability.I7The thinking in this particular instance is that if the valves fail frequently, it may be better to have acompletion without a subsurface safety valve. A study of this type was undertaken in the Kuparuk fieldin Alaska, where it was found that the subsurface safety valves were a safety asset because of failuretimes in excess of 1,000 days. This was a risk-based study which took into account both the likelihoodof a blowout during operations, <strong>and</strong> the likelihood of a blowout during an operation to replace a malfunctioningsafety valve. This argument was also addressed in a paper from SINTEF on reliability ofwell equipment, where they plotted blowout probability as a function of mean time to critical failure.The papers are recommended reading for a discussion of the risks involved.There are some advantages to a ball valve over a flapper va1~e.l~ These may have an effect in anHTHP completion, although the flapper valve is still suggested for most instances. The advantages ofa ball valve are:1. The valve <strong>and</strong> seat are wiped each time the valve is cycled. This action may clear deposits in awaxy environment.2. Slam closure damage is unlikely with a ball valve (this problem has been eliminated in mostdesigns of flapper valves by contouring of the valve flapper <strong>and</strong> improvements in metallurgy).3. The sealing surfaces of the ball <strong>and</strong> seat are out of the path of corrosive or abrasive well fluidswhen the valve is open (the newer types of flapper valves use a tube extension to minimize corrosion<strong>and</strong> abrasion from flowing well fluids).16-9
4. For any given size, the valve-to-seat contact area (metal-to-metal) is slightly greater in a ballvalve than in a flapper valve.Old-style ball valves may have an exposed ball design. This type of configuration increases the likelihoodof damage to the sealing surface on the ball.A number of papers offer comments on seal reliabilit~.’~-~~ For HTHP wells there is increasing relianceon metal-to-metal seals. Other types of seal materials have been evaluated but very high wearor solvent attack usually eliminate elastomers (rubbers) from considerations.Annular safety valves, ASVs, systems are starting to be required, based on the philosophy of total well~ontroI.~~-~~ Since the North Sea Piper Alpha disaster, the philosophy of isolating all hydrocarbons,through both tubing <strong>and</strong> annular space from the surface, has been adopted. This has meant a broaderapplication for annular control technology. The basic annular control system in any type of completionis usually based around a shallow set packer that supports or hangs the tubing string. The slip contacteffect of these packers can be significant in a deep well, leading to casing distortion <strong>and</strong> possible failure.Improvement in slips <strong>and</strong> contact area with casing is important in these deeper wells.Another method of hanging the strings has been to place a nipple in the casing string from which tohang the annular system.24 This type of system is shown in Figure 3. The nipple designer facilitatesspace out of the string through use of PBR. other comments are:1. No packer setting required.2. Can support higher hanging weight than a packer.3. Fewer components/fewer seals.4. More room for hydraulic, chemical <strong>and</strong> instrument lines.5. More room for wireline.The nipple approach is endorsed by several makers of ASVs. It has been used in Germany but is relativelyunknown in other areas. The basic problem is that most operators do not plan their casingstrings to use the nipple concept. An alternative to the nipple is the more common ASV packer, a modifiedhanger design that uses very large slip contacts to minimize casing distortion <strong>and</strong> damage. Testsof the packers to over 700,000 lbm have been successful run. Slip area can be as much as 10 timesnormal packer slip area.23As with subsurface safety valves, annular safety valves may also cause problems. An example fromthe SINTEF paper covered an accident causing an underground blowout during a failure of an annularsafety valve. The control line to the annular valve was apparently crushed while the completion wasbeing run. When the crew pressured up the system, the hydraulic oil supply tubing held pressure, indicatingsuccess. However, the annular safety valve remained closed. When the well came on production<strong>and</strong> heated the fluid in the top part of the well, the pressure buildup caused a tubing collapse <strong>and</strong>a casing burst.Annular Pressure BuildupThe problem of annular pressure increase caused by expansion of fluids on heating is of great concernin HTHP wells, <strong>and</strong> especially in HTHP subseaIn the subsea wells, bleeding pressurethrough the wellhead, as is done routinely on surface wells, is not easily possible. A number of papersare available to model the pressure buildup <strong>and</strong> design-specific completions for the pressure buildup.In most wells, either bleeding the pressure off or placing a compacting material in the annulus can16-10
ADJUSTABLEUNIONWINOREmIEvABLErn VAlVEhSVcoHlROLUNEA”W RowPASSAQEUTCHANNULARSAFEW VUVEKmELASTOMERlCSEALS- DUAL BORE HANGERWYD~UUUCCONTKx UN€Km TRSV. GASINQNIPPLE(P6R)rSsEMBLYCASlNQ NIP=(PBR) *ssu(BLYSPACW PUPJOINTNQGowlNaW“EUSIDMEFIK:LOWERSEU.RUTESFORMWP*SSAOESIngk String ASV-PBR SystemDud Mng ASV-PER Syst@mFigure 16.3: Examples of ASVs in Nipples Set in the Casing(SPE 267410)h<strong>and</strong>le the pressure buildup. Cost comparison of this method has been good when compared toexpensive methods such as the high-weight casing <strong>and</strong> may generate savings, particularly for theHTHP wells. The technique has been studied by Conoco Norway.26 Other methods which have beenused include use of heavyweight or high yield casing, leaving part of the formation behind the casingexposed to leak fluid off, or providing a leak path or a bleed port.The heavyweighvhigh yield casing seeks to provide strong enough casing to resist pressures generatedby the heat-up process. The technique is popular, but it relies heavily on an accurate knowledgeof the endpoint pressure. The drawback of the method is cost. The high casing weight or grade typicallytranslates into higher prices. Secondly, sour service conditions may eliminate the use of thehigher alloy grades. The last problem is that the system does not actually solve the problem; it merelycontains it. Leaving the top of the cement below the previous casing shoe allows an exposed formationzone for leakoff, bleeding pressures into the formation. This approach is both inexpensive <strong>and</strong>effective, but a good formation not always available <strong>and</strong> it is not always possible to predict the top ofthe cement correctly. Providing a leak port or path is certainly feasible on a surface wellhead <strong>and</strong> technicallyfeasible on a subsea wellhead. Casing accumulators have been used on Norphlet Field (MobileBay) completions to control pressure buildup eliminating surface lines.<strong>References</strong>1. Snyder, R. E. <strong>and</strong> Suman, G. O., Jr.: World <strong>Oil</strong>’s High Pressure Well Completions H<strong>and</strong>book,”World <strong>Oil</strong>, 1979.16-1 1
2.Stuart, C. A.: “Geopressures, Proc. 2nd Symposium on Abnormal Subsurface Pressure,” LouisianaState University, Baton Rouge, Louisiana, January 30, 1970.3.Pennebaker, E. S.: “Seismic Data Indicate Depth, Magnitude of Abnormal Pressures,” World <strong>Oil</strong>,June 1968.4. Eaton, B. A.: “Deep Well Planning Can Minimize Drilling Problems,’’ World <strong>Oil</strong>, June 1972,pp. 59-62.5. Fertl, W. H. <strong>and</strong> Timko, D. J.: “How Downhole Temperatures, Pressures Affect Drilling,” 10 partseries World <strong>Oil</strong>, June 1972 to March 1973.6. Cowan, K. M., Hale, A. H. <strong>and</strong> Nahm, J. J.: “Conversion of Drilling Fluids to Cements with BlastFurnace Slag: Performance Properties <strong>and</strong> Applications for Well Cementing,” SPE 24575, Washington,DC, October 4-7, 1992.7.Benge, 0. G. <strong>and</strong> Webster, W. W.: “Evaluation of Blast Furnace Slag Slurries for <strong>Oil</strong> Field Applications,”SPE 27449, IADCKPE.8. Wehunt, C. D., Van Arsdale, H., Warner, J. L. <strong>and</strong> Ali, S.: “Laboratory Acidization of an EolianS<strong>and</strong>stone at 38OoF,” SPE 2521 1, New Orleans, March 2-5, 1993.9. McDermott, J. R. <strong>and</strong> Mertin, B. L.: “Completion Design for Deep, Sour Norphlet <strong>Gas</strong> Wells OffshoreMobile, Alabama,” SPE 24772, Washington, DC, October 4-7, 1992.10. Medley, E. L.: “Experience with Surface Controlled Sub-Surface Safety Valves,” EUR32, London,October 24-27, 1978.11. Molnes, E. <strong>and</strong> Sundet, I.: “Reliability of Well Completion Equipment,” SPE 26721, Aberdeen,September 7-1 0, 1993.12.13.14.Molnes, E., Raus<strong>and</strong>, M. <strong>and</strong> Lindquist, B.: “SCSSV Reliability Tested in North Sea,” <strong>Petroleum</strong>Eng. Int., November 1987, pp. 30-36.Engen G. <strong>and</strong> Rans<strong>and</strong>, M.: “Reliability Studies Test SCSSVs in The North Sea,” Pet. Eng. Intl.,February 1984, pp. 30-36.Dover, S. <strong>and</strong> Cooling, M. T.: “The Highl<strong>and</strong>er Field - One Year’s Operating Experience,” J. Pet.Tech., February 1990, pp. 220-224.15. Sides, W. M. <strong>and</strong> Going, W.: “Controlling Self-Equalizing Velocity Extends Valve Life,” Pet. Eng.Int., February 1992, pp. 46-48.16. Mason, P.G.T.: “Downhole High-pressure Equalizing Safety Valves: A Solution-Variable LabyrinthSeals,” OTC 5576, Houston, April 27-30, 1987.17. Busch, J. M., Policky, B. J. <strong>and</strong> Llewelyn, D.C.G.: “Subsurface Safety Valves: Safety Asset orSafety Liability,” J. Pet. Tech., October 1985, pp. 1813-1 81 8.18. Dines, C. A.: “A Definitive Approach to the Selection of Downhole Safety Valves for Deep-WaterFields,” Oceanology International 80.19. Morris, A. J.: “Elastomers are Being Eliminated in Subsurface Completion Equipment,”SPE 13244, Houston, September 16-1 9, 1984.16-12
20. Going, W. S., Pringle, R. E.: “Safety Valve Technology for the 1990s,” SPE 18393, London,October 16-1 9, 1988.21. Smith, R. R.: “New Contoured, Elliptical-Seal Flapper Valve Facilitates API Class II Metal-to-Metal Sealing Performance,’’ OTC 701 1, Houston, May 4-7, 1992.22. Nystrom, K. 0. <strong>and</strong> Morris, D. W.: “Selecting a Surface-Controlled Subsurface Safety Valve forDeep, Hot, High-pressure, Sour <strong>Gas</strong> Offshore Completions,” SPE 11997, October 5-8, 1983.23. Leismer, D.: “A System Approach to Annular Control for Total Well Safety,” SPE 26740, OTC,Houston, May 3-6, 1993.24. Taylor, R. W., Longbottom, J. R., Adams, M. P. <strong>and</strong> White, P. M.: “Primary Design Considerationsfor a Packerless Annular Safety Valve (ASV) System for the North Sea,” SPE 26741, Aberdeen,September 7-1 0, 1993.25. Geyelin, J. L.: “Downhole Safety Valve for Concentric Completion,” SPE 16536, Aberdeen,September 7-8, 1987.26. Oudeman, P. <strong>and</strong> Bucarreza, L. J.: “Field Trial Results of Annular Pressure Behavior in a HP/HTWell,” SPE 26738, Aberdeen, September 7-1 0, 1993.27. Leach, C. P. <strong>and</strong> Adams, A. J.: “A New Method for the Relief of Annular Heat-Up Pressures,”SPE 25497, Oklahoma City, March 21-23, 1993.28. Adams, A.: “How to Design for Annulus Fluid Heat-Up,” SPE 22871, Dallas, October 6-9, 1991.29. Cassidy, S. D.: “Solutions to Problems Drilling a High-pressure, High-Temperature Well,”SPE 24603, Washington, DC, October 4-7, 1992.30. Krus, H. <strong>and</strong> Prieur, J. M.: “High Pressure Well Design,” SPE 20900, The Hague, October 22-24,1990.31. Crow, R. <strong>and</strong> Craig, B. D.: “Drilling <strong>and</strong> Completion Practices for Deep Sour <strong>Gas</strong> Wells in theMadden Deep Unit of Wyoming,” SPE 24604, Washington, DC, October 4-7, 1992.16-13
Chapter 17: Water Production ControlThe treatment of wells to prevent or control unwanted fluid production has a long history in the oil productionindustry. Methods of modifying channeling, gas or water coning <strong>and</strong> other reservoir “problems”have resulted in a great many treatments, most of which were unsuccessful. This section describesprocedures <strong>and</strong> techniques to modify flow paths or change other reservoir characteristics near thewellbore to control unwanted production or injection of fluids.The modification of the reservoir to achieve water shutoff, redistribution of injection or other sweepimprovement in a secondary flood operation, is a poor substitute for using reservoir information to planthe location of wellbores to take advantage of the reservoir features. Unfortunately, by the time suchinformation is known about the formation, the wells have been drilled <strong>and</strong> there many not be sufficientreserves to justify new wells. With the increasing use of the technology of horizontal wells <strong>and</strong> theradial extension drilling from existing vertical wells, however, newer techniques‘to improve the drainagein established fields are available. Before extensive experimentation with the chemical <strong>and</strong>mechanical methods of changing flow paths, a study should be made o@ the possibility of using thereservoir character to improve the fluid recovery.Summary of Important PointsThe following major points illustrate the experience gained with treatment of water injection <strong>and</strong> productionproblems.1. For chemical or physical permeability modifying techniques to be successful in a pattern waterflood,the treatment must be injected deep enough into the reservoir to modify the flow of thefluid in a large area of the pattern. The actual depth of injection required will depend on horizontal<strong>and</strong> vertical permeability <strong>and</strong> well spacing in the pattern. In waterfloods, it may be necessaryto selectively treat both injector <strong>and</strong> producer.2. If deeply penetrating, permanent permeability reducing techniques are used in a primary recoveryzone, the residual hydrocarbons in the zone may not be available by later recovery methods.3. For near wellbore permeability reduction or water control techniques to be completely effective,there must be natural, impermeable reservoir-wide barriers between the treated zone <strong>and</strong> theproductive zone, the vertical permeability must be very low in contrast to horizontal permeability,or a pressure balance method of depletion may be used.4. Treatment of a zone to reduce water flow in a pattern waterflood, especially a very high permeabilityzone, will reduce the total fluid injected in the well. In wells that are operating just belowthe fracture extension pressure, the zones cannot take any more fluid, regardless of the availablevolume of water. Reducing the flow capacity of a high permeability zone must be accompaniedby a lowering of the expectation of water input. The only way to more rapidly process orsweep the formation is to drill more wells <strong>and</strong> reduce the distances between injector <strong>and</strong> producer.This is of critical importance in a low permeability reservoir.Sources of WaterBefore touching on a discussion of shutoff methods, a brief description of the sources of water influx isworthwhile.20 Water may exist in solution with oil or as water mixed with gas. Water may also exist asa pore filling phase (conflate water) or it may flow into the reservoir in response to pressure reduction.1. Solution water exists as a mixture of water vapor in hot gas reservoirs or as a “dissolved” phasein the oil. The amount of water that can be dissolved in oil is small, usually less than 0.2% by volume.However, more water is often contained as a micro-droplet dispersion in oil. What ever themethod of containment, the production of this type of water cannot be stopped.17-1
2. Connate water is a distinct phase in the pore of the formation. When production is started, someof this connate water will be produced. The amount that is mobile will depend on the irreduciblewater volume. Pore fillings that create high microporosity, such as some chlorite <strong>and</strong> illite clays,will hold higher volumes of this water. Like the solution water, this type of water cannot bestopped without stopping the oil.3. Active drive aquifers, from either bottom or edge sources, can provide pressure support forenhanced recovery from a reservoir but can also produce enormous quantities water. If permeabilitybarriers exist between the water <strong>and</strong> oil zones or if the reservoir vertical permeability ismuch lower than the horizontal permeability, then water production from these sources can becontrolled in the near wellbore. Since the water drive is an active pressure support, the waterproduction cannot be stopped completely, but with careful planning, the water movement can beused to advantage to help drive the oil.a. In bottom water drive applications, coning near the wellbore is the biggest problem. Stoppingconing requires information on the values of horizontal <strong>and</strong> vertical permeability. When verticalpermeability is much less than horizontal permeability (below 50%), then near wellboretreatments to place permeability barriers can have some effect in reducing water production.If the formation is fractured, either naturally or hydraulically, matrix permeability barriers areuseless. If the vertical permeability approaches 50% or more of horizontal permeability, barriersare also useless, but horizontal wells may be very useful.b. In edge water drives, the problem is from both vertical permeability <strong>and</strong> from horizontal permeabilityvariance or streaks of high permeability. These streaks can allow water breakthroughearly in the project life. For successful control, the streaks must be plugged from theproduction well. Depth of plugging depends on the vertical permeability. If there are barriers(vertical perm=O), then plugging depth can be shallow. If vertical permeability is high, thebarrier must extend nearly back to the original oil/water contact if the water control is to besuccessful.c. In the special case of fractured reservoir, the fractures must be plugged deep (radius oftreatment of hundreds of feet) before any water control attempt will be long lasting. If thefracture extends down into the water, density contrast techniques may be effective in pluggingoff just the bottom zone.4. Water injection in a flood follows the same rules as an edge water drive except that plugging canbe applied from both producing <strong>and</strong> injection wells. Barriers are critical to individual zone control.5. Entry of water from reservoir or tubular leaks may be very troublesome, but usually can be identifiedby salinity contrast <strong>and</strong> sealed by repair treatments such as cementing squeezes.Problem Definition - ReservoirBefore any treatments can logically be discussed, a definition of the problem must be presented. Withouta full underst<strong>and</strong>ing of what is causing the sweep problem or unwanted water production in a wellor between wells, effective treating is a very remote possibility. An analysis of fluid flow patterns <strong>and</strong> adescription of the reservoir are critical to success.There is a distinct separation of water channelling problems into near wellbore <strong>and</strong> deep reservoirbased on both effect in the reservoir <strong>and</strong> methods of treatment. In the near wellbore area of productionwells, the greatest problem in producing hydrocarbon fluids from all of the pay is permeability contrast.No formation is homogeneous, <strong>and</strong> permeability variations of 1 to 2 orders of magnitude arecommon in many reservoirs. To effectively drain all of the reservoir often requires selective stimulationof the lower permeability sections, or at times, reducing the permeability of the higher permeabilityzone if a water or gas drive is active.When a reservoir contains natural fractures, the problem of rapidly <strong>and</strong> evenly producing all the reservoirmay be compounded. Open natural fractures provide a pathway with typical permeability between10 millidarcies <strong>and</strong> 1 darcy. Completion of a well into a naturally fractured reservoir invariably leads to17-2
a state of flush production during which producing rates are very high, followed by a sharp decline inrate as the fractures empty. Production may fall 50 to 90% in a matter of weeks. The production stabilizeswith flow from the matrix into the natural fracture system. This is a characteristic of the naturallyfracturedformation <strong>and</strong> is not a “solvable problem”. Natural fracture systems are usually a positiveaspect of the reservoir, especially if the well locations are selected to take advantage of the improveddrainage that the fracture system offers. Many times, however, the natural fracture system is notextensive enough to economically serve as a conduit to the wellbore. In these cases, hydraulic fracturingwith either acid in a carbonate formation or proppant <strong>and</strong> a fluid in either carbonates or s<strong>and</strong>stoneare very beneficial if the fracture can be contained in zone.Problem Definition - Near WellboreMechanical problems in the well are often invisible culprits which cause productivity of a well to suffer.Incorrectly sized tubing, casing, insufficient perforations or improperly designed lift systems can act asa choke on a reservoir <strong>and</strong> severely limit production. There is no cure for a mechanical problem otherthan redesigning <strong>and</strong> recompleting the well.ConingNatural <strong>and</strong> induced problems in a well include fluid coning or channeling, water or gas blockages <strong>and</strong>related relative permeability effects?-3 Coning of a fluid usually occurs when a oil or gas zone is borderedby water in a reservoir with no barriers between the pays. It also may occur as gas coning intoan oil producing interval. Coning is a response of a fluid to flow towards a pressure drop. It occurswhen only part of a fluid filled, continuous formation or series of formations is perforated. The pressurein the produced area of the formation is lowered through production. The fluid in the adjacentzone then moves up or down towards the pressure drop. Coning will occur in any reservoir wherethere is an absence of a permeability barrier between the produced fluid <strong>and</strong> the unwanted fluid.Coning results in an increase in the unwanted fluid <strong>and</strong> a decrease in the production of the oil. The oildecrease occurs because the water or gas in the cone occupies part of the pore space that was onceoccupied by the oil. The amount of coning is related to the amount of vertical permeability (in theabsence of a barrier), the mobility of the produced <strong>and</strong> coned fluids, <strong>and</strong> the pressure differential.A sketch of cone development is shown in Figure 17.1. At initial production, the oil <strong>and</strong> water (in thiscase) lies at the initial oillwater contact <strong>and</strong> the entire oil column is perforated. As the oil is produced,the water rises near the wellbore in the section of the reservoir that was occupied by the oil. The operatoroften reacts to the water encroachment by squeezing off the lower perfs with cement or otherchemical barrier material. The water continues to rise in the zone with the operator squeezing <strong>and</strong> producingat the same or a higher drawdown. At ab<strong>and</strong>onment of the well, there is a large amount of oilremaining in the reservoir but only a small path to the wellbore. This problem is especially acute inbottom water drive reservoirs. Controlling coning is attempted by restricting the producing rate to avalue that minimizes water rise or by chemical treatments.There are a number of mathematical models for prediction of the maximum production rates to avoidor slow the rate of coning.4‘* These models assume a homogeneous formation with no natural fractures(these are usually poor assumptions). An equation from Karp8 is given as a example method.0.0246 k,Ap ( h2 - D2)where:kh= horizontal permeability in darcies17-3
.......................~.:.:.:.:.:.:.:.:.:.:.t:.~.:.:.~ .....................Figure 17.1: A worst case, very advanced cone that has caused early P&A of awell. This type of cone may occur where vertical permeability wasas high or higher than horizontal permeability as in the case oflocalized natural fractures extendina from the hvdrocarbon zoneinto the water zone in the area near &e wellbore. -Ap = density difference, Ibm/ft3h = oil-zone thickness, ftD = completion interval thickness, ftPO - oil viscosity, cpB = oil FVF, RB/STBre - drainage radiusrb = radius barrier (if used), otherwise rb = rwrw - wellbore radiusThe use of an artificial barrier has been proposed by several authors to prevent or slow cone development.2*8i’4These barriers are usually envisioned as thin, impermeable <strong>and</strong> pancake shaped as shownin Figure 17.2. The chemicals used for this treatment include polymers, inorganic gels, <strong>and</strong> foam. Thebasic problem with all the treatments is the diameter of the barrier. It must extend into the reservoir farenough so that the gravitational force on the water will be larger than its response toward the pressuredrop of the production well. This concept is neither affordable nor possible for most treating chemicals.Barriers rarely are a long term solution to the problem of coning <strong>and</strong> water breakthrough regularlyoccur, Figure 17.3. Additional problems with barriers are that they are seldom accurately placed in theright location <strong>and</strong> that they channel through the formation rather than moving out uniformly from thewellbore. Vertical channels often do not exactly overylay horizontal permeability channels.The more promising methods of controlling water coning in the most severe cases are the use of horizontalwells, Figure 17.4, <strong>and</strong> the concept of balanced fluid withdrawal from the re~ervoir.~*~ Coningcontrol by the horizontal well are discussed in the chapter on special completions. Balanced fluid withdrawalinvolves the removal of both oil <strong>and</strong> water from the well. The primary method of equalizingpressure is to even the drawdown across both the water <strong>and</strong> the oil zones. This is a radical change inproduction procedure since it requires perforating the water zone, isolation at the interface with a goodcement job <strong>and</strong> a packer, <strong>and</strong> then dually completing the water zone with a dedicated lift system <strong>and</strong>surface facility. The drawbacks in initial cost could be overcome in some projects by the savings inwater treating <strong>and</strong> disposal. Water produced in this manner should be naturally low in oil <strong>and</strong> the producermay be able to classify the water in a different manner as the water separated from oil.The procedure would obviously be most applicable where oil-water separation problems were severe,where large vertical permeability values could create rapid cones, <strong>and</strong> where legal restrictions werevery stringent. The process would be of only limited use in reservoirs with edge water drive <strong>and</strong> those17-4
Figure 17.2:An idealized schematic of a barrier in the reservoirseparating the hydrocarbon <strong>and</strong> water zones. Barriersare probably never this uniform since they follow thesame low resistance pathways as other injected fluids.Figure 17.3:Probably results of water flow around a barrier aswater flow responds to the continued pressuredecrease in the hydrocarbon zone caused by fluidwithdrawal.under water flood. Reservoirs that depend upon the bottom water drive as the sole source of drivingenergy could still use the dual completion process by controlling the rate of upward movement of theoil-water interface. This may be accomplished by balanced fluid withdrawals at the production wellbore<strong>and</strong> water replacement in the aquifer at an injection well.Water BlockOccasionally, when a well is killed with water or when a well goes off production <strong>and</strong> fills up with producedwater, the water will enter the zone of gas or oil production <strong>and</strong> displace the hydrocarbons fromthe area around the wellbore. In some cases, when the well is returned to production, the hydrocarbonswill not displace the water. This behavior is usually indicative of a water block. Water blocks cannotbe perfectly defined in the sense that they cannot be reliably recreated in the laboratory. However,17-5
.-.: drawdownI$0 Uses bottom water cFigure 17.4: Use of a horizontal well to slow the rate of coning ina bottom water drive reservoir.there are four conditions which usually occur when a severe water block is encountered: (1) anuntreated water (surface tension near 72 dyne/cm); (2) low reservoir pressure; (3) small pore throats;<strong>and</strong> (4) a gas zone (low pressure oil zones account for roughly 10 to 25% of reported water blocks).Although water blocks have been known to form in oil zones, they are rarer than the water blocksreported from gas producing zones. Blockages in the oil zones may also be the result of emulsions orsludges formed from contact of oil with water or acids. Diagnosis is difficult <strong>and</strong> the major problems(emulsion) is usually prepared for with a treatment of alcohol or alcohol mixture mutual solvent thatcan penetrate deeply <strong>and</strong> remove either emulsion or water block.Water blocks are usually physical changes to relative permeability or clay equilibrium. Other relativepermeability problems are related to the presence of natural or injected surfactants which may causean oil or water wetting (a bound layer of water or oil) <strong>and</strong> in situ emulsions. Any time that the pore passagesare restricted by trapped fluid or high viscosity fluid, regardless of the method entrapment, flowwill be restricted.Other near wellbore problems include the formation of scale, the deposition of paraffin, <strong>and</strong> the occurrenceof migrating fines in the near wellbore area or in the reservoir. These problems <strong>and</strong> the inducedproblems of surfactant adsorption <strong>and</strong> emulsions are best described as formation damage <strong>and</strong> can becontrolled with remedial treatment <strong>and</strong>/or inhibition production techniques.Problem Definition - Injection WellThe injection well is a special case of flow path consideration. In the unfractured injection well, theflow is outward radial flow. Injection of fluid in the unfractured case is described by the concept ofradial darcy flow through cylindrical beds in series where the “beds” may be areas of different permeabilityor layers of permeability-reducing material from solids carryover. In addition, in a typical heterogeneousformation, fractures, high permeability channels <strong>and</strong> permeability barriers (faults,permeability pinchouts, etc.) all affect the distribution of fluids at the injection well or the reservoir.Once in the reservoir, the sweep pattern between injection <strong>and</strong> production wells are directly controlledby the path of least resistance: the fluids move in the highest permeability channels to the limit of whatthe channels can carry towards an area of reduced pressure. Permeability variations <strong>and</strong> pressuredistributions through the reservoir completely control the way fluids move <strong>and</strong> the rate of their movementfrom injection well to production well.The mobility ratio, solubility of fluids within each other <strong>and</strong> the effect of injected gases on heavy endsare all very important; however, the fluids will only go where the reservoir characteristics allows them.The most basic problem, then, is how to successfully modify the reservoir character or use the reservoircharacter to the best advantage for oil recovery. Because of varying operating philosophies forwater floods over the years, most injection wells have been fractured. This must be considered in jobdesign.17-6
Reservoir Description <strong>and</strong> Modeling NecessitiesTo properly apply any lasting <strong>and</strong> effective profile modification mechanism, regardless of whether it isrelocation of the wellbore, deep matrix penetration of a permeability-reducing material or near wellboreapplication of a zone shutoff material, it is imperative that a good description of the reservoir beavailable. This description will likely be a combination of geologic <strong>and</strong> engineering knowledge <strong>and</strong>hopefully will be present in the form of computer simulator to save time in comparison of zone controlmechanisms. To use the reservoir simulation route, the model must be constructed with as muchdetailed reservoir description involving flow geometry as is possible. Location of natural fractures, verticalor horizontal permeability impairments, hydraulic fractures, thief zones <strong>and</strong> a complete descriptionof the driven <strong>and</strong> driving fluids are necessities. From this information, a solution giving details onhow deep to inject a permeability modification material or where to relocate the wellbores of injection<strong>and</strong> production wells to make optimum use of the reservoir characteristics may be possible. Simplistictwo-dimensional models or linear correlations are rarely adequate. Modeling is greatly aided by theinput of data gathered in monitoring of water in flu^.^Treating ConsiderationsObviously, the large volume treatment of wells with expensive chemicals will depend on the amount ofreserves remaining on a particular area of the field <strong>and</strong> the opportunities for success. The selection ofmatrix treating materials should also take into account the later plans for the reservoir in terms of stimulationor a tertiary flood. If a matrix or a thief zone is completely shut off by a deeply penetrating, permeability-reducingmaterial, the opportunities for tertiary recovery are severely diminished. Most of thewater shutoff materials are not removable because of either lack of a solvent or inability to contact theblocking material in the pores of the rock. Acid can remove most cement plugs <strong>and</strong> perforating canreach beyond those that are shallow (r4 ft). Fracturing is the only mechanism that can reach beyondthe deeply penetrating shutoff techniques.Modification of PermeabilityRegardless of flow geometry of the reservoir, there will always be a need, usually several times in thelife of a project, for a treatment to change the permeability of a particular zone. These treatments canbe divided into two subdivisions of the two major classes: deep <strong>and</strong> shallow methods of eitherdecreasing permeability or increasing permeability. Whenever permeability of a zone is reduced bychemical treatment, the total water injection expectations to a well should be reduced or otherzones should be carefully fractured if possible. Allowing indiscriminate fracturing of a well byincreasing pressure to increase injection rate should be avoided at all costs.Deep Modification - Permeability ReductionTo deeply reduce or plug off high permeability, a few methods are available with proven performance.The processes described in the following paragraphs are all listed in the cross-reference ofTable 17.1. Deep treating processes include silica ge1’1*12 <strong>and</strong> lignosulfonate gel for matrix treating<strong>and</strong> fly ash, limestone fines, or thermoset or catalyzed plastics for shallow to moderate depth pluggingof gravel packs or fractures.10112 Foam diversion is often listed as a deep matrix plugging techniquebut may be operable only in formations where matrix permeability is at least on the order of severalhundred millidarcie~.’~ Most polymer systems, including those intended for deep treatment, are usuallylimited to shallow placement by the high viscosity of the gel or undissolved polymer buildup(fisheyes, microgels <strong>and</strong> trash) on the injection face. Crosslinked polymers may have application inplugging fractures.Deep Modification - Increasing PermeabilityUnfortunately, hydraulic fracturing is the only method of improving the permeability enough to influencethe reservoir flow behavior. Although there is very good confidence in the mechanics of fracturing,the direction or orientation of the fracture is controlled by the reservoir stresses, <strong>and</strong> the fractureheight growth from large fracture treatments (above <strong>and</strong> below the plane of interest) is difficult to regulate,although monitoring techniques are a~ailable.’~ The technology of very tightly controlled fractur-17-7
lame i 7.1 : Generic Materrais ana Processes Available tor Reaucing PermeabilityProductLignosulfonate GelSilica GelPolymersFoamPlasticsSelective PolymersCement"Gunk Squeeze"Commentsdeeply penetrating, total permeability snutoffmoderately to deeply penetrating, total permeability shutoffshallow penetrating, partial to total permeability shutoffunproven except in high permeability control, may have good application insteam wellsshallow penetrating, permanent, total permeability shutoffshallow penetrating, some application where distinct separation of wateroccurs but exact zone locations are unknownface plugging of a zone. Only effective where barriers exist or vertical permeabilityis a small fraction of horizontal permeabilitya designation for a slurry of dry cement in diesel or other oil. The mixture setsup when water is contacted. Basic application is in vuggy or naturally fracturedformations with distinct oil <strong>and</strong> water pays where the exact zone locations arenot known. Penetration is typically shallow in vugs or fractures. It producesface plugging in any matrix.ing in small treatments, to limit length <strong>and</strong> height growth, is currently available <strong>and</strong> should beconsidered when injection rate must be increased.Shallow Modification - Permeability ReductionThere are many products <strong>and</strong> techniques to selectively or totally reduce the permeability in the nearwellbore area.10*15-19 To describe them, they should be separated into groups designed to accomplishthe specific tasks of: (1) total zone shutoff, (2) coning <strong>and</strong> encroachment control, <strong>and</strong> (3) selectivepermeability reduction.Total permeability shutoff can be easily accomplished by a number of products if one criteria is met:there must be an impermeable barrier between the zone being sealed <strong>and</strong> the producing zones. Ifthere is a barrier, then cement squeezes, plastics, polymers <strong>and</strong> inorganic gels will all work. If there isno barrier to flow, the problem will be the same as the coning problem addressed in the followingparagraph.Controlling coning is usually a delaying tactic <strong>and</strong> the established treatments may isolate large quantitiesof otherwise recoverable reserves. Coning occurs when water (or less frequently, gas) takes overpart of the productive oil zone. The flow of water is a reaction to production of hydrocarbons leading toa lower pressure in the oil zone in general <strong>and</strong> the near wellbore area in particular. Squeezing off thelower perfs <strong>and</strong> completing higher in the zone may temporarily reduce water production, but waterbreakthrough will occur <strong>and</strong> oil may be trapped <strong>and</strong> production hindered in this limited completion.Eventually, in the case of an active bottom water drive, the wellbore will be completely watered out<strong>and</strong> no oil will be produced, even though substantial reserves may remain in the reservoir.Chemical companies have several products designed <strong>and</strong> sold as selective permeability reducers.These products (usually polymers) can treat a s<strong>and</strong>pack or formation core so that oil will pass throughthe pack but water will not. While the sales concept <strong>and</strong> benchtop tests are impressive, the technologyis extremely poor <strong>and</strong> will probably reduce oil production in any well where oil <strong>and</strong> water are producedfrom the same zone or in many coning applications. In any case where oil flows with water towards apressure drawdown, reducing or stopping the water will reduce or stop oil production. If there is noway of removing the water from around the wellbore then there is no method to flow oil toward the wellas long as the water is there.17-8
Shallow Modification - Increasing PermeabilityMost matrix methods (nonfracturing) of increasing permeability in reservoir rock are very shallow penetrating.Fortunately, very shallow damage removal can boost production or injection enormously <strong>and</strong>even increases of undamaged permeability can boost production or injection several percent.Removal of damage is the most important item in consideration of methods of improving production orinjection with an inexpensive near wellbore treatment. Improving initial matrix permeability with acid orother chemical methods can assist in a small way, but most matrix methods are limited to a few feet ofpenetration at the very most. By examination of flow capacity increase available by the beds-in-seriesmodification of Darcy law, it can be demonstrated that the maximum increase available is only a fewpercent.Very small, carefully controlled fracture treatments are also useful in improving near wellbore permeability.The “short, fat fracs” of a few thous<strong>and</strong> gallons of fluid <strong>and</strong> several thous<strong>and</strong> pounds of proppantare very useful for improving flow. In limestones, acid breakdowns are a st<strong>and</strong>ard in treating <strong>and</strong>retreating both injection <strong>and</strong> production wells, both from a cleanout <strong>and</strong> stimulation viewpoint.<strong>References</strong>1. Endean H. J., Shelton, R. D.: “Water lnitiaied Problems in Production Operations,” ChampionTechnologies, Inc., Houston, Texas, 1991.2. Richardson, J. G., Sangree, J. B. <strong>and</strong> Sneider, R. M.: ‘Coning,” Technology Today Series, Journalof <strong>Petroleum</strong> Technology, (August 1987), pp. 883-884.3. Sparlin, Derry D. <strong>and</strong> Hagen, Raymond W. Jr.: “Controlling Water in Producing Operations,”World <strong>Oil</strong>, (April 1984), pp. 77-86.4. Woods, E. G. <strong>and</strong> Khurana, A. K.: “Pseudo-functions for Water Coning in a 3-0 Reservoir Simulator,”SPE 5525.5. Wheatley, M. J.: “An Approximate Theory of <strong>Oil</strong>NVater Coning,” SPE 1421 0.6. Giger, F. M.: “Analytic 2-D Models of Water Cresting Before Breakthrough for Horizontal Wells,”SPE 15378.7. Chaperone, I.: “Theoretical Study of Coning Toward Horizontal <strong>and</strong> Vertical Wells in AnisotropicFormations: Subcritical <strong>and</strong> Critical Rates,” SPE 15377, 1986 SPE Annual Mtg. New Orleans,OCt 5-8.8. Karp, J. C., Lowe, D. K., Marusov, N.: “Horizontal Barriers for Controlling Water Coning,” J. Pet.Tech., (July 1962).9. Patton, L. Douglas: “Optimize Production Through Balanced Reservoir Depletion,” Part 4--1njection<strong>and</strong> Water Influx Monitoring, <strong>Petroleum</strong> Engineer International, (March 1989), pp. 28-30.10. Sparlin, Derry D. <strong>and</strong> Hagen, Raymond W. Jr.: “Controlling Water in Producing Operations,” Part4-Grouting Materials <strong>and</strong> Techniques, World <strong>Oil</strong>, (June 1984), pp. 149-1 52.11. Jurinak, J. J., Summers, L. E. <strong>and</strong> Bennett, K. E.: “<strong>Oil</strong>field Application of Colloidal Silica Gel,”SPE 18505, pp. 425-454.17-9
12. Smith, L. R., Fast, C. R. <strong>and</strong> Wagner, 0. R.: “Development <strong>and</strong> Field Testing of Large VolumeRemedial Treatments for Gross Water Channeling,” Journal of <strong>Petroleum</strong> Technology, (August1969), pp. 101 5-1 025.13. Dietz, et al.: “Foam Drive Seldom Meaningful,” JPT, May 1985, pp. 921 -922.14. Strickl<strong>and</strong>, Richard F.: “Artificial Barriers May Control Water Coning-1 ,I’ The <strong>Oil</strong> <strong>and</strong> <strong>Gas</strong> Journal,(October 7, 1974), pp. 61-64.15. Carroll, J. F. <strong>and</strong> Bullen, B.: “Successful Water Control Examples in Gulf of Mexico GravelPacked <strong>Gas</strong> Completions,” SPE 18228, pp. 495-501.16. Burkholder, L. A. <strong>and</strong> Withington, K. C.: “New Gel Suppresses Water Flow in <strong>Oil</strong> Wells,” <strong>Oil</strong> <strong>and</strong><strong>Gas</strong> Journal, (September 1987), pp. 93-98.17. Hess, Patrick H., Clark, C. O., Haskin, C. A. <strong>and</strong> Hull, T. R.: “Chemical Method for FormationPlugging,” Journal of <strong>Petroleum</strong> Technology, (May 1971), pp. 559-564, 153, 63-66.18. Chan, Keng Seng: “Injection Profile Modification With a New Non-Polymer Gelling System,”<strong>Petroleum</strong> Society of CIM, Paper No. 89-40-46, pp. 46-1 -46-1 4.19. Rike, J. L.: “Obtaining Successful Squeeze - Cementing results,” SPE 4608, Las Vegas, Nev.,Sept. 30-Oct. 3, 1973.20. Chan, K. S.: “Water Control Diagnostic Plots,” SPE 30775, Dallas, Oct. 22-25, 1995.17-10
Chapter 18: Wireline <strong>and</strong> Coiled Tubing OperationsWireline <strong>and</strong> coiled tubing are basic conveyance tools used in the workover <strong>and</strong> completion of wells.The following information will help explain the operation of each.Wireline OperationsThe use of wireline in downhole oilfield operations began with cable tool rigs in the early days of theoil industry. The wireline on the rig was used to drill (with the cable tool assemblies) <strong>and</strong> to also place<strong>and</strong> retrieve other simple tools. Downhole tools began developing in the 1930s with the advent of thefirst wireline replaced gas lift valve. Twenty years later, dual completions became popular <strong>and</strong> a multitudeof tools were developed for use in wireline operations.In the early 1950s, wireline retrievable gas lift valves became widely accepted. Other equipmentdeveloped in this era included the wireline operated sliding sleeve, ‘elective crossovers, <strong>and</strong> a multitudeof tools <strong>and</strong> jars for fishing operations. At the same time, hydraulically powered wireline reelswere developed, increasing the possibilities of wireline workovers. Wirelines are popular because oftheir versatility, <strong>and</strong> their quick setup <strong>and</strong> running time.There are three types of wireline currently in operation: slickline (a single-str<strong>and</strong> piano wire), braidedline, <strong>and</strong> braided lines with insulated electrical conductors (electric logging line).As shown in the following data, wireline strength depends on thickness, All these specifications are for“bright plow steel” wire. Other wires such as stainless, monel <strong>and</strong> specialty alloys are available.The most popular slick lines have diameters of 0.092 <strong>and</strong> 0.1 08 in.’ The 0.1 08 line is stronger but ismore affected by wellhead pressure. The wellhead pressure creates an upward force or a resistancethat acts on the cross-section of the wireline. Added weights or sinker bars are necessary for increasingwireline diameters <strong>and</strong> increasing well pressure. Because of the added weight needed to make thetools drop into the well, higher working loads are imposed on the wireline. Assignment of a safe workingload may range from the 75% shown in the previous data to 50% depending on the service company,the type of job <strong>and</strong> general well <strong>and</strong> service unit conditions.* Failure to determine the right sizeof wire for the job often results inthe use of oversized lines <strong>and</strong> added expense for a large derrick tosupport the pulley.When diameters larger than 0.1 08 in. are necessary, a braided line is commonly used. Various sizesof the braided wireline are available, with the most common sizes being 1/8 in., 9/64 in. <strong>and</strong> 3/16 in.When multiple electrical conduction or electrical manipulation of tools is required, logging lines with adiameter of 3/16 in. or greater are used. Increasing the size of the wire increases the need for largersurface equipment, <strong>and</strong> this increases the cost.Entry of the wireline into the well becomes complex because the well pressure <strong>and</strong> flow must be controlledat the point of wire entry <strong>and</strong> the wireline must have as little friction as possible entering the18-1
well in order for the weight bars, called wireline stems, to be minimized. (The weight of the stem pullsthe wire into the well, working against the pressure that is trying to push the wire out of the well.)Surface equipment for wireline work will vary with the conditions of operation <strong>and</strong> the requirements forthe job. Normal items on location include a wireline reel <strong>and</strong> power unit (the reels are hydraulicallydriven), a depth measuring device, a weight indicator to indicate weight felt at the spool, a wire lineBOP <strong>and</strong> a set of pulleys <strong>and</strong> a mast unit to provide a vertical approach into the well. The BOP or blowout preventer <strong>and</strong> a lubricator are necessary when operations are done under pre~sure.~ A simpleschematic of the surface equipment is shown in Figure 18.1. The weight necessary to assure the wirelineentry in the well is a function of the pressure in the well <strong>and</strong> the size of the wireline. As can beseen by the data in Figure 18.2, the small slick lines of 0.092 in. <strong>and</strong> less require very little weight toachieve entry, while the larger lines increase very rapidly in weight requirements for well entry.2Figure 18.1: A schematic of a wireline layout.Sealing the wireline connection at the top of the lubricator requires a low friction seal such as a greasebarrier or other dynamic liquid seal. These special control heads maintain the final barrier to well pressure<strong>and</strong> must be well maintained.2b Using excessive grease in the seal can produce formation damageor hydrocarbon contamination of the area around the well head.Line breakage is usually avoided by the use of an accurate weight indicator <strong>and</strong> adequate inspection<strong>and</strong> safety factors on the line itself. Line breakage is usually caused by corrosion of the wire in a hostilewell environment. Because of the large surface area to mass ratio of the wire, corrosion occursvery quickly; often in a matter of minutes when the wrong line is used in a corrosive application. Specialcompositions of slick line <strong>and</strong> braided line are available as well as inhibitors to control the corrosion.Corrosion of wirelines is a serious problem that usually involves stress corrosion cracking,especially in sour gas wells. Failures of several types of stainless (304, 31 6, 18-1 8-2) have beenreported along with some failures of duplex stainless wires4 In general, the higher nickel content, thegreater its resistance to failure in sour (hydrogen sulfide) wells.Downhole Wireline EquipmentWireline tools are usually simple devices that are engaged, disengaged or perform some function byvertical movement of the wireline. The connection point of the wireline to the tool begins at the ropesocket, Figure 18.3. The wire passes through a "fishing neck" <strong>and</strong> into a cavity where it is secured by18-2
WELL MEUUIE P3.I.DTEt UMER BAR WEWT WVE* IS I T BALNICI WWT. ADD VEWl U DESIRED TO WTAINW A R D MIYII.(Bielstein)Figure 18.2: Sinker bar weight needed to balance pressure <strong>and</strong>friction. Line weight has been disregarded.circling a spool <strong>and</strong> then wrapping around itself. Special rope sockets are used for the 0.092 <strong>and</strong>smaller lines. A wedge neck, Figure 18.3, is used for the 0.1 08 line <strong>and</strong> for the multi-str<strong>and</strong> wires. Thefishing neck is simply a device that allows an overshot (a catch tool) to slip over the neck <strong>and</strong> lock inthe recess area. The fishing neck is a part of almost all downhole tools.HOUSINOCLAMPSCREWSBOXFigure 18.3:SINOLE STRANDROPE SOCKETUVLTI-STRANDROPE SOCKET(Cameo)Three examples of a rope socket. A regular wireline rope socket is atleft. At center is a socket for 0.108" wire. At right is a unit for braidedline.Because straight pull capacity with wireline is relatively low (limited by the strength of the wireline), amethod is needed to amplify the pull without increasing the size of the wire. Tools called jars fulfil1 thisneed. The normal jar device is a spang jar, Figure 18.4. This tool is essentially a slide hammer thatlets the wireline accelerate before the ends of the jars engage. The jarring action produced by thesesmall tools is intense <strong>and</strong> can often free a stuck object where a straight pull would fail. Placement of a18-3
wireline stem (weight) immediately above the jar increases the effect of the jars (like using a largerhammer). Various jar types are available but spang jars are the most common.c-- WIREROPESOCKETnWIEUNESTEMMECHANICALJARSKWCKLEJOM(Carnco)Figure 18.4: A schematic of spang jars.Various tools are run below the jars to set <strong>and</strong> retrieve plugs, operate sliding sleeves or to fish for lostobjects. Running tools, Figure 18.5, <strong>and</strong> pulling tools, Figure 18.6, are to set <strong>and</strong> retrieve plugs. Therunning tool is usually equipped with shearable set screws or clips (called dogs) that hold the plug inplace until it is set <strong>and</strong> the running tool is jarred off. Pulling tools use dogs that clip around the fishingneck of the plug. Once the dogs are engaged, the equipment is jarred upward to pull the plug.Bailers are hollow body chambers that can be used to carry cement into a well or retrieve samples ordebris from a well. These wireline conveyed tools, Figure 18.7, have a variety of triggering devicesthat cause the contents of the bailer to dump or the bailer to open to receive the fluid of slurry or materialaround it. Bailers are small volume but their ease <strong>and</strong> speed of running makes them a favorite tospot fluids <strong>and</strong> retrieve samples.Wireline can also be a powerful diagnostic tool. The bailers can recover samples of debris <strong>and</strong> fluids,<strong>and</strong> impression blocks can locate <strong>and</strong> give an imprint of debris of equipment in the hole. A blind box,Figure 18.8, is run when the top of equipment is to be located or to “tag” the top of fill. The large sizeof the block (relative to the tubing) keeps it from sliding past anything in the tubing. The impressionblock, Figure 18.9, is like a blind box but has soft lead molded into the bottom of the box. By settingdown on the equipment that is in the well, an impression can be made of the top of the equipment. It isuseful to make prints of fishing neck tops <strong>and</strong> of parted tubing, prior to fishing.One of the more common jobs for a slick line unit is replacing gas lift valves. This sequence of operationsis shown in detail in Figures 18.10 (running) <strong>and</strong> Figure 18.11 (retrieval). The drawings <strong>and</strong> writtenprocedures are part of a Camco training manual on wireline operations.Running speeds for the wire line depends on hole condition <strong>and</strong> size, the type of tools being run <strong>and</strong>the familiarity of the operator with the well. Normal running speeds vary from less than 100 Wminuteup to 1000 Wminute. As the tool string nears restrictions such as nipples, the line speed is reduced toa few feet per minute.18-4
PIN THREADS41uR PINS(Carnco)Figure 18.5: One type of running tool that usesshear pins. The pins are sheared afterthe tool has been set.CORE SPRINGSRFAR PWDOG SPRINGPlryLsDoCSSKIRT(Carnco)Figure 18.6: One type of retrieving tool. Note theclip-on face of the “dogs”.18-5
(White et al., SPE 24574)Figure 18.7: Wireline run bailers.WRENCH FLATS(Carnco)Figure 18.8: A blind box. Usually run to tag bottom.Pressure <strong>and</strong> Fluid ControlPlugs (called m<strong>and</strong>rels) can be wireline-set in the tubing to control pressure or flow. The places thatthe plugs seat <strong>and</strong> seal are special equipment called nipples. The nipple often has a special diameteror a combination of grooves (called a profile) that will only accept one type of plug. A number of nipples<strong>and</strong> profiles are shown in the drawings of Figure 18.12. In wells using multiple nipple installations,each nipple may be designed to receive a particular m<strong>and</strong>rel or all nipples may be of the samedesign <strong>and</strong> the m<strong>and</strong>rel manipulated so as to lock in the appropriate nipple. In the first case, the nippleis said to be profile sensitive, <strong>and</strong> in the second case, the m<strong>and</strong>rel is profile sensitive. A pressuretight seal is provided by a packing element on the plug <strong>and</strong> a polished bore in the nipple.5 Thus, severalnipples may be placed at different points in a string <strong>and</strong>, by selecting the right plug, the operatorcan be very selective about where the plug is set.18-6
PIN THREADUPISHING NECKRENCH FLATSTEEL HOUSING1 ~Z~+STEE' RETAINER PINS(Camco)Figure 18.9: A sketch of an impression block. The bottomis smooth, soft lead.PIN mEAD UPFISHING NECKBY PASS SLOTSWITER EDQE(Carnco)Figure 18.10: Gauge ring or paraffin cutter.One disadvantage of a nipple is that it is a likely place for formation of scale or paraffin. If the profilegrooves are blocked by any type of deposit, the m<strong>and</strong>rel cannot be set.Other functions of plugs are as vents, chokes, check valves, <strong>and</strong> flow diverters in injection wells. Thenipples may be solid wall or have ports to allow circulation when the plug is pulled. Other wireline-runpressure control tools include sliding sleeves <strong>and</strong> a variety of fishing took2 Sleeves allow opening<strong>and</strong> closing of a side entry port in the tubing, allowing entry of liquid or gas to unload strings or staticliquid from another zone?Because of the problem of unlatching plugs that are holding pressure, relief ports are provided toequalize pressure. Pressure equalizing must be done before unseating the plug to avoid blowing the18-7
(Carnco)Figure 18.11: Swedge (above) <strong>and</strong> abroach (right) used forreshaping restricted tubing.(Baker)Figure 18.12: Typical profile <strong>and</strong> two of the many plugs thatcan be set to control, reroute, restrict, or completelystop flow.plug <strong>and</strong> line up the hole. The force of pressure on a plug is calculated with the same equation used tocalculate force on a packer or closed end tube:18-8
FApAF = APXA= force on a plug, Ib= differential pressure on the plug, psi= the area of the plug, in. 2For a 1-7/8 in. plug, set in a 2-318 in. nipple with a pressure differential of 2500 psi, the force on theplug would beF = (2500) (2.76 h2) = 6902 lbIf the pressure is trapped below the plug, suddenly unseating the plug would likely blow the plug upthe tubing, causing problems with slack wireline (bird nests). Pressure equalizing features help preventthis type of problem.Special ServicesWireline can also be used to cut-out paraffin <strong>and</strong> asphaltene deposits, to set packers, <strong>and</strong> for a varietyof other services. The advantages of this inexpensive tool is sufficient for many offshore platforms tohave a wireline unit as part of the routine equipment.Tools for Downhole MeasurementsInstruments for running well analysis are run <strong>and</strong> retrieved with wireline. These instruments mayrecord subsurface pressure, temperature, flow rate, <strong>and</strong> the type of fluid flow. They may also be usedto sample fluid at the bottom of the well under static or flowing conditions. Other wireline tools includemechanical <strong>and</strong> sonic calipers to determine erosion or corrosion condition of the casing. As previouslyillustrated in the section on diagnostics, a variety of data recording tools are available for wirelineoperation. Because an electrical signal is often necessary, many of these tools are run on electric loggingline.Coil Tubing OperationsCoil tubing represents one of the biggest advances in well control <strong>and</strong> fluid spotting technology to bedeveloped in the last 30 years. Coiled tubing is a continuous string of steel tubing wound on a verylarge diameter spool that can be run into a well without the necessity of making joint conne~tions.~~~~~Coiled tubing may be used for almost all aspects of workover operations including some wireline dominatedwork. Coiled tubing may be used in initiating or controlling flow,10 jetting out s<strong>and</strong> or fill in tubingor small diameter casing, drilling, packing off <strong>and</strong> isolating sections,ll performing stimulationoperations,12 running logging too1~,~~*~~conveying perforating ~ystems’~ <strong>and</strong> operations in horizontalholes.16The size of the coiled tubing may range in size from 1 in. (25 mm) to 3-1/2 in. (89 mm) or larger. It isrun into the well using an injector head as shown in Figure 18.1 3. Blowout preventers <strong>and</strong> other pressurecontrol equipment are available for the tubing. Coiled tubing offers many advantages over jointedtubing in concentric operations that may range from economics to additional safety. Reduction in rigtime can be an advantage. Rig up of the equipment is approximately 1 hour <strong>and</strong> trip time (compared tojointed tubing) is reduced because the tubing may be run at rates to 200 Wminute <strong>and</strong> pulled at therate of several hundred feet per minute, whereas 60 Wminute is a common speed for pulling jointedtubing. The absence of joints in the tubing eliminates many potential leaks <strong>and</strong> some corrosion.Coiled tubing was first used in well stimulation <strong>and</strong> damage removal for accurate spotting of gas <strong>and</strong>liquids. Introduction of packers <strong>and</strong> plug assemblies for the coiled tubing has made selective break18-9
Coi 1 ed tubing e e n e c kChainSkate ramsB1 ind ramsB1 owoutPreventersWe1 1 headFigure 18.13: Chain drive injector for coiled tubing.down operations much easier <strong>and</strong> faster. Other tools have been developed for sleeve operation, spottingfluids, jet washing <strong>and</strong> other functions.Chain InjectorThe injection head, Figure 18.1 4, is the heart of the drive system for coiled tubing operations. Theinjector head is a mechanical apparatus usually driven by chains <strong>and</strong> powered by hydraulic motors. Itprovides the reaction force <strong>and</strong> the stability necessary for removal or insertion of the continuous tubinginto or from a well. The injector provides all of the h<strong>and</strong>ling capabilities through a friction drive system.It controls the rate at which tubing is lowered into the well <strong>and</strong> acts as both slip <strong>and</strong> brake to spotthe tubing at any desired depth. In rare instances, it may be used to part the tubing string (althoughbetter methods may be available).The injector head consists of several individual components.1. Most gripper blocks grip the tubing without causing significant damage. This block assemblymay be either grooved blocks (Figure 18.15) or a block for multiple sizes of tubing, such as thedeep V block, Figure 18.1 6. The blocks in the smaller size tubing are grooved to increase grippingefficiency.The forces on the set of gripper blocks are as shown in Figure 18.17.F= pLN<strong>and</strong> the summation of vertical forces issubstituting ,p, the coefficient of friction is taken as 0.25.ZF = 2F- W or F = 1/2WW1/2W= pNor N= -2P18-10
Figure 18.14: Coiled Tubing Injector System[Drawing from Halliburton]Figure 18.15: Grooved Gripper Blocks for CoiledTubingIf 8200 f (2500 m) of 1.5 in. (38.1 mm) coiled tubing (0.109 in. or 2.77 m wall), is in the well18-11
Figure 18.16: Deep V Design Gripper Block forH<strong>and</strong>ling Multiple Sizes of CoiledTubingW = String Weight, IbsN = Normal Force (Force Imparted byBeam Pressure), psip = Coefficient of Friction BetweenGripper Block <strong>and</strong> TubingF = Frictional Force (Holding Force), psiCOILED TUBING~10.2~1 n-0.25-NGRIPPER BLOCKIWFigure 18.17: Gripper Block Forces[Drawing from Halliburton](open-ended, no buoyancy correction), the string weight is 13,276 Ib (6035 kg) <strong>and</strong> the force, N,that must be applied to the grippers to hold the string in place is:N=-= 13276 lb = 26,550 lb (12,070 kg)2p 2(0.25)18-12
2. A linear beam <strong>and</strong> hydraulic cylinder arrangement provides uniform force on the back side of thegripper chain <strong>and</strong> forces the grippers together. The hydraulic pressure applied to the gripperblocks to produce the force N would be a function of the cylinder size. If a 50.9 in. cylinder area(Halliburton 30,000 psi injector, for example) was used, then the hydraulic pressure would be:F 26550psip=z‘ 50.9 in.2The gripper blocks must be treated as a set since the load producing hydraulic cylinders workon all the grippers in contact with the tube. To apply the maximum force of the injector head, acertain minimum number of grippers, or minimum gripper block length is needed. This minimumlength will change as tubing size <strong>and</strong> wall thickness change. In general, more gripper length isneeded for thinner wall tubing of the same OD <strong>and</strong> more gripper length is needed for increasingtube ODs with the same wall thickness.The string weight is not the only weight or force factor involved on the coiled tubing. Surfacewellhead pressure opposes movement of tubing into a well <strong>and</strong> the pressure sealing strippercreates a frictional force that must be overcome to move pipe either direction. Figure 18.1 8shows the opposing or compressive forces for 1 in. through 2 in. coiled tubing for a range ofwellhead pressures. The data in Figure 18.1 9 is to offset wellhead pressure only. The simpleequation is:Force = Wellhead Pressure x Area of closed end tubing or, for a wellhead pressure of 5000 psi1.5 in. tubing (Area = 1.767 in.2) requires a downward force (from the injector head) of5000 psi x 1.767 in..2 = 8835 Ib, to push the first part of the tubing into the wall.Figure 18.18: Axial Compressive Force on CT Due to WHP[Newman & Allcorn, SPE 247931If the stuffing box (or the stripping element in the BOP if closed around the tubing) adds a frictionalforce, for example, 2000 Ib, it must be added to the force the injector must provide tohave the tubing enter the well.8835 + 2000 = 10,835 Ib (force downward)As tubing is injected, the weight of the tubing below the injector helps pull the tubing into thewell. The downward force that the injector must provide steadily decreases as more tubing is18-13
un in the well. The downward force (snubbing) requirement turns to an upward force (stripping)requirement when the weight of tubing (plus inside fluids) exceeds the frictional <strong>and</strong> pressureforces acting on the CT during operation (running). For this example of 5000 psi surface pressure<strong>and</strong> 2,000 psi friction in the stuffing box, the breakover (snubbing to stripping force) forempty 1.5 in., 0.109 in. wall, 1.619 Ib/ft, would be:in gas (dry coiled tubing)l09 835 lb = 66921.619 lb/ftIn the unusual case of inserting dry tubing in a well full of 9 Ib/gal liquid: the buoyed weight, Wb,would be (ignoring gas weight in CT):Wb = W,[l+]where:W,pf= air weight of tube= density of fluid in the wellps = density of steel = 489.5 Ib/ft3 or 65.4 Ib/gal or 7.84 kg/lThe buoyed weight reduces the weight helping to pull the tubing into the well. The tubing weightbecomes:W, = 1.619 (/b/ft)[ 1 -65.4 lb/gd lb/gal ] = 1.4 lb/ftThe breakover point from snubbing to stripping is increased to:10,835 lb = 77391.4 lb/ftIn most cases, fluid is injected as the coiled tubing is run in a well. The injection helps equalizepressures (lessens chances of tubing collapse). The fluid adds to the weight of the tubing basedon the volume of the coiled tubing.For circulation of 9 Ib/gal brine through the example 1.5 in. coiled tubing (id = 1.291) in a wellfilled with 9 Ib/gal brine:Wt. brine in tubing = E ( 1.291/12)2[ ft2) (1 ft)4(9 lb/gal) (7.48 gal/ft3)= 0.612 lb/ft18-14
This is weight added (per foot) by filling with brine. The net weight per foot would be:1.4 Ib/ft + 0.612 Ib/ft = 2.012 Ib/ftor, the CT length to offset the 10,850 Ib force <strong>and</strong> begin stripping would be:'7 835 lb 5385 ft2012 lb/ftFor the sake of the force example, if the tubing were run to 5385 ft in the 9 Ib/gal brine filled well<strong>and</strong> the circulating fluid was switched from 9 Ib/gal brine to 16.4 Ib/gal cement, the forcerequired from the injector to hold the tubing would go from about 0 (balanced upward <strong>and</strong> downwardforces) to:x - (1.291112) (1 ft) (16.4 lb/gal) (7.48 gal/ft3)4= 1.12 lb/ftNet wt. = 1.4 lb/ft + 1.12 lb/ft = 2.52 lb/ftForce increase = (5, 385 ft) (2.52 lb/ft)-10,835 lb = 2,735 lbAs seen in the examples, the force needs will vary with well pressure, coiled tubing dimensions,circulating fluid <strong>and</strong> well fluid densities. Frictional forces created by the flowing fluids (ignoredhere) could also change the force loadings.When the injector head opposes a large wellhead pressure, the coiled tubing section immediatelybelow the injector head may have a tendency to buckle as shown in Figure 18.1 9. A bucklingguide or brace in this area cuts down the amount of unsupported tube <strong>and</strong> reduces thetendency to buckle, Figure 18.20.4Newman <strong>and</strong> Allcorn estimate the injector force to start buckling in the unsupported area justbelow the injector head is 3,000 Ibf for 1 .O in. CT, 6000 Ibf for 1.25 in. CT <strong>and</strong> 12,000 Ibf for1.5 in. CT. The larger sizes of coiled tubing are stiffer <strong>and</strong> more easily resist this surface buckling,however; the pressure acting on the tubing when the tubing is started into a high pressurewell offsets this advantage. For a well with 5000 psi surface pressure, the pressure effectopposing 1 in. tubing is 3926 Ib; for 1-1/2 in. tubing it is 8836 Ib; for 2-3/8 in. tubing, it is22,150 Ib; <strong>and</strong> for 3-1/2 in. tubing it is 48,105 Ib. Clearly, the buckling below the injector can bea severe problem any time there is high wellhead pressure. Buckling prevention supportsshould be run in any unsupported area below the injector <strong>and</strong> above the stuffing box.3. The injector system is fail safe for movement control. Valves on either side of the relief portsclose automatically when hydraulic pressure is released (due to a breakdown or other problem).In this event, the systems close, <strong>and</strong> the chain stays wherever it was at the point of failure. Thisholds the tubing until the problem can be corrected.18-15
n nUFigure 18.19[Newman 8 Allcorn, SPE 247931nnFigure 18.20[Newman & Allcorn, SPE 247931The hydraulic components <strong>and</strong> the roller chain are shown in Figure 18.21. Examples from Halliburtonshow a low pressure system (38,000 psi) <strong>and</strong> a high pressure system (80,000 psi).The weight indicator measures the coiled tubing hanging weight or the weight supported by the injectorhead. The reel produces an upward force (tension), reducing the reading on the weight indicator. Ifthere is an upward force created by the wellhead pressure (especially when only a small amount oftubing is in the well), a one directional weight indicator would become inactive. For this reason, a dualacting weight indicator-one that measures force in both directions-is recommended.The guide arch or goose neck (Figure 18.22) sits above the chain injector head <strong>and</strong> guides the tubingas it is unrolled from the reel into the injector head. The coiled tubing guide or goose neck is a curvedbeam with a series of rollers which prevent crimping of the tube as it moves from a straight sectionthrough a curve <strong>and</strong> into another straight section. The size of the goose neck will depend on the18-16
Twin hydraulicradial piston motorswith integralf ailsafe brakingLoad ’ Tubingcell guideFigure 18.21: Components of the Injector Headradius of tubing. Both 72 in. radius <strong>and</strong> 96 in. radius goose necks are common, with the 96 in. gooseneck being used for the larger diameters of tubing.Figure 18.22 Tubing Guide or “Gooseneck”The gooseneck or guidearch radius is very important since twice as many bending cycles occur hereas at the reel. Jhe tentative API specification recommends that the arch radius be at least 33 t imeslhe coiled t&)mmeter.Because there is increasing use of tools in the coiled tubing string, attachment to the string becomesa major point of concern. Since many tools are larger than the coiled tubing, they cannot pass throughthe chain injector. The tools therefore must be attached beneath the injector. The use of an “access”window, Figure 18.23, is common where there is a need to add most tools.There are six requirements for adding larger diameter tools to the string.18-17
Loz.VALVECoLmTWlNaMaR OOWLCT CONNECTORQAS UPT YANDRaCT CONNECTORFigure 18.23: Use of Access Window for CouplingEquipment in a CT String[Moore, World <strong>Oil</strong>, CT Symposium, 199411. An access window large enough to mount all equipment to be used in the string, accessible withthe tools to do the job. (Remember coupling length in the total tool length.)2. An injector head above the window to hold <strong>and</strong> feed the tubing once the connection is made.3. A valve or plug at the bottom of the CT to control backflow.18-18
4. Slip <strong>and</strong> seal capacity in the BOPs below the window to hold the tubing hanging in the well priorto cutting the tubing <strong>and</strong> to seal wellbore pressure.5. A stripping/snubbing BOP setup that is long enough to snub the mounted tools into the well withoutloss of well control. The bore of the BOP must be large enough to pass the full diameter ofthe tool mounted in the string.6. Backup plates around the coiled tubing in the window are required to prevent buckling whilecoiled tubing is being run into the well. The backup devices are needed when injection loadplaces the tubing in compression. Compression usually exists when tubing is started into a wellwith a high surface pressure or anytime drag forces or friction forces opposing the injection ofthe tubing exceed the downward string weight.Connection of the tools or equipment in the coiled tubing string may be made by welding, threadedcoupling, or various types of compression fit or dimple couplers. The most common tools added to thestring in the window include seal assemblies, packers, subsurface safety valves, gas lift valves, m<strong>and</strong>rels<strong>and</strong> nipples of all types, <strong>and</strong> hanger heads similar to the one described in the section on coil tubingfor production tubing.Below the access window <strong>and</strong> chain injector head, a coiled tubing stuffing box, Figure 18.24, providesa sealing connection before the tubing goes into the well. The units are usually spring loaded <strong>and</strong>closed with hydraulic pressure. By applying hydraulic pressure, the operator is able to compress arubber packoff element <strong>and</strong> strip in or out of the hole under pressure. Replacement of the rubber elementcan be achieved in most tool designs by unscrewing the top <strong>and</strong> inserting a split element.PackingNutEnerglringRubberSttipplngRubberPlstonWellPressureportFigure 18.24: Cutaway of a Stuffing BoxImmediately below the stuffing box, the blowout preventers are positioned. These connect to the wellhead<strong>and</strong> provide the emergency control for the well. The typical BOP is a 4 RAM unit, which ishydraulically operated <strong>and</strong> can be manually closed. From top down, the BOPs are:1. Blind RAM2. Tubing shear RAMS18-19
~~ ~ ~~ ~3. Slip RAMs4. Tubing (pipe) RAMsBlind rams are designed to isolate pressure between the well <strong>and</strong> the surface. They work only whenthe BOP bore is empty. Their mostly flat seal faces form a seal when opposing blind rams contacteach other. A pressure bypass to equalize pressure above <strong>and</strong> below the ram is required. The pressurebypass is required on any valve, plug or seal where opening against well pressure would damageequipment. An equalizing valve is needed across all rams that have the ability to seal pressure: blind,pipe <strong>and</strong> some shear rams.Shear rams must have the capability of shearing the heaviest wall <strong>and</strong> highest yield strength of coiledtubing at the highest possible wellhead pressure. The shear blades need to cut cleanly without crushingthe tube. Shear rams must also work against maximum expected well pressure, as shown inFigure 18.25.rPressureI:RequiredWall to ShearThickness 0 psi(in.) (in.) WHPI-,I 1.500.1 090.1340.1 090.1 34150024001900Pressure PressureRequired Requiredto Shear to Shear5000 psi 10,000 psiWHP WHP2056 261 12.956 351 12.456 30110.125 I 2100 I 2656 I 3211 I2750 I 3306 3861I I I IFigure 18.25:8( 3 lP Hydraulic System Pressure Required to Shear CT for a Typical 3[Newman & Allcorn, SPE 247931Slip rams support the weight of the pipe when needed. They must be capable of holding the maximumweight expected without crushing the tube. Like all slips, holding heavy loads is more difficult whenthe slips are engaged on hard steel such as P-110 or V-150.Pipe rams seal around the tubing. They are always placed in the bottom cavity of a workover BOP.Pipe rams are often provided in duplicate for safety <strong>and</strong> stripping.Most BOPs are provided with a side outlet between the shear <strong>and</strong> the slip RAM, to allow returns orpumping into the annulus, if necessary. A schematic of the RAM setup is shown in Figure 18.26. If thecoiled tubing is to be stripped through the stripping ram <strong>and</strong> high wear or hazardous service isexpected, dual strippers (or even multiple sets) may be used. The top stripper would be the continuousoperations unit with the lower unit available for sealing while changing worn elements in the upperunit.Closing the rams must take into account the opposing wellbore pressures. If the construction of theBOP is such that the hydraulic closing pressure works against the hydraulic piston diameter while thewellhead pressure works against the connecting rod diameter, then the rod diameter effect must beaccounted for. In the event of a hydraulic supply system failure, accumulators are used to operate theBOP system. The accumulators should be sized to deliver sufficient fluid to perform all BOP functions,at the necessary pressures, for all four ram sets plus a 1.5~ reserve. The closing ratio is:18-20
Pressure port/ Blind-RamBlind RamsSide Port(Kill Port)Shear RamsSlip RamsPipe RamsPipe-Ram EqualizingValve6Hydraulic Actuatorwith Ram Position indicatorFigure 18.26: Minimum BOP Setup[Newrnan & Allcorn, SPE 247931where:RDd= closing ratio= diameter of hydraulic piston= diameter of connecting rod.The minimum BOP stack in Figure 18.26 can be improved, both in versatility <strong>and</strong> safety by addition ofa circulation Tee or a cross below the main BOP quad stack. If a Tee or a cross is used, however, youneed to run a pipe ram below in case there is a problem with a valve in the line during any well controloperation. This type of BOP arrangement, Figure 18.27, is required by some companies <strong>and</strong> is highlyrecommended. There is a caution, however, with closing the bottom pipe ram; it should only be donewhen there is no other way to control the well. Once closed, pressure will rise <strong>and</strong> may create problemsin control. A better method of control when using a circulating cross is to set up a valvesequence such as Figure 18.28. In most cases, operations economics will not support developingboth sides unless the flow is corrosive, poisonous, erosive or in a sensitive (politically or environmentally)area. At the least, when using a circulating cross, develop one side for control <strong>and</strong> place at leastone valve on the other side so that the unused side can be developed quickly if needed.Head space limitations must be checked before specifying the BOP system on the well. Head space ismost critical on platforms with very limited space between wellheads <strong>and</strong> upper decks.The API recommends tests on well control equipment as:1. Upon installation.2. At least once every seven days when installed.3. Following any action that requires disconnecting a pressure seal in a well control component.4. Prior to well testing operations.A low pressure test to 200 or 300 psi usually precedes the high pressure test. Test time at the high pressurerequires a hold time of 10 minutes. The maximum test pressure is usually 70% of working pressureunless the working pressure is far above the maximum pressure of the well. The minimum pressure is themaximum pressure of the well.18-21
PipelSlip Combo RamFigure 18.27: An Improved System for CT Use Incorporating aCirculating Tee <strong>and</strong> a Lower Pipe RamSt<strong>and</strong>ard CT BOPUnused Side + +To ChokeReady forDevelopmentif NeededCirculatina -CrossL PlpdSllp Comblnatlon RamFigure 18.28: Coiled Tubing SOP <strong>and</strong> Circulating ControlSetup for High Pressure or Dangerous WellsIn high pressure or severely corrosive wells, two strippers above an annular well control component maybe set above the st<strong>and</strong>ard quad BOP.When assembling pressure control equipment, ring gaskets should not be reused.The reel assembly, Figure 18.29, is a large diameter steel drum that is shaft mounted <strong>and</strong> is poweredby a bidirectional hydraulic motor. The drive system powering the reel must be able to take up tubingfaster, regardless of amount of tubing on the spool, than the maximum speed of the injector head. Thereel drive must supply enough torque at maximum injector head speed to bend the tubing around thegoose neck.A device called a levelwind is used to smoothly space the coiled tubing on <strong>and</strong> off the reel.18-22
Figure 18.29: Skid Mounted Reel.Even though the coiled tubing is spooled on a large reel or drum, the tubing still yields. For any gradeof tubing, the bend radius that will produce yielding iswhere:R = €(D/2)/SyR = bend radius, ftE = plastic modulus, 30 x 1 O6D = tubing diameter, in.Sy = yield strengthThe yield producing bending radii for several sizes are shown in Figure 18.30.(in.)1 .oo2.00 362.37542Figure 18.3018-23
Coiled TubingSpecified OD(inches)0.751 .oo1.25Size Range Size RangeRadius Reel Core Tubing GuideRYRreeI(inches) (inches)Rtg(i n c hes)161 24 48214 30 48-54268 36 48-721.752.002.3752.8753.50375 48 72-96429 48 72-96509 54 96-108616 54 96-10875065 I 96-120Tube ODApproximateCore Diameter Width CapacityI1.75 96 148 18,000IL- IArC)ABKwhereL . tubing capcity (ft)A - tubing stack height [not includingFl (in1B I width betwen flange8 [in)C reel drum core diameter (in)K - K value for difierent tubing air;+.CI1.00 0.2621.25 0.1681.500.116/ F=F-ard12.00 0.0662.375 I 0.04622.875 0.03173.50 I 0.0214Winding large coiled tubing onto a spool with too small of a core will permanently yield the tubing,causing rapid failure. Core diameters of the reels are usually 44 to 48 times the CT diameter. This is aguide for CT spools that will be reeled repeatedly.From the previous data, it is obvious that the pipe yields each time it is spooled on to the 2 ft to 4 ftradius storage coils or passes over the goose neck. In fact, there are a minimum of six bending eventsthat produce yielding in the tube on each round trip of the coil.The sequence of bending forces is shown in Figure 18.32. A detailed look at the entire process for onehalf of the cycle, Figure 18.33, shows even more stresses. Addition of pressure to these forces greatly18-24
amplifies the distortion (swell) in the tubing <strong>and</strong> increases the likelihood of failure of the string. Mostgood coiled tubing life monitoring programs try to track <strong>and</strong> account for both bending <strong>and</strong> pressurehistory. The fatigue produced by bending <strong>and</strong> pressure will be discussed in the section on modeling.Figure 18.32tensionSTRESS VS; STRAIN0 - Before Spooling1 -On Reel2 - Urmpooled - BetweenReel <strong>and</strong> Gooseneck3 -On Gooseneck4 -Between Gooseneck<strong>and</strong> Injector5 - DownholeCOILED TUBINGFigure 18.33The force needed to bend the coiled tubing onto the reel increases exponentially with the coiled tubingdiameter. The force to bend 3-1/2 in. coiled tubing is nearly 10 times the force needed to bend 2 in.CT.Depth control is available from wheeled (friction) monitoring, <strong>and</strong> other types of monitoring, which will workon surface pipe movement. Problems of stretch in the tubing under load may make wheel measurements asecondary source of depth control; corrected by stretch calculations or CCL logs (when logging is run onCT).Axial Load CapacityThe one-dimensional axial load capacity of the tubing is considered to be the tension load that willproduce a stress in the tubing equal to the minimum yield,18-25
L, = s/where:L,SuA= tubing load capacity at yield, Ibs= yield strength of tubing, psi= cross-sectional area of the tubing, in.*For a 1.5 in., 0.1 09 wall tube of 70,000 psi yield steel, the one-dimensional load capacity at yield is:L,=70,000 x 0.476 = 33,320 IbA number of influences might cause the tube to part before this load, including defects, uneven loading,<strong>and</strong> wear. In addition, the one-dimensional load capacity equation does not account for the effectsof internal <strong>and</strong> external pressure on yield.Factors that would increase load capacity are those that increase yield strength. Increasing the wallthickness will also increase load capacity, but will also increase tubing weight, partially offsetting thegain in load capacity.Because of the potential strength reduction by defects <strong>and</strong> use, 80% of capacity at yield is often usedfor work.The individual stresses on coiled tubing are dependent on several factors within the well. The maximumaxial stress, as pointed out earlier, occurs just below the injector head <strong>and</strong> is described by theinjector hoisting load for applications in tension. An additional axial load may be imparted by pumppressure against closed-in tubing or where frictional resistance to fluid flow is high.where:01QAAiPhMaDtaxial stress, psihoisting load, Ibmetal wall area, in.2inside cross-sectional area, in.2internal tubing pressure, psi1 if tubing is closed; 0 if tubing is open0.25 a2/(a-1)Dl toutside diameterwall thicknessThe second component goes to zero when h = 0 (open-ended tubing or tubing with just a checkvalve). When friction pressure is significant, add the total friction loss in place of the (PA/A)h term.The axial force is also opposed by buoyancy of the fluid (calculatable) <strong>and</strong> friction or drag of the outsideof the CT with the casing or openhole (estimatable on a case-by-case basis). The axial force isthe main force in depth limitation calculations, however, the axial effect on tube collapse rating can be18-26
critical when the CT has external pressure applied. Collapse is one of the more common CT failuremechanisms. (It must be noted, however, that overall collapse or failure incidence for coiled tubing isvery low.)Depth LimitationsThe depth to which tubing can be worked or placed depends upon yield strength, loads, internal pressure,<strong>and</strong> friction caused by deviation of the well. In vertical wells, the depth capacity is typically deratedby a safety factor to the point where its weight in air is 80% of the load capacity of the tubing,where:Le = equivalent string length, ftL80% = 80% of tubing load capacity, IbW = tubing weight, Ibs/ftExamples of the use of this equation for 70,000 psi yield tubing <strong>and</strong> 100,000 psi tubing are shown inthe table below.The 80% yield load (based on wall area of CT), for 70,000 psi yield, 1.5 in. tubing with a 0.095 in. wallis1 1Weld 8O%YieldStr;m$h LEd(mm) (mm) (kg/m) (kW (kg)0.095 1.426 70,000 23,482(38.1) (2.41) (2.123) (482,312) (10,673)(.80)(70,000)(1 .52-1.312) d4 = 23,482 Ibs1 E 1 Fi 1;e&ht1.5 0.109 1.619 70,000 26,672(38.1) (2.77) (2.410) (482,312) (12,124)1.5 0.134 1.955 70,000 32,200(38.1) (3.40) (2.909) (482,312) (14.636)MaximumStringLengthin air16,466(5,027)16,474(5.031)23,536Figure 18.34: Depth (length) limits of 1.5 in. CT(7,169)As can be seen in the final column of Figure 18.34, on equivalent string length, increasing wall thicknessof a uniform tube has 1 1 benefit ~ in allowing the tube to work deeper. Only the tensile yieldstrength has an effect on depth capacity. Thus the depth limit is really a function of yield <strong>and</strong> density ofmaterial:18-27
‘80 %Le = -12Pwhere:Ss,-,% = maximum allowable tensile stress (80% of yield), psip = density, Ib/in.3 (0.283 Ib/in.3 for steel)It must be understood that any calculation of any pressure, depth or other factor is a function of thepresent condition of the coiled tubing. Any type of damage, corrosion, wear, etc. dramatically reducesthe strength.The equivalent string lengths for 70,000; 80,000; <strong>and</strong> 100,000 psi yield tubings can be calculated as16,490 ft; 18,845 ft; <strong>and</strong> 23,557 ft, respectively. Thus, an increase in steel yield from 70,000 psi to100,000 psi yields a 43% increase in working depth.The previous calculations are heavily simplified. They apply only to new tubing without defects orwear. The effect of buoyancy can extend the working depth limit of the coiled tubing. If the well is fullof fluid, the formula for maximum length becomes:‘80%Le = 12(p-p,)where:ppm= tube density (Ib/in.3) in air= fluid density, Ib/in.3The conversion from Ib/gal to Ib/in.3 involves multiplication of the mud weight by 0.00432. In a casewhere the well is completely filled with a 10 Ib/gal brine (0.0432 Ib/im3), the 16,466 ft depth limit for1.5 in. (0.095 in. wall) tubing with 70,000 psi yield becomes:L, =I(70,000 x 0.80)I = 18,681 ft12 (0.283 - 0.0432) /b/in.”The 2215 ft increase in working depth is directly attributabte to buoyancy. If the well is only partiallyfilled with liquid, the effects of buoyancy are lessened.BuoyancyThe effect of buoyancy on coiled tubing is the same as on casing or jointed tubing.Buoyant weight, Wb, for an open-ended tube of air weight, W,, filled <strong>and</strong> surrounded by one fluid is:w, = w,[1-ywhere:18-28
pr = density of the fluidps = density of steel, 489.5 Ib/ft3 or 65.4 Ib/galWhen the fluid in the tube is different from the fluid outside the tube, the volume contained inside thetube <strong>and</strong> the volume of fluid displaced by the tube must be calculated <strong>and</strong> the weights summedagainst the air weight of the tube. For the case of cementing through coiled tubing, in a light weightannular fluid, the additional weight can be severe <strong>and</strong> may cause problems. For example, with a1.5 in. coiled tubing of 70,000 psi steel with a 0.109 wall at a depth of 10,000 ft <strong>and</strong> filled with16.4 Ib/gal cement in a well with 9 Ib/gal brine, the weights change isWa= (10,000 ft) (1.619 Ib/ft) = 16,190 Ibdisplaced annular fluid = 5 ('0.D.) (Depth)4= n-( -)1.5 (10, OOO), ft34 1.2= 123 ft3Weight of annular fluid displaced = (123 ft3) x (9 Ib/gal) (7.48 gal/ft3) = 8280 Ib.For an empty (unpressurized nitrogen gas weight ignored) string of CT, the weight at the surfacewould be:load = 16,190 Ib - 8280 Ib - 7909 IbBut, with cement fill inside (using an ID of 1.282 in.),"( -Wt cement = - 1'282)2 (10,000 ft) (16.4 lb/gal)4 12(7.48 gal/ft3) = 10,996 lbThe buoyed weight of the tube is then= (16,190 Ib) + (10,996 Ib) - (7909 Ib) = 19,277 IbAs a check on tensile strength, use the formula for effective string length, Le, to determine if the10,000 ft length is feasible. The weight per foot is simply the buoyed weight divided by the length ofthe tubing. The formula gives the maximum string length that would be possible under these conditions.The calculation is:L,O%Le = Weight per foot18-29
(26,672 lb)Le = (19,277 lb110,OOO ft)Le = 13,836 ftThe job is possible.The weight of pressurized nitrogen, when running a nitrogen gas filled string cannot be ignored as theupper limits of tensile stress are neared. When needed, the nitrogen weight at any pressure can beestimated from Figure 2 for nitrogen (Figure 3 for carbon dioxide). More accurate information is availablefrom computer programs operated by the gas supply firms. Hydrostatic information on commingledfluids is available at the end of this section.Tapered StringsTapering a CT string with smaller OD, lighter weight tubing at the bottom or with larger ID tubing(lighter weight) at the bottom can substantially increase the maximum effective working depth. Theadvantage of thinner wall or smaller OD tubing on bottom is a reduction in string weight <strong>and</strong> the resultantincrease in working depth. The disadvantages are reduced ID near bottom if a smaller OD string isused (more friction pressure during pumping), or reduced collapse resistance if a thinner wall string(constant OD, thinner wall) is used.A tapered string is an alternative to higher yield steel in the tubing. Cost of the tubing, necessary workingdepth, repeated need for the special string <strong>and</strong> weld quality (in the tapered string) are all considerations.Field made tapered strings with butt weld connections are inferior to strings made in the millwith bias welds <strong>and</strong> tapered transitions between the plate (wall) thicknesses. The constant OD stringsare the most useful at the present time due to the inability of most injector heads to h<strong>and</strong>le multipleODs without stopping to change the gripper blocks.For a tapered string, the maximum theoretical working depth will depend on the weight, length, <strong>and</strong>strength of each segment. To check an existing tapered string, calculate the maximum working lengthof each string segment. As an example, the lengths in the 1.5 in. OD tapered string of 70,000 psi yieldsteel are considered in the example. Only the length of the upper string, Section 3, will be calculated.The easiest solution is tabular. The sum of the lengths must not exceed the maximum working length<strong>and</strong> the sum of the weights must not exceed the 80% load yield value (46,100 x 0.8 = 36,880 Ib) of theshallowest section (Section 3).deepestshallowestLength lblft WeightL1 1.426 = WlL2 1.619 = w2L3 2.239 = w3LeWT18-30
Filling in the table,Length45008000L3Li3Ib/ftWeight1.426 = 6,417Ib1.619 = 12,952 Ib2.239 = W336,880 IbW3 is then 17,511 Ib, L3 is 7821 ft <strong>and</strong> Le (total) is 20,321 ft. The L3 of 7821 is the maximum length ofthe heavy wall (0.156 in.) tubing that can hang below the injector head.Compare the maximum total length of 20,321 ft of the tapered string with a string length of 16,472 ftfor the 1.5 in. OD heavy wall CT tube length.Le=-= 36y 8802.23916,472 ftThe advantages of the tapered string become clear quickly there are also the disadvantages ofreduced collapse resistance in the lower section <strong>and</strong> in weld difficulties in field preparation of atapered string. The alternative use of a higher yield steel results in longer working length (23,557 ft for100,000 psi yield pipe), but at a higher price.BucklingWhen a long, thin tube is placed in (effective) compression, the tube will buckle. Coiled tubing canbuckle whenever frictional drag forces (between the outside of the tube <strong>and</strong> the casing or openholewall) exceed the force needed to bend the tubing. Sinusoidal buckling occurs first, followed by helicalbuckling. Formation of the sinusoid probably occurs at the first drag point of the tool string as the long,thin, unsupported tube is caught between opposing forces at the friction point <strong>and</strong> the injector (imaginepushing a weight with a small diameter piece of wire). During this time, the downhole tool (or endof the tube) may stop but the injector is still pushing tubing into the well. The weight indicator shouldregister a change. The tube will now touch the wall at several places <strong>and</strong> friction will increase. Thepipe ultimately forms a helical or spring-like spiral. Thrust loads at the surface increase sharply <strong>and</strong>the coiled tubing is said to lock up. If the injection is not stopped, the pipe may fail by shear or maycollapse <strong>and</strong> then shear off. Examples of sinusoidal <strong>and</strong> helical buckling are shown in Figure 18.35.More buckling problems will be found in openholes than in cased holes (result of drag differences).Buckling is more severe where small tubing is used in large holes or large tubulars. Helical bucklingcan occur easier in larger diameter holes.Increasing pipe stiffness or rigidity through higher strength pipe or heavier wall, or by pressuring up onthe tube if it is close ended, should reduce the tendency to buckle.Most coiled tubing service companies have computer models that help predict reach of CT in a deviatedwell. More information is contained in the section on penetration.Capacity <strong>and</strong> DisplacementCapacity <strong>and</strong> displacement are given by the following formulas:Capacity = Unit volume of fluid contained inside of coiled tubing.18-31
cCoiled tubing can buckle in sinusoidalor helical configurations when subjectedto excessive compressional load8Inside cased w own holes.LFigure 18.35V = 0.0009714 - c?where:V = Coiled tubing capacity per foot (Bbls/ft)d = Inside diameter (inches)Displacement = Equivalent unit volume of fluid that will be displaced by the cross-sectional area ofthe coiled tubing body upon insertion into a filled well.where:DP= 0.0009714 - (0'- c?)Dp =Coiled tubing body displacement per foot (Bbldft)D =Outside diameter (inches)d =Inside diameter (inches)External Displacement = Equivalent unit volume of fluid that will be displaced by insertion of aclosed-end string of coiled tubing into a filled well.D, = 0.0009714.0'18-32
where:D,D= Coiled tubing body displacement per foot (Bbls/ft)= Outside diameter (inches)An unloading operation with nitrogen may be designed for continuous or intermittent operation. Themost effective method of initiating underbalance is to inject N2 while running in the well. This techniquelightens the column, allowing the well to unload gradually. The nitrogen gas injection rates areset to overcome hydrostatic pressure at the end of the tubing as the tubing is run into the well. Thismeans that required rate of gas, measured in scf, will steadily increase. When running through freshwater at 100 Wmin, a 1-1/4 in. CT with a 15 bbl total volume (fillup volume of the entire coil of the CT)must have a nitrogen gas injection of over 250 scfm just to keep the gas the end of the CT (offsetspressure compression effects). Displacing gas from the tubing <strong>and</strong> initiating gas lift requires gasinjection over the CT fill rate of 250 scfm.Once N2 injection pressure overcomes the pressure of the hydrostatic head of the liquid, the gas functionsas a single point gas injection valve, Figure 18.36. As the fluid column is lightened, flow from thewell may be initiated <strong>and</strong> adjustments to the N2 flow rate may be necessary. Typically, as the depthincreases for any constant density gas-cut head, more gas is required to maintain lift. A starting N2injection of 150 to 250 st<strong>and</strong>ard cubic feet per minute is usually adequate at shallow depths. The rateshould be increased until flow is attained at surface. As the well unloads then the N2 rate can <strong>and</strong>should be reduced. If the N2 rate is higher than needed, the annular friction pressure will be high. Thestatus of the head of fluid above the tubing can be monitored by noting the relative rates of gas <strong>and</strong>liquid. If the gas vented at the surface appears to be increasing (with a constant gas injection rate),then more liquid is being evacuated from the tubing than is flowing into the tubing.Figure 18.36: Fluid Unloading Operation UsingCoiled Tubing <strong>and</strong> Nitrogen[Sas-Jaworsky, World <strong>Oil</strong>, 19921The reasons for designing an unloading treatment <strong>and</strong> sticking to the design are outlined in the followingsentences. A well designed program will avoid creating uphole <strong>and</strong> downhole pressure shocks that
esult when a well flows in slug flow. If flow is less than expected <strong>and</strong> the well has been substantiallyunloaded, the problem may be damage or another feed-in problem that requires attention.In nitrogen gas lift, the annular clearance may dictate many conditions of the treatment, For smallclearances such as 1-1/4 CT in 2-3/8 in. tubing, the typical 0.35 in. annulus creates high friction drop.If nitrogen gas is injected at a fast rate, the back pressure (caused by annular friction) of lifting water<strong>and</strong> gas may exceed the pay zone pore pressure <strong>and</strong> gas may enter the formation. In extreme cases,the formation may even be fractured if the total BHP exceeds the fracture initiation pressure. Whencirculating losses are noted, control injection pressure to prevent fracturing <strong>and</strong> cease gas injectionperiodically to allow formation unloading <strong>and</strong> possible flow.When annular clearance is large, such as with small CT in large diameter tubing, or even 1-1/2 in. CTin casing, the liquid fallback will interfere with unloading. In these large annulus cases, occasionalslugs of foaming surfactants injected with the gas through the coil are useful to tie the liquid up in afoam.In marginally consolidated formations, the drawdown should be applied gradually <strong>and</strong> held at whateverminimum value was set during the design phase. Slug flow in this environment should be minimized.One of the trigger mechanisms for s<strong>and</strong> production is a rapid change in pressure differential.If s<strong>and</strong> is produced to the surface during an unloading job, DO NOT stop circulating; stopping orseverely curtailing circulation may allow the s<strong>and</strong> in the annulus to fall back <strong>and</strong> form a bridge. Whens<strong>and</strong> is produced, continue circulating at that rate for 1.5 times the calculated bottoms up time (seeS<strong>and</strong> Washing section) or, if the “net rise rate” of the s<strong>and</strong> is known, use a circulating time sufficient toclear the annulus. S<strong>and</strong> production at a constant flow rate usually stops or decreases rapidly within afew minutes of the start of s<strong>and</strong> production unless the failure point of the formation has been reached.The failure point is marked by continuous s<strong>and</strong> production. If s<strong>and</strong> production has not significantlyslowed by the end of the calculated bottoms-up time, start running the CT a o f the well while maintainingcirculation. When s<strong>and</strong> production stops, hold the CT at a constant depth <strong>and</strong> maintain circulationfor 2 annular volumes. When satisfied that the s<strong>and</strong> has been cleared from the annulus, reducecirculation rate to a value below the rate that caused s<strong>and</strong> production. Ease back into the well <strong>and</strong> tagany fill. Clean out the fill at the lower rate if possible or use an alternate fluid such as brine or foam.When cleaning out fill in a zone that is suspected of producing s<strong>and</strong>, periodically pick up the CT <strong>and</strong>circulate until s<strong>and</strong> is cleared. By easing back into the surface of the fill (while circulating), changes inthe s<strong>and</strong> top can be detected. For more information on s<strong>and</strong> removal, see the section on s<strong>and</strong> washing.The problem of unloading solids from the well is made more difficult in highly deviated (over 200) wellsor where the coiled tubing 0.d. is small compared to the casing i.d. Cleanouts become steadily moredifficult as the ratio of CT-id-to-annular-od increases to values over 3.5 (2” CT in 7” casing). The problemis one of flowing enough gas through the CT to generate sufficient velocity in the annulus to lift thes<strong>and</strong>. Foaming the fluid is a typical approach to solving the problem.The purpose of nitrogen or carbon dioxide gas injection is to create underbalance so that a well canflow. When the “dead” fluid is removed, the produced fluids may be able to flow on their own if sufficientreservoir pressure (<strong>and</strong>/or natural gas volume) is available. Estimation of the nitrogen gas ratenecessary for kicking a well off requires an estimation of the well’s ability to flow. The following Darcyequation is the normal starting place, U the h, or height, in the formation assumes constant permeability.where:18-34
Qf = calculated fluid production rate, BPDk = formation permeability to the produced fluid, mdh = formation height, ftPe = formation pressure (original or at the drainage radius), psiaPd = flowing BHP, psiarn = produced fluid viscosity, cpB = formation volume factor, FVFre = drainage radiusr, = wellbore radiusS = near wellbore skin factorIn the equation, the values of several of the variables may vary widely from reservoir to laboratorymeasurements. Permeability, k should be the permeability to the flowing fluid, not the absolute permeabilityfrom a core test. The estimate of h must reflect the thickness of quality pay that averages thepermeability value used. A kh from a buildup test in a similar well in the field may be a good startingpoint. A curve such as Figure 18.37 is drawn from the data from the Darcy equation, IPR (inflowpotential relationship), or flowing BHP tests. PI can be estimated from this data.Figure 18.37: Hagedorn & Brown Curve[Sas-Jaworsky, World <strong>Oil</strong>, 19921The equation for Vogels curve is:-= QfQfnlax1 -0.20[ %)-o.*( pw f'PwfFor any flow rate, there is some potential that the well will flow to the surface. A multiphase verticalflow program is needed to predict flowing fluid head <strong>and</strong> frictional pressure loss. Input includes tubingID, produced fluid specific gravity <strong>and</strong> <strong>Gas</strong> Liquid Ratio (GLR). An example curve (solution from Hagedorn<strong>and</strong> Brown) is shown in Figure 18.38.18-35
- liquid - ratioProducaionrate 8ooboPdG~s600 &hbloil oravity350 APIoas~gravity 0.65Average flowing temp. 140 O FFigure 18.38: Flowing pressure gradient curvefor a 10,000 ft TVD well producing800 bopd (35' API gravity) with a600 scflbbl GLR (developed fromHagedorn <strong>and</strong> Brown multi-phasevertical flow correlations).[Sas-Jaworsky, World <strong>Oil</strong>, 19921Besides the underbalance creating effects of gas injection, the physical presence of coiled tubing inthe tubing or casing reduces the area of the normal flow path, increasing the resultant flow velocities.As insignificant as this seems, a well that is flowing under this system, even without the added help ofinjected gas, may cease to flow after the tubing has been removed. Wells that behave in this mannerare c<strong>and</strong>idates for stimulation if damaged or may be helped by a velocity string of a smaller id tubing.<strong>Gas</strong> is not the only fluid that can be used in this case. in wells where the unloading of a heavy brine isnecessary to bring the well on, a lighter liquid may be used for displacement.Pulling the coiled tubing out of the well removes hydrostatic head since it lessens the volume by thedisplacement based on the coil OD. In other words, reeling out of the well creates a swabbing action.In a 1-1/4 in. coil, for example, displacement is 1.52 bbl/l000 ft <strong>and</strong>, assuming a tubing removal (reel-18-36
ing out of the well) rate of 60 ft per minute, the displacement removed is about 0.091 bbl/min (or a rateof about 131 BPD).The place or depth in the well where gas is applied also makes a great deal of difference on liquid producedfor gas volume injected. Examples of circulation points for 1 in. <strong>and</strong> 1-1 /4 in. CT at 200 scf/min<strong>and</strong> 400 scf/min are shown in Figure 18.39.lh CT wiw Sdpm1.800 I / 1 llcin. CI w1w .ctrmFigure 18.39: Multi-phase liquid flow potential versuslength of 1 in. <strong>and</strong> 1-114 in. ODcoiled tubing inside 2-7/8 in. OD productiontubing (2.441 in. ID) for a500 psig drawdown. (Courtesy ofNowsco Well Service Ltd.)[Sas-Jaworsky, World <strong>Oil</strong>, 19921The mechanical considerations for unloading include:1. Available nitrogen rate, volume, <strong>and</strong> pressure limitations.2. Completion type (gravel pack, frac, natural, limited entry, etc.).3. Formation competence.4. Workover or production tubing size.5. Surface equipment pressure <strong>and</strong> rate limits.6. Foam creatiodbreaking problem with the produced fluids.The N2 equipment must have the minimum actual rate capability to allow gas lift of the liquid at theexpected flow rate of the well to the design depth. The rate is useful only if it can be delivered at apressure high enough to overcome hydrostatic <strong>and</strong> flowing frictional forces. The volume available18-37
should be at least 50% over the volume needed for the job if the job variables are unknown (volumeexcesses may be tempered by experience in the field).The completion type may determine the pressure at which the well may be unloaded. Friable or marginallyconsolidated s<strong>and</strong>s must be unloaded gradually <strong>and</strong> some back pressure may be needed. Inmost weak s<strong>and</strong>s, drawdown may range from 250 to about 1000 psi. In well consolidated formations,the drawdown is not limited by consolidation. Plastic consolidated or gravel packed completions mayhave a field-experience drawdown limit. Fractured formations that may loose proppant in the nearwellbore area may also need a limit on drawdown or elimination of slug flow.Workover or production tubing determines frictional head <strong>and</strong> the correct velocity to minimize gas slippage.As tubing ID increases, fluid velocity in the CT/tubing annulus decreases <strong>and</strong> slippage of gaspast the liquid increases. Multiphase flow correlations for tubing size selection may be used to determineflow behavior <strong>and</strong> expected friction:Surface equipment <strong>and</strong> flow line sizes may also be a factor in fluid backflow. Vessels that were satisfactoryfor liquid <strong>and</strong> low volume gas production may have problems h<strong>and</strong>ling the slug flow or thehigher gas rates common in N2 unloading. A nodal analysis program is often useful in modelingbehaviors. A diverter in the BOP stack is required in most cases as a bypass.Creation of foam is a problem that may require special attention. Foams in stimulation fluid backfloware often planned as a method of removing solids from the well. Foams may also occur on backflow ofspent acids <strong>and</strong> brine because many of the surfactants used in stimulations will create foams whengas <strong>and</strong> sufficient pressure drop (energy) are available. The effects of surfactants <strong>and</strong> mutual solventsare variable on creation or breaking foams. Inhibitors, some emulsifiers, soaps <strong>and</strong> foamers stabilizefoams while alcohols <strong>and</strong> Some surface tension lowering surfactants break foams. Mutual solventsthat create foam on backflow (at low concentrations) include EGMBE <strong>and</strong> most “micellar” type surfactants.Diesel is one of the worst foamer creators. Alcohol based mutual solvents such as A-Sol, SuperA-Sol <strong>and</strong> A-Sol P-38 break most foams. Foams created in crude oil are usually the result of naturallyoccurring organic acids. The nitrogen or carbon dioxide gas in the lift process provides both the gasvolume <strong>and</strong> the energy for most foams.Emulsions on backflow are also common. Most emulsion problems cease when the pH of the backflowedfluids rise above 6. Treatment of emulsions is usually by surfactants. An alternate treatmentinjects Super A-Sol at the wellhead at 2 to 10 liters per hour, depending on well flow rate, <strong>and</strong> uses thelead line as a mixing vessel. Treatment can usually be discontinued when the pH rises above 5.The quantity of nitrogen required to lift a column of liquid depends on:1. load liquid density2. dissolved gas in the load liquid3. tubular (annular) volume to surface4. maximum rate of liquid flow or volume of liquid in the case of brine cleaning5. BHP6. depth of the wellThe problems are greatly simplified if the nitrogen is being used to reduce the hydrostatic head so thewell will flow. In this case the bottom hole pressure may not be adequate to lift a column of “dead” liquidbut the well may flow with a lighter hydrostatic of a gas cut column. The technique is useful forkicking off a well that has loaded up <strong>and</strong> died or to achieve higher drawdown on a well flow test or18-38
cleanup. Typical unloading operations use about 500 scf/bbl, more in large volume annulus or casing,less in smaller annulus areas.If, for example, a 10,000 ft well loaded with a 10 Ib/gal fluid needs 2000 psi of hydrostatic pressureremoved to flow, a chart such as on page 58 can be used to calculate the minimum needed depth toinject nitrogen. The fluid in the well is 0 scflbbl <strong>and</strong> the target is 500 scf/bbl. On page 62, locate thepoint in the set of curves where the 0 scf/bbl <strong>and</strong> the 500 scf/bbl are 2000 psi apart (vertical separationin this figure). The depth is roughly 6000 ft. The value is from the curve for 10 Ib/gal brine with athermal gradient of 1.1 OF11 00 ft.Well displacement examples.A 10,000 ft well is loaded with 8.5 Ib/gal completion fluid. The 3-1/2 in. tubing (9.3 Ib/ft) is run to9,000 ft in 7 in., 23 Ib/ft casing. A coiled tubing unit with 15,000 ft of 1-1/2 in. (0.109 in. wall) is to beused for the job.1 BHP = (8.5 Ib/gal) (0.052 gal/ft-in.2) x 10,000 ftBHP = 4420 psi,2. WHP is determined from chart interpretation starting with the BHP. Round up BHP to 4500 psi<strong>and</strong> from pages 59 <strong>and</strong> 82, the WHP is estimated as 3420 psi with a V'N (st<strong>and</strong>ard volumegadactual volume gas) volume factor of 1200 scf/bbl.The coiled tubing volume is: (1 5,000 ft) (0.001 597 bbls/ft) = 24 bblsThe volume in the CT in the well: (1 0,000 ft) (0.001 597 bbls/ft) = 16 bblsThe volume in the CT on the reel: (5000 ft) (0.001597 bbls/ft) = 8 bblsThe volume in the CT/Tubing annulus: (9000 ft) (0.0065 bbls/ft) = 58.5 bblsThe volume in the CTKasing annulus: (1 000 ft) (0.0372 bbls/ft) = 37.2 bblsThe total annulus volume is 58.5 + 37.2 = 95.7 bblsN2 to displace the CTN2 for CT in the well = (16 bbl) (1205 scf/bbl)N2 for CT on the reel = 8 bblThis occurs at a depth reading of about 5900 ft. The end of the tubing would need to be at 5900 ft <strong>and</strong>the nitrogen surface injection rate to produce 500 scf/bbl would be:N2 rate = (CT running rate) (tubing volume factor) (500 scf/bbl)At a CT insertion speed of 100 Wmin using 1.5 in. (0.109 in. wall) tubing would produce the following:N2 rate = (100 Wmin) (0.001597 bbl/ft) (500 scflbbl)N2 rate = 80 scf/min18-39
If the nitrogen injection began as the tubing entered the fluid <strong>and</strong> continued until 5900 ft was reached,the total N2 needed to just kick the well off would be:'N2vol =total CT depthCT running ratex nitrogen injection rate'N, VO~ = 5' ft x (80 scf/min)100 ft/min= 4720 S C ~ .Since N2 is used during cool down of the N2 transport <strong>and</strong> probably for some time after the well startsto flow, a larger volume of nitrogen gas would be needed, probably 7500 to 10,000 scf.Fluid Unloading in CasingWhen there is no production tubing in the well, unloading liquids or solids can be extremely difficult. Inwells with large diameter casing <strong>and</strong> conventional coiled tubing, such as 1 -1/2 in. OD, examples havebeen seen where only a mist of fluid is recovered at the surface while pumping continually with nitrogen.In once instance, one entire transport of nitrogen was pumped into a well with 8-5/8 in. casingusing 1.5 in. coiled tubing without recovering significant liquids even though the well was almost completelyloaded with liquid.In the instance of large casing without tubing, it has been found that using a foamer <strong>and</strong> a smallamount of liquid with the nitrogen provided very good unloading capability, even in deviated holes.When foam was used, less than 112 the nitrogen was needed as required in the unsuccessful attemptin the 8-5/8 in. casing that used only nitrogen.Removal of s<strong>and</strong> <strong>and</strong> other small debris was one of the original uses of coiled tubing in the oil industry.CT has been used to clean s<strong>and</strong> from casing up to 11 -5/8 in. <strong>and</strong> depths of over 16,000 ft.The first step in removing s<strong>and</strong> from a wellbore is loosening s<strong>and</strong> by washing or jetting. Increasing theability of the fluid to pick up debris is accomplished by increasing the turbulence. Increasing the liftcapacity for circulating the debris out of the well can be accomplished by increasing viscosity or flowrate. To generate lift, the annular fluid velocity must exceed the particle settling velocity.Annular velocity <strong>and</strong> tubing velocities can be calculated with the formulas:tubeV-1,020 QannulusV=1,020 Q2D,-Diwhere:VQ= flow rate, ft/min= fluid pump rate, BPM18-40
DcDtjDcj= coiled tube OD, in.= id of the production/work string, in.= coiled tube ID, in.When the flowing fluid is a compressible gas, the velocity increases from the highest pressure point(usually bottom hole) toward the lowest pressure (usually the surface). Particle settling depends onthe shape, size <strong>and</strong> density of the material. Figure 1 gives s<strong>and</strong> settling velocities (in ft per second) forvarious sizes of s<strong>and</strong> for a range of fluid viscosities. The circulating velocity should be about twice theparticle setting velocity.If the CT is run open-ended, the circulating fluid will tend to flow up around the tubing, leaving thes<strong>and</strong> to settle at the walls of the casing. This problem is especially apparent in large diameter casing.To better apply the circulation energy, both in s<strong>and</strong> pickup <strong>and</strong> carrying capacity, jetting nozzles of upto 3/32 in. are sometimes used. The velocity of the fluid at the jet nozzle is up to 200 ft/sec but the frictionpressure may claim 500 to 1500 psi of the available pressure.A variety of nozzle designs are used depending upon type of cleanout, hardness of fill, diameter ofcasing <strong>and</strong> needed flow rate. The fluids used can be slick water, foam, acid or gas.Rotation of coiled tubing tools is limited but can be accomplished by mud motors, impact tools withratcheting mechanisms or fluid powered jetting. The mud motors are positive displacement tools thatrotate in response to flow of pumped fluids (gas or liquids). A section of this book highlights this information.The rotating jars also are fluid powered <strong>and</strong> provide impact force <strong>and</strong> rotation (see the sectionon Tools). Rotating or fixed jetting tools <strong>and</strong> nozzles use hydraulic force.The bottomhole circulating pressure should be about the same as the bottomhole pressure. The BHP<strong>and</strong> friction pressure relationships are defined by three equations:P =( BHP- A P, - A Pbp)0.052 DPSRFvel= -PvdQ=1029.6BHP = static bottomhole pressure, psiAPfa = friction pressure in annulus, psiAPb,, = back pressure, psiD = TVD to mid. perfs., ftp = injected fluid system density, ppgPSR = particle settling ratioFvel = annular fluid velocity, WminPve, = particle setting velocity, WminQ = pump rate, BPMdo = inside diameter of outer pipe, in.18-41
di= outside diameter of inner pipe, in.A muleshoe cut into the bottom of open-ended coiled tubing will assist in getting through s<strong>and</strong> bridges.Straightening out the last 3 ft of the coiled tubing before running in a well will also assist in gettingthrough tight spots, ledges <strong>and</strong> restrictions.Friction PressurePumping fluids through coiled tubing creates a frictional pressure resistance. The friction or pressuredrop (or loss) is affected by flow rate, fluid density, fluid viscosity, tube ID, tube length, <strong>and</strong> the roughnessof the tube wall. Roughness of the tube wall is taken as 0.00015 (for purposes of chart computation),a common value for absolute roughness in clean steel pipe. The Reynolds number, Re, is:where:QrUdRe = (2125.7 * Q* r) / (d* U) : [Re is dimensionless]= flow rate in BPM= density of flowing fluid, Ib/ft3= viscosity of flowing fluid, cp= inside diameter of tubeOnce the Reynolds number is calculated, a friction factor for steel is obtained from Figure 3. Locatethe Reynolds number, then read vertically up to the right tubing size curve then over to find the frictionfactor, f.Pressure drop in psi per 1000 ft of tubing is then:AP/1000 ft = (380.901* r* f. 8) / (8)In calculation of the pressure drop by formula or by the graphs that follow this discussion, the entirelength of the tubing on the coil must be used (regardless of the depth of the well). If the DP is572 psi/l ,000 ft for a 1.25 in. OD (1 in. ID) coiled tubing with 16,000 ft of coiled tubing on the coil, thenthe pressure drop is 16 x 572 = 9,152 psi. It does not matter that the well may only be 4000 ft deep.Downhole tools run on coiled tubing are usually only slightly modified conventional wireline <strong>and</strong> tubingconveyed tools. The opportunity for coiled tubing in many of these areas is to bridge the gap betweenthe utility <strong>and</strong> ease of operation of slick line <strong>and</strong> the rugged but expensive tubing-conveyed techniques.In Figure 18.40, some of the more common tools are mentioned. The type of downhole equipmentwill depend upon the individual job. Each bottomhole assembly (BHA) should be tailored for aspecific well condition.Examples of the burst, collapse, <strong>and</strong> tensile strengths of the tubing are shown in Figure 18.41 .17*19Coiled tubing is made by forming steel strap into tube <strong>and</strong> welding the seam. The individual straps arejoined at the end of each spool of strap. Total operational coil tubing spool lengths of over 20,000 ft(61 00 m) are common <strong>and</strong> the record depth for working coiled tubing is over 20,000 ft (61 00 m). Thework life of the tubing is affected by the number of trips <strong>and</strong> the environment of operation. The wear isusually fatigue <strong>and</strong> occurs at the surface as the tubing comes off the spool, curves over the “gooseneck” <strong>and</strong> is gripped by the injector. Fatigue is increased when the tubing is worked while pressured.Stretch of the tubing under load can be estimated by the following formula.’’EL= elongation of tubing below injector head, ft = 0.0567 L2= tubing length below injector head, 1000 ft18-42
ToolFishing NeckHydraulic DisconnectRetrieval ToolTubing End LocatorCirculating ValveFluid Control Valve/Back Press ValveSwivelStraddle PackerTubing ConnectorsH yd rau I ic JarsNozzle Heamater BlasterForce GeneratorLogging ToolsMud MotorTubing Cutter - MechanicalUseSt<strong>and</strong>ard at top of BHAReleases C.T. when BHA stuckPulling serviceable equipmentDepth ControlAllows circulation above BHAKeeps CT full of fluid, isolatesReleases torqueIsolates interval for treatingCT to jointed tubingCreates jarring impactCleans <strong>and</strong> cuts depositsProvide push/pull forceVariousS<strong>and</strong> plugs, milling, fishing, drillingRun with motor'Figure 18.39: Common Coiled Tubing ToolsMillsRun with motorInflatable PackersVariousBridge PlugsVariousCentralizersHydraulic or fixedFishing ToolsVariousKnuckle JointCamerasFishing or retrieving aidVariousNipples/ProfilesVarious- Pump Down ToolsPLT ToolsIncreases CT reach in horizontalsWell diagnosisOrienting ToolAdjustable Bent SubRe-engageable Fishing ToolsRotates BHA 30" by 45O by cycling pumpBends to preset angle when pressure appliedEngage/Disengage by setdown/ pickup or hydraulicShifting M<strong>and</strong>rel Opening/closing sliding sleeves (Ackert, 19tFigure 18.40: Common Coiled Tubing ToolsThus, 10,000 ft of tubing below the injection head would have a stretch of about:E = 0.0567 (10) = 6 ft (1.82 m)The stretch may be much higher when under load or much less due to buckling when the tubing is incompression.Coiled tubing is widely used in deviated wells. It can easily be used in the wells over 55" deviationwhere wireline cannot be run with some tools. The utility of the coiled tubing in deviated wells is limitedby the angle of the well, frictional drag as it is pushed into the well, the weight it is pushing (includingits own) <strong>and</strong> the positive <strong>and</strong> negative effects of buoyancy provided by fluids in the tubing <strong>and</strong> inthe annulus. The failure of tubing at the high frictional loads is usually by buckling.18-43
DlmensionsPressure CapacltyFigure 18.41(Ackert, 1989)Tubing is also available with wireline running through the inside. The wireline equipped coils are usedfor combination work such as logging <strong>and</strong> spotting fluid or for running logging tools in high angleholes.One of the best uses of coiled tubing is in spotting workover fluids.lg In a typical fluid spotting operation,the coiled tubing is stung through the tubing <strong>and</strong> packer to a point in the casing below thetailpipe. The coiled tubingltubing annulus is left open while the fluid is circulated into place through thecoil tubing. If the treatment involves acid, the tubing is slowly picked up as the acid is pumped, leavingjust the end of the tubing in the acid. The coiled tubing may then be removed or left in the well to providenitrogen unloading capacity on the backflow. Although the technique places the treating fluid inthe right location, whether the fluid remains in place depends on its density relative to the fluid in thewellbore. Unless trapped by a packer <strong>and</strong> plug or a selective injection tool, fluids with density differencesof as little as 0.05 g/cc will separate.20Well Testing with Coiled TubingWell testing, which can be difficult when wells do not flow <strong>and</strong> a test is needed before a lift system isinstalled, is greatly simplified by the use of coiled tubing. Use of coil tubing <strong>and</strong> compressed nitrogengas permits collection of two critical pieces of diagnostic information; estimation of the formation’s productivityindex, PI, <strong>and</strong> verification of the actual response of the well to various lifting conditions.21The gas lift tests use a st<strong>and</strong>ard coiled tubing system with a check valve in the bottom <strong>and</strong> nitrogengas. The coiled tubing is run through the tubing to a point above the perforations. In most cases, thecoiled tubing shoe (end of the coiled tubing) remains within the tubing. The effective working area forflow is the annulus between the outside of the coiled tubing <strong>and</strong> the inside of the tubing wall. The wellis unloaded of wellbore fluid by the action of the rising, exp<strong>and</strong>ing nitrogen gas. The volume of fluidproduced from the well is dependent on the rate of formation feed-in, the capacity of the coiled tubinghubingannulus <strong>and</strong> the amount of lift provided by the nitrogen gas. If the formation feed-in <strong>and</strong>pressure are sufficient, the nitrogen gas injection can be reduced until the liquids produced at the surfacejust equal the feed-in from the formation. This steady state method offers the best method of testing,but because the lower limit of injection rate on most nitrogen supply units is about 150 scfm, thecontinuous lift is impractical for most welis.*l<strong>References</strong>1. Conversation with Joe Yoder, Otis <strong>Engineering</strong>, May 9, 1989.18-44
2. Bielstein, W. J.: “Wireline Methods <strong>and</strong> Equipment,” Seventh World <strong>Petroleum</strong> Congress, PaperPD-ll(l), 1967.3. Rust, D., Feather, G. L.: “Mechanical Underst<strong>and</strong>ing Essential for Cased-Hole Wireline Operations,”<strong>Oil</strong> & <strong>Gas</strong> J., (Apr. 4, 1977), pp. 86-91.4. Vaughn, G. A., Chaung, H.: “Wireline Materials for Sour Service,” Materials Performance (Jan.1982), pp. 44-50.5. Patton, L. D., Abbott, W. A.: “Wireline Completions - The Systems Approach,” Pet. Eng. Int.(Aug. 1981), p. 83, 86, 89, 92, 94, 98.6. Adams, N.: “Coiled-tubing rigs speed workover operations,” <strong>Oil</strong> <strong>and</strong> <strong>Gas</strong> J. (Sept. 14, 1987),p. 87-92.7. Frank, W. J.: “Improved Concentric Workover Techniques,” J.P.T. (April 1969), pp. 401-408.8. Cobb, D. O., Bragg, J. A., Haines, J. R., Putnam, J. S.: “Coiled Tubing Nonrig Workovers atPrudhoe Bay,” SPE 17592, International Mtg., Tiangjin, China, Nov. 1-4, 1988.9. AI Khatib, M. A., Sadik, A. S.: “Design <strong>and</strong> Techniques of Testing <strong>and</strong> Evaluation of Deep KhuffWells,” SPE 13682, Mid-East Tech. Conf., Bahrain, March 11-14, 1985.10. , “Produce Through Coiled Tubing to Keep Marginal Wells Unloaded,” World <strong>Oil</strong>,(Dec. 1986), 38, 39.11. , “Straddle Packers for Coil Tubing Operations,” Nawsco Technical Publication,Ret58.1.12. Taylor, D. B.: “<strong>Gas</strong> Well Stimulation Using Coiled Tubing <strong>and</strong> Acid with a Mutual Solvent,” SPE411 5, Annual Tech. Conf., San Antonio, TX, Oct. 8-1 1, 1972.13. Mac Ewen, H.: “Coiled-Tubing-Conveyed Logging Systems,” SPE 18350, Euro. Pet. Conf., London,Oct. 16-19, 1988.14. Howell, E. P., Smith, L. J., Blount, C. G.: “Coiled-Tubing Logging System,” SPE 15489, presentedat the 61st Annual Tech. Mtg., Oct. 5-8, 1986 (New Orleans).15. Jones, C. M.: “Application of Tubing-Conveyed Techniques in Through-Tubing Operations,” SPE1621 4, Prod. Oper. Symp., Oklahoma City, March 8-1 0, 1987.16. Cooper, R. E.: “Coiled Tubing in Horizontal Wells,” SPE 17581, International Mtg., Tianjin, China,NOV. 1-4, 1988.17. , “QT-70 Technical Data,” Quality Tubing, Inc., Technical Publication.18. , “SP-70 Coil Tubing Services, Physical <strong>and</strong> Chemical Test Report,” SouthwesternPipe.19. Ackert, D.: “The Coiled Tubing Revolution,” <strong>Oil</strong>field Review, (October 1989), p. 4.20. Fredrickson, S. E., Broaddus, G. C.: “Selective Placement of Fluids in a Fracture By ControllingDensity <strong>and</strong> Viscosity,” SPE 5629, 50th Annual. Mtg., Dallas, Sept. 28-Oct. 1, 1975.18-45
21. DeGhetto, G.: “How To Optimize Well Testing With Coiled Tubing,” <strong>Petroleum</strong> Engineer Int.,(January 1990), pp. 31-34.22. Pursell, J. C., Moore, B. K.:”How to S<strong>and</strong> Wash Large Tubulars with Coiled Tubing,” Pet. Eng.Intl., August, 1992, pp. 42-45.Additional <strong>References</strong> on Coiled Tubing1. Adams, L. S.: “Coiled Tubing Velocity String Set at Record 20,500 ft,” <strong>Oil</strong> <strong>and</strong> <strong>Gas</strong> Journal, April13, 1992, pp. 44-46.2. Adams, L. S. <strong>and</strong> Marsili, D. L.: “Design <strong>and</strong> Installation of a 20,5004 Coiled Tubing VelocityString in the Gomez Field, Pecos County Texas,” SPE 24792.3. Adams, N.: “Coiled Tubing Rigs Speed Workover Operations,” <strong>Oil</strong> <strong>and</strong> <strong>Gas</strong> Journal, September14, 1981, pp. 87-92.4. Anderson, G. <strong>and</strong> Hutchison, S.: “How to Efficiently Wash S<strong>and</strong> from Deviated Wellbores,” World<strong>Oil</strong> (December 1978), pp. 75-84.5. Avakov, V. A. <strong>and</strong> Council, M. M.: “Universal Gripper Blocks for Reeled Tubing Injectors,” ASME92-Pet-7, January 26-30, 1992, Houston.6. Avakov, V. A. <strong>and</strong> Foster, J. C.: “Coiled Tubing Life-Strain-Reliability Function,’’ 2nd InternationalConference on Coiled Tubing Technology: Operations, Services, Practices, Houston, March 29-31,1994.7. Avakov, V. A., Foster, J. C., <strong>and</strong> Smith, E. J.: “Coiled Tubing Life Prediction,” OTC 7325.8. Bedford, S. A.: “Coiled Tubing Operations in the Northern North Sea, Magnus Field,” 2nd InternationalConference on Coiled Tubing Technology: Operations, Services, Practices, Houston,March 29-31, 1994.9. Blount, C. G.: “The Challenge for the Coiled Tubing Industry,” Journal of Pet. Eng., May 1994,pp. 427-430.10. Blount, C. G.: “Coiled Tubing, Operations <strong>and</strong> Services, Part 15 - Special Tools,” World <strong>Oil</strong>, May1993, pp. 53-56.11. Blount, C. G., Herring, G. D., Patterson, W. W., <strong>and</strong> Walker, M. L.: “Acid Inhibition for Coiled Tubing:Laboratory Screening <strong>and</strong> Field Verification,” SPE 25498.12. Blount, C. G., Ward, S. L., Weiss, T. D., <strong>and</strong> Hightower, C. M.: “Recompletions Using LargeDiameter Coiled Tubing: Prudhoe Bay Case History <strong>and</strong> Discussion,” SPE 22821, Dallas,October 6-9, 1991.13. Brookey, T., Bird, J., <strong>and</strong> Garrett, C.: “Use of Drilling Fluid Additives to Improve Drilling <strong>and</strong>Remedial Operations with Coiled Tubing,” 2nd International Conference on Coiled Tubing Technology:Operations, Services, Practices, Houston, March 29-31 , 1994.14. Brown, A.D.F., Merrett, S. J., <strong>and</strong> Putnam, J. S.: “Coiled-Tubing Milling/Underreaming of BariumSulfate Scale <strong>and</strong> Scale Control in the Forties Field,” SPE 231 06, 1991 SPE Offshore EuropeConf., Aberdeen, September 3-6.18-46
15. Brown, P. T. <strong>and</strong> Wimberly, R. D.: “Coiled Tubing, Operations <strong>and</strong> Services, Part 10,” World <strong>Oil</strong>,October 1992, pp. 75-79.16. Campbell, J. A. <strong>and</strong> Bayes, K. P.: “Installation of 2-7/8 in. Tubing Tailpipes in Live <strong>Gas</strong> Wells,”Journal of Pet. Tech., May 1994, pp. 442-447.17. : “New Life for an Old Slope, Journal of Pet. Eng., May 1994, pp. 388-390.18. Chambers, M. J.: “Laying S<strong>and</strong> Plugs with Coiled Tubing,” 2nd International Conference onCoiled Tubing Technology: Operations, Services, Practices, Houston, March 29-31 , 1994.19. Chitwood, G. B., Lewis, P. C., Fowler, S. H., <strong>and</strong> Zernick, W. M.: “High-strength Coiled TubingExp<strong>and</strong>s Service Capabilities,” OTC 7032.20. Coats, E. A. <strong>and</strong> Johnson, K. J.: “Reeled-Tubing Technology Accelerates Coalbed Methane Productionin the Black Warrior Basin,” SPE 21 697.21. Coats, E. A. <strong>and</strong> Marinello, S. A.: “Coiled Tubing Flowline Cuts Wetl<strong>and</strong>s Disturbance,” World<strong>Oil</strong>, December 1993, pp. 75-78.22. Cobb, D. O., Bragg, J. A., Haines, J. R., <strong>and</strong> Putnam, J. S.: “Coiled Tubing Now-Rig Workoversat Prudhoe Bay,” SPE 17592.23. Coker, G. P.: “Evaluation of Coiled Tubing for Production Service,” Cron. 92076ART0044, March16, 1992.24. Cooper, R. E.: “Coiled Tubing in Horizontal Wells,” SPE 17581.25. Copoulos, A. E., Costal, D., <strong>and</strong> Nice, S. B.: “Planning a Coiled Tubing Conveyed ProductionLogging Job in a Horizontal Well,” 1993 SPE Western Regional, Anchorage, May 26-28.26. Coronodo, M. P., Mody, R. K., <strong>and</strong> Craig, G. C.: Thru-Tubing Inflatable Workover Systems,”SPE 22825, Dallas, October 6-9, 1991.27. Courville, P. <strong>and</strong> Avakov, V.: “Coiled Tubing String Management,” 2nd International Conferenceon Coiled Tubing Technology: Operations, Services, Practices, Houston, March 29-31, 1994.28. :“Panel Discussion: Artificial Lift,” 2nd International Conference on Coiled TubingTechnology: Operations, Services, Practices, Houston, March 29-31, 1994.29. Crouse, P. C.: “Advancements in Coiled Tubing Technology,” 5th International Horizontal WellTechnology Conference, Amsterdam, July 13-1 6, 1993.30. Dees, J. <strong>and</strong> H<strong>and</strong>ren, P.: “A New Method of Overbalanced Perforating <strong>and</strong> Surging of Resin forS<strong>and</strong> Control,” Journal of Pet. Eng., May 1994, pp. 431-435.31. Dorman, T. G., Matte, T., <strong>and</strong> Stout, G. W.: “Single Trip Gravel Packing System Used Effectivelyon a Highly Deviated Well,” 2nd International Conference on Coiled Tubing Technology: Operations,Services, Practices, Houston, March 29-31, 1994.32. Doremus, D.: “Coiled Tubing Drilling: Update ‘94,” 2nd International Conference on Coiled TubingTechnology: Operations, Services, Practices, Houston, March 29-31, 1994.18-47
33. Edens, F. J.: “Coiled Tubing Development Schedule,’’ Mid-Continent Business Unit, December10,1991.34. Fowler, H.: “Horizontal Well Servicing by Coiled Tubing Enhanced for High Angle/HorizontalWells,” World <strong>Oil</strong>’s 5 th Horizontal Well Technology Conference, Amsterdam, July 13-1 6, 1993.35. Fowler, S. H. <strong>and</strong> Pleasants, C. W.: “Operation <strong>and</strong> Utilization of Hydraulic-Actuated ServiceTools for Reeled Tubing,” SPE 20678.36. Fram, J. H. <strong>and</strong> Eberhard, M. J.: “Use of Coiled Tubing for Ab<strong>and</strong>oning Shallow Thermal Wells,South Belridge Field, Kern Co., California,” 1993 Western Regional, Anchorage, May 26-28.37. Gantt, L. L. <strong>and</strong> Smith, B. E.: “Advances in the Coiled Tubing Squeeze Cement Process at PrudhoeBay,” 2nd International Conference on Coiled Tubing Technology: Operations, Services,Practices, Houston, March 29-31 1994.38. : “Panel Discussion: Cementing with Coiled Tubing,” 2nd International Conference onCoiled Tubing Technology: Operations, Services, Practices, Houston, March 29-31 , 1994.39. Going, W. S.: “Inhibitor Treatment by Coil Tubing Unit Can Now Be Perforated While MaintainingProduction,” SPE 18891.40. Gollob, K. W.: “Experience with Slimhole Gravel Packs, SPE 24985.41. Gronseth, J. M.: “Coiled Tubing, Operations <strong>and</strong> Services, Part 14,” World <strong>Oil</strong>, April 1993,pp. 43-50.42. Harness, P. E., Hansen, M. D., Terzan, G. A., Fowler, S. H., <strong>and</strong> Golino, F. J.: “An Overview ofReeled-Tubing-Conveyed Production Logging Capabilities in California, SPE 20028.43. He, Xiaojun <strong>and</strong> Kyllingstad, A.: “Helical Buckling <strong>and</strong> Lock-Up Conditions for Coiled Tubing inCurved Wells,” SPE 25370, 1993 SPE Asia Pacific <strong>Oil</strong> <strong>and</strong> <strong>Gas</strong> Conf., Singapore, February 8-10.44. Herben, W. C. <strong>and</strong> Maurer, W. C.: “Coring to 50,000 ft with Coiled Tubing, ASME 91-PET-6, NewOrleans, January 20-24, 1991.45. Hightower, C. M.: “Coiled Tubing, Operations <strong>and</strong> Services, Part 11 ,” World <strong>Oil</strong>, November 1992.46. Hornbrook, P. R. <strong>and</strong> Mason, C. M.: “Improved Coiled-Tubing Squeeze Cementing Techniques atPrudhoe Bay,” SPE 19543.47. Hoyer, C.W.J., Chassogne, A., Vidick, B, <strong>and</strong> Hartley, I. P.: “A Platform Ab<strong>and</strong>onment Program inthe North Sea Using Coiled Tubing,” SPE 231 10.48. Howell, E. P., Smith, L. J., <strong>and</strong> Blount, C. G.:.“Coiled-Tubing Logging System,” SPE 15489.49. Kane, R. D. <strong>and</strong> Cayard, M. S.: “Factors Affecting Coiled Tubing Serviceability,” Pet. Eng. Int.,January 1993, pp. 42-47.50. Kilgore, M. D.: “New Muscle for Coiled Tubing,” OTC 7034.51. <strong>King</strong>, G. E.: “Effective Perforating Design,” F93-P-59, February 22, 1994.18-48
52. <strong>King</strong>, G. E.: “Comments on Coiled Tubing Problems,” Cron. 92076ART0044, March 16, 1992.53. Krause, R. E. <strong>and</strong> Reem, D. C.: New Coiled-Tubing Unit Cementing Techniques at PrudhoeDeveloped to Withst<strong>and</strong> Higher Differential Pressure,” SPEPF (November 1993), p. 260.54. L<strong>and</strong>caster, G. Lohuis, G., <strong>and</strong> Redmond, S.: “The Exp<strong>and</strong>ed Use of Coil Tubing in both Completion<strong>and</strong> Workover Operations,” CIM 88-39-49.55. Latos, G.: “Performance <strong>and</strong> Economy in Downhole Jetting to Remove Deposits,” 2nd InternationalConference on Coiled Tubing Technology: Operations, Services, Practices, Houston,March 29-31, 1994.56. Latos, J. <strong>and</strong> Chenery, D.: “Logging with a Coiled Tubing System,” J. Can. Pet. Tech. (March -April 1988), pp. 81 -84.57. Leggett, R. B., Griffith, C. A., <strong>and</strong> Wesson, H. R., Jr.: “Snubbing Unit Applications in PotentiallyHigh-Rate <strong>Gas</strong> Wells: A Case Study of the Anschutz Ranch East Unit, Summit Co., Utah,”S{E 22924, Dallas, October 6-9, 1991.58. Leising, L. J. <strong>and</strong> Newman, K. R.: “Coiled-Tubing Drilling,” SPE Drilling <strong>and</strong> Completions,December 1993, pp. 227-232.59. Leising, L. J. <strong>and</strong> Rike, A.: “Coiled Tubing Case History,” IADC/S PE 27433, Dallas,February 15-1 8, 1994.60. Lemp, S. P., Wiebe, C., <strong>and</strong> Thomeer: “Downhole Sensors for oled Tubing Stimulations,” 2ndInternational Conference on Coiled Tubing Technology: Operations, Services, Practices, Houston,March 29-31 , 1994.61. Lidisky, D. J., Purcell, J. C., Russell, W. K., Dwiggins, J. L., <strong>and</strong> Coburn, G. S.: “Coiled-Tubing-Deployed Electric Submersible Pumping System,” SPE 26863, OTC, May 3-6.62. Loveking, J. W.: “Control of Calcium Carbonate Scale Using Concentric Tubing at Cos0 GeothermalField,” Trans., Ann. Geothermal Res. Counc. Intl. Geothermal Energy Sym., Kailua-Kona,Hawaii (1990), 14, Part2, p. 1611.63. MacEwen, H.: “Coiled-Tubing-Conveyed Logging Systems,” SPE 18350.64. McMechan, R. <strong>and</strong> Crombie, D.: “Drilling, Completing <strong>and</strong> Fracturing a <strong>Gas</strong> Well with CoiledTubing,” 2nd International Conference on Coiled Tubing Technology: Operations, Services,Practices, Houston, March 29-31 , 1994.65. : “Panel Discussion: Drilling with Coiled Tubing,” 2nd International Conference on CoiledTubing Technology: Operations, Services, Practices, Houston, March 29-31, 1994.66. Melvan, J.: “Coiled Tubing Fill Cleanouts,” 2nd International Conference on Coiled Tubing Technology:Operations, Services, Practices, Houston, March 29-31, 1994.67. Mensa-Wilmot, G. <strong>and</strong> Coolidge, R. B.: “Coiled Tubing Drilling with Specialized PDC Bits,” 2ndInternational Conference on Coiled Tubing Technology: Operations, Services, Practices, Houston,March 29-31, 1994.68. Mirza, T., Budiman, M., Cannan, W. L., <strong>and</strong> Bordelon, T. P.: “Coiled Tubing Workovers in Deep,Hot Wells,” SPE 20427, 1990 Ann. Tech. Conf., New Orleans, September 23-26.18-49
69. Misselbrook, J., Wilde, G., <strong>and</strong> Falk, K.: “The Development <strong>and</strong> Use of a Coiled Tubing Simulationfor Horizontal Applications,” SPE 22822, Dallas, October 6-9, 1991.70. Moore, B.: “The Mechanics of Coupling Completion Equipment to Coiled Tubing,” 2nd InternationalConference on Coiled Tubing Technology: Operations, Services, Practices, Houston,March 29-31, 1994.71. Moore, B. K., Lafin, W. J., <strong>and</strong> Walker, E. J.: “Rigless Completions: A Spoolable Coiled-Tubing<strong>Gas</strong>-Lift System,” SPE 26862, 1993 OTC, May 3-6.72. Mullin, M. A., McCarty, S. H., <strong>and</strong> Plante, M.E.: “Fishing with 1.5 <strong>and</strong> 1.75411. Coiled Tubing atWestern Prudhoe Bay, Alaska, SPE 20679.73. Newman, K. R.: “Coiled Tubing Pressure <strong>and</strong> Tension Limits, SPE 231 31.74. Newman, K. R. <strong>and</strong> Allcorn, M. G.: “Coiled Tubing in High-pressure Wells,” SPE 24793.75. Newman, K., Drake, P., <strong>and</strong> Palmer, R.: “Newman Developments in Coiled Tubing Equipment,”2nd International Conference on Coiled Tubing Technology: Operations, Services, Practices,Houston, March 29-31, 1994.7’6. Newman, K. R. <strong>and</strong> Newburn, D. A.: “Coiled Tubing Life Modeling,” SPE 22820, Dallas,October 6-9, 1991.77. Norton, V., Eden, F., Coker, G., <strong>and</strong> <strong>King</strong>, G.: “Large Diameter Coiled Tubing CompletionsDecrease Risk of Formation Damage,” <strong>Oil</strong> <strong>and</strong> <strong>Gas</strong> Journal, July 20, 1992.78. Ostavang, K., Kopperstad, O., <strong>and</strong> Tailby, R. J.: “Planning, Implementation <strong>and</strong> Analysis ofCoiled Tubing Operations in an Ultra-Long-Reach Well,” 2nd International Conference on CoiledTubing Technology: Operations, Services, Practices, Houston, March 29-31, 1994.79. Papadimitriou, S. <strong>and</strong> Stanley, R. K.: “The Inspection of Used Coiled Tubing,” 2nd InternationalConference on Coiled Tubing Technology: Operations, Services, Practices, Houston, March 29-31.80. Peavy, M. A. <strong>and</strong> Fahel, R, A.: “Artificial Lift with Coiled Tubing for Flow Testing the MontereyFormation, Offshore California,” SPEPE (May 1991), p. 141.81. Pleasants, C. W., Head, D. W., <strong>and</strong> de Ruiter, J.: “Design Testing <strong>and</strong> Field Use of a New SelectiveReeled Tubing Well Stimulation System,” SPE 22826, Dallas, October 6-9, 1991.82. Plummer, M. A., Peavy, M. A., <strong>and</strong> Cooke, J. C.: “Through Tubing Gravel Packs: Gulf of MexicoCase Histories,” 2nd International Conference on Coiled Tubing Technology: Operations, Services,Practices, Houston, March 29-31, 1994.83. Purcell, J. C. <strong>and</strong> Moore, B. K.: “How to S<strong>and</strong> Wash Large Tubulars with Coiled Tubing,” Pet.Eng. Int., August 1992, pp. 42-45.84. Rademaker, R. A., Olszewski, K. K., Goiffon, J. J., <strong>and</strong> Maddox, S. D.: “Coiled-Tubing-DeployedDownhole Video System,” SPE 24794.85. Ramos, A. B., Fahel, R. A., Chaffin, M., <strong>and</strong> Pulis, K. H.: “Horizontal Slim-Hole Drilling withCoiled Tubing: An Operator’s Experience,” JPT, October 1992, p. 11 19.18-50
86. Rich, D. A. <strong>and</strong> Blue, T. H.: “Coiled Tubing, Operations <strong>and</strong> Services, Part 13,” World <strong>Oil</strong>, March1993, pp. 67-76.87. Sas-Jaworsky, A.: “Coiled Tubing, Operations <strong>and</strong> Services, Part 12 - Stimulation,” World <strong>Oil</strong>,January 1993, pp. 39-43.88. Sas-Jaworsky, A.: “Coiled Tubing, Operations <strong>and</strong> Services, Part 5, World <strong>Oil</strong>, April 1992,pp. 59-66.89. Sas-Jaworsky, A.: “Coiled Tubing, Operations <strong>and</strong> Service, Part 3,” World <strong>Oil</strong>, January 1992,pp. 95-102.90. Sas-Jaworsky, A.: “Coiled Tubing, Operations <strong>and</strong> Services, Part 2 - Workover Safety,” World<strong>Oil</strong>, December 1991, pp. 71 -78.91. Sas-Jaworsky, S. <strong>and</strong> Williams, J. G.: “Potential applications <strong>and</strong> Enabling Capabilities of CompositeCoiled Tubing,” 2nd International Conference on Coiled Tubing Technology: Operations,Services, Practices, Houston, March 29-31, 1994.92. Schutz, R. W. <strong>and</strong> Thomas, D. E.: “Corrosion of Titanium <strong>and</strong> Titanium Alloys,” ASM MetalsH<strong>and</strong>book, 9th edition, vol. 13 - Corrosion, pp. 669-706, ASM Int. 1987.93. Slaton, Mike: “Coiled Tubing for Pipelines,” Pipeline Digest, November 1992, pp. 9-11.94. Stephens, R. K. <strong>and</strong> Welch, J. L.: “Coiled Tubing Remedial Straddle Completions,” 2nd InternationalConference on Coiled Tubing Technology: Operations, Services, Practices, Houston,March 29-31 , 1994.95. Tailby, R. J.: “Pumpdown Assistance Extends Coiled Tubing Reach,” World <strong>Oil</strong>, July 1992,pp. 55-61.96. Tailby, R. J., Yonker, J. H., <strong>and</strong> Pearce, J. L.: “A New Technique for Servicing Horizontal Wells,”SPE 22823, Dallas, October 6-9, 1991.97. Taylor, D. B. <strong>and</strong> Plummer, 8. A.: “<strong>Gas</strong> Well Stimulation on Using Coiled Tubing <strong>and</strong> Acid with aMutual Solvent,” SPE 41 15.98. Teel, M. E.: “Coiled Tubing 1994: Enhanced Value Through Innovation,” World <strong>Oil</strong>, January1994, pp. 35-43.99. Thompson, J. M., Lewis, P. C., Scott, S., <strong>and</strong> Fowler, S. H.: “Full Body Quenched <strong>and</strong> TemperedCoiled Tubing: Theory vs. Field Experience,” 2nd International Conference on Coiled TubingTechnology: Operations, Services, Practices, Houston, March 29-31, 1994.100. Tipton, S. M. <strong>and</strong> Brown, P. A.: “Monitoring Coiled Tubing Fatigue Life,” 2nd International Conferenceon Coiled Tubing Technology: Operations, Services, Practices, Houston, March 29-31,1994.101. vanAdrichem, W. <strong>and</strong> Adam, B.: “Safety Factor is Important in Design of CT Job,” The American<strong>Oil</strong> <strong>and</strong> <strong>Gas</strong> Reporter, March 1993, pp. 74-79.102. vanAdrichem, W. <strong>and</strong> Newman, K. R.: “Validation of Coiled Tubing Penetration Prediction in HorizontalWells,” SPE 24765.18-5 1
103. Walker, E. J.: “How Loads Affect Coiled Tubing Life,” World <strong>Oil</strong>, January 1992, pp. 47-49.104. Walker, E. J. <strong>and</strong> Schmohr, D. R.: “The Role of Coiled Tubing in the Western Operating Area ofthe Prudhoe Bay Unit,” SPE 22959.105. Welch, J. L. <strong>and</strong> Stephens, R. K.: “Coiled Tubing, Operations <strong>and</strong> Services, Part 9,” World <strong>Oil</strong>,September 1992, pp. 81-85.106. Welch, J. L. <strong>and</strong> Whitlow, R.: “Coiled Tubing, Operations <strong>and</strong> Services, Part 8,” World <strong>Oil</strong>,September 1992, pp. 89-95.107. Wesson, W. R.: “Coiled Tubing Pipelines <strong>and</strong> Flowlines: Update 94,” 2nd International Conferenceon Coiled Tubing Technology: Operations, Services, Practices, Houston, March 29-31,1994.108. Conversation with Jim Gouveia <strong>and</strong> Din0 Martin, Amoco Canada, March 31, 1992.109. Quality Tubing, Inc., “Coiled Tubing Technical Manual,” 1991, (71 3) 456-0751,11 0. “Advances in Coiled Tubing Drilling <strong>and</strong> Completions at Prudhoe Bay,” 2nd International Conferenceon Coiled Tubing Technology: Operations, Services, Practices, Houston, March 29-31,1994.18-52
Appendix 18.AIn wells that cannot be lifted continuously, intermittent lift is necessary. In the intermittent operations,the nitrogen is injected for a short time at regular intervals until the tubing is evacuated <strong>and</strong> thenstopped to allow fluid to accumulate. The shutin time <strong>and</strong> the flow time can be calculated from anequation by Nind.AV =P-P- [(H> (Wl -1-WIA1-exp [ (-0.0239) (PI) ( WIA) (A 7) ]5.614where:AV = volume of liquid buildup in CT/tubing annulus during time AT bblAT =time interval during liquid buildup, hourP, = reservoir static pressure, psigPw = wellhead pressure, psigH = distance between coiled tubing shoe <strong>and</strong> reservoir, ftW = average liquid gradient, psi/ftA = cross sectional area of coiled tubinghubing annulus, ft2PI = productivity index, STB/d/psiIn fluid lift with nitrogen gas, the choke is usually completely open to maximize liquid buildup rate duringthe waiting time: therefore, pb the wellhead pressure, is usually zero. When Pw = 0, the equationcan be rearranged to:AVx( W/A) - 1 - exp [ (-0.0239) (PI) ( W/A) (AT> 1pr- [(H)(Wl 5.614A graph of [AT(WA)]/[PA(h)(W)}] vs. [(W/A)AT] results in a multi-plot such as shown in Figure A.21These curves are parametric (sets the limits of) in PI. The value of a curve of this type for Piestimationshould be apparent: all of the data are available at the well site. W<strong>and</strong> AVare measured from recoveredfluid, AT<strong>and</strong> Hare set by the operator <strong>and</strong> A is fixed for any tubing configuration.A data point set is generated by each lift <strong>and</strong> successive lifts define the curve <strong>and</strong> the approximate PI.An example of the data plotted on the curve is shown in Figure B.21 Although the P1 generated in thismanner is an approximation, it is useful for a first appraisal. Graphing the points rather than relyingsolely on the equation allows abnormal data points to be spotted. These abnormal points are usuallyassociated with errors in measurements of produced fluids. Graphing the results also allows evaluationof how waiting time <strong>and</strong> coiled tubing shoe depth affect the liquid recovery, Figures C <strong>and</strong> D.The assumptions necessary for this method are:1. The liquid recovered has the same density as the one in the coiled tubinghubing system (e.g., littleor no solution gas).2. Each single lift is able to produce all the volume accumulated in the coiled tubing/tubing annulus.3. No liquid fallback is experienced (no change in film on annular surfaces).4. Liquid starts to build up in the annulus only when the previous lift is finished.18.A-53
Field results as reported by De Ghetto have shown in most cases that the hypotheses are acceptable.The reliability of the calculated PI is best when:211. P1 itself is low (less than 0.5 STB/d/psi).2. ATis high (greater than 2 hrs).3. Duration of each lifting phase is short (1-2 hrs).4. The nitrogen injection rate is high (greater than 500 SCF/m).Field experience has shown that optimum lift rate is between 500 <strong>and</strong> 1000 SCF/m. Higher nitrogeninjection rates are not usually justified because the time of injection is not usually shortened by thehigher rates. Maximum drawdown with this technique occurs at the beginning of the liquid buildup (theend of the previous nitrogen lift). This is also affected by the depth of the coil tubing shoe since thisdepth affects the back pressure of the static fluid height over the formation. The shorter the distancebetween the coil tubing shoe <strong>and</strong> the reservoir, the better the reliability of the PI. However, the coil tubingmust not be spotted so close as to allow nitrogen to enter the oil reservoir. Typical placement separationof the coil tubing shoe <strong>and</strong> the top of the perforations is 300 ft.Common problems with the method are high solution gas oils <strong>and</strong> oils that form froths, foams <strong>and</strong>emulsions with the gas.18.A-54
Chapter 19: Workover FishingFishing is the recovery of tools or equipment that have been lost in the well. The object to be removedis the fish. It may be any tool, equipment or other object in a cased or uncased wellbore that stops orretards operational progress. In drilling operations, common fish are twisted off pipe, lost drill collars,downhole tools or bit cones.’ In production operations, the fish may be parted pipe or rod strings,pumps <strong>and</strong> tools. Fishing success is dominated by experience. That is, the success of fishing operationsis heavily dependent upon the experience of the operator plus a measure of both preparation<strong>and</strong> patience. For an in-depth look at fishing, the reader is referred to “Fishing <strong>and</strong> Casing Repair” byJ. A. Short, or to ic<strong>Oil</strong>well Fishing Operations: Tools <strong>and</strong> Techniques’’ by Gore Kemp.Workover fishing requires special tools run on slickline, wireline or tubing (depending on fish weight),that surround or snag the fish. There are a variety of fishing tools to fit the large variety of common<strong>and</strong> uncommon fish. These tools fall into basic categories. Catch tools are tools designed to grab aparticular type of surface. Catch tools for tubular fish are overshots with box-end-down tool joints(threaded connections) that mate with the up-looking pin of the tubing or casing. The overshot is themost common catch tool. It is dropped or rotated over the backed off section of the lost tubular string(the fish). The overshot is conical inside <strong>and</strong> has ridges that grip the fish <strong>and</strong> hold it for the trip back tothe surface. Figure 19.1 contains various views of overshots with special inserts <strong>and</strong> mills for preparationof a surface. Most overshots latch onto threaded surfaces, cut new threads with hardened diesbuilt into the fishing tools or grip the outside surface with thread-like projections. Because most tubingfish do no st<strong>and</strong> straight up in the center of the hole, additional devices for guiding a fish, which maybe leaning on the wall, into the fishing tool are st<strong>and</strong>ard equipment. These tools, principally wall hooks<strong>and</strong> guides (also called mule shoes) are shown in Figure 19.2. Overshots are the primary fishing tool<strong>and</strong> are preferred for almost all fishing operations. They are often the first tool tried because they donot usually damage or enlarge the top of the fish.TOP SUBBOWLBASKETGRAPPLEMILLCONTROLPACKERDie CollarGUIDE(Gotco)Figure 19.1 : Types of overshots.Spears are the second group of catch devices, but are designed to fit inside the fish much like screwinga bolt into an uplooking nut. Spears are usually threaded cones <strong>and</strong> designed to screw into uplookingcollars. Details of latch type spears <strong>and</strong> threaded taps <strong>and</strong> spears are shown in Figure 19.3.Operators use spears as a last resort because unsuccessful efforts with the spear often splits the fish.The splitting action wedges the fish out <strong>and</strong> makes further recovery operations more difficult.19-1
(Gotco)Figure 19.2: Fish engaging devices(Gotco)Figure 19.3:Above: threaded tapRight: releasing spearTools for nontubular fish include magnets, Figure 19.4, junk baskets <strong>and</strong> bailers, Figure 19.5, wirelinegrabs, Figure 19.6, <strong>and</strong> other specialty tools. Magnets are useful for any steel object within the mag-19-2
net’s strength range that has a relatively flat up-looking surface for magnet contact. Drill bit teeth,cones, bearings, slips, tongs <strong>and</strong> other debris are c<strong>and</strong>idates. Fish with irregular surfaces should beretrieved with other devices. Junk baskets are useful for retrieving bit teeth, mill cuttings, <strong>and</strong> smallmetal pieces that can be lifted by circulation at the bit. Any time wireline is lost (or is even a possibility)wireline fingers or grabs should be run. Wireline poses a problem because it passes along the side ofthe fishing tool <strong>and</strong> can stick the fishing string by becoming engaged in tool openings. It is especiallyhazardous for wireline fishing tools since multiple str<strong>and</strong>s may become entangled <strong>and</strong> the strength ofthe multiple str<strong>and</strong>s exceeds the active single str<strong>and</strong> strength in the fishing operation. The wireline fingersare nearly the same as the id of the tubing <strong>and</strong> force the wire into a funnel where it can betrapped by a wedge tool when the tool is picked up. Fishing wire can require many trips in somecases. Wireline grabs have barbs that can hook onto a snarl or loop in the lost wire. Of the two basictypes of wireline grabs, the overshot with barbs on the inside of the arms is preferred to the spear. Thespear can spread the mass of wire, sticking the entire fishing assembly.(from Gotco)(from Magnetic <strong>Oil</strong> Tools, Inc.)Figure 19.4: Two views of tubing run magnets.The one part of a fishing assembly that is used every time are the jars. Without them, wireline isalmost useless to free any stuck object. Jars are like a slide hammer <strong>and</strong> are featured in Chapter 18.They increase the pulling efficiency of the wireline or tubular goods. The jar contains a mechanism forinternally releasing, allowing the wireline to accelerate <strong>and</strong> then suddenly reengaging, delivering ajolt.* Jarring increases the pull on the fish, with only a momentary increase in the shock load on thewireline. Sufficient force is applied to the pipe or wireline at the surface to bring the tension at the jarto the triggering value (overpull). The overpull must be below the maximum tensile strength of the fishingstring. After the jar is triggered, the released ends (the hammer <strong>and</strong> anvil) are free to move towardeach other. The wireline or pipe above the jar are accelerated under no load <strong>and</strong>, upon re-engagementof the jar, the energy is transmitted to the fish. Jarring is a complex operation that uses themovement of the wireline or tubing to store energy that is suddenly directed to the fish. It creates animpact with much larger inertial force than is possible with a straight pull.Some operations tools that are routinely fished are designed with a special fishing neck that allows afishing tool to clip on for removal.An idea of what the top of the fish looks like is probably the best “tool” available. To obtain this information,soft lead impression blocks are often run <strong>and</strong> set down on the fish to give an idea of its shape<strong>and</strong> p~sition.~ The impression blocks are a useful tool but should be run on wireline <strong>and</strong> must only beset down once to avoid double impressions. Other alternatives include the downlooking televisioncamera if the well is dry or if clear water can be circulated into the well. The easiest information on thefish can come from an accurate pipe tally <strong>and</strong> i.d. <strong>and</strong> 0.d. measurement of everything that goes into19-3
(Hendershot)Figure 19.5: Junk basket (above) runon pipe <strong>and</strong> s<strong>and</strong> pumpbailer (right] run on wireline.(Cavins)Pin threadPishins neckyousinglrongSsZS(Camco)Figure 19.6: A wireline grab tool.19-4
the well. The best fishing “luck” is a knowledge of exactly what is in the well at any time. Measurements<strong>and</strong> sketches of downhole equipment are a precious commodity when tools or equipment arelost. One problem in a fishing operation is that accidentally dropped tools, chain, slips, or other equipmentmay not be reported.The length of time that is spent on fishing will vary from company to company, but there is a limit atwhich most companies will suspend fishing operations <strong>and</strong> sidetrack or ab<strong>and</strong>on the weL4 The correctstrategy in a fishing operation is to minimize the losses. There are several decision analyses availablefor fishing <strong>and</strong> most are based on the current depth of the well, the cost of the rig to give the maximumnumber of fishing days before ab<strong>and</strong>onment. In areas with high rig costs, sidetracking is usually moreprofitable than several days fishing if the well is still at a shallow depth.The following “rule of thumb” equation from Brouse provides one company’s indication of the maximumnumber of days that a fishing operation should continue before sidetrack operations begin.5Nd = maximum allowable number of days fishingV, = total replacement value of the fishing the hole, dollarsC, = cost of redrilling the interval or sidetracking, dollarsCd = rig, operations, <strong>and</strong> fishing cost, dollars per day.There are no set rules that can be used in every fishing job. Guidelines <strong>and</strong> descriptions of tools areavailable from a number of sourcesmGWhen running fishing tools in a well, the string should be run at a moderate speed to avoid compressionof the fluid below the tool <strong>and</strong> ramming from contacting the fish higher than expected in the hole.Care must also be exercised when pulling out of a hole so that swabbing action is not created. Whenwashing or milling in a well, the amount of cuttings that are coming out of the well should be estimatedto determine if a bridge could form above the tools from incomplete cleaning of the well.Fish destruction tools are mills <strong>and</strong> explosives that are designed to remove the fish from the hole bygrinding or blowing it into small enough pieces so that it can sink into the rat hole. Mills are hard surfacecutters designed to grind metal into small pieces that can be circulated from the well. Other usesinclude milling out collapsed casing (taper <strong>and</strong> watermelon mills), cutting windows in casing for sidetrackoperations or preparing the surface of a fish to be threaded. Examples are shown in Figure 19.7.There are many different ideas about milling. Walker offers the following comments:61. Metal will only cut at a certain rate, thus there is no benefit in adding excessive weight to astring. Addition of large amounts of weight will cause premature wear on the mill, buckling of thepipe, or cause a rapid breakup of the mill surface.2. Knowing the type of metal to be milled determines the weight. If the fish is of soft metal, <strong>and</strong>more weight will be added, a faster cutting rate is expected. If hard metal is encountered, lessweight should be run.3. Proper mill speed will vary with the type of equipment being milled but should be in the range of100-1 50 rpm for tightly-held material. Mills that are turned too slow will torque up <strong>and</strong> turn loosewith a jerking motion which may cause mill fatigue <strong>and</strong> break up. When the junk turns beneaththe mill, the milling rate is very slow <strong>and</strong> mill damage is common.19-5
g fluid must get the ~ ~ out of ~ hate, ~ If there ~ is ins g swilt run ~ ~ n ~ i on ~ the ~ cuttings o ~ s it has ~ y created <strong>and</strong> will nat reach the main object.steel, very high yield pthe way <strong>and</strong> avoid regrindnk.ften a yield of I00 lbfl0~ u ~ This ~ applies ~ ~ to s .eded to get thedows as well asthe hole.k off from the stuck pipe justbe used to wash over the fish.le, do not back off in an areaft to get back anto the fish. If a fishbest to back off at feast two jointsoff at a point where it would notoke loose <strong>and</strong> felt to the bottom oflocatfon of Stuck Fofn?~~d~~ating tools are used to det~rmi~e the free point tocation above the stuck part of a string so thatthe free hanging pipe can be backed off or shot off with explosives to decrease the total weight of thefish,When pipe becomes stuck, successful recovery efforts are depe~d~~t on know~ng the location of thesticking point. Using charts that give pipe stretch vs, applied bad can a~proxi~a~e the depth to thestuck point, Under a given load, there be a certain ~ ~ o of ~ stretch n t i e pipe per unit length ofthe pipe. By ~ iacj~~ the pipe in tension at a measured load, the stretch of the pipe from the stuck pointto the surface can be measured. if this length is divided by the unit stretch at the applied load, the~ ~ of free n pipe ~ (depth t to ~ the stuck point] can be found.
where:LK= free length of pipe (ft)= constant based on area of pipe, from the table belowConstants Used to Calculate Stuck Depth2 in.2.5 in.Tubing SizeDrill Pipe Size:2.8/ in. (10.4 Ib/ft)3.5 in. (13.3 Ib/ft)4.5 in. (16.6 Ib/ft)Casing:5.5 (1 / Ib/ft)7.0 (23 Ib/ft)8.625 (32 Ib/ft)K value3 ,4,500,0001 ,8,800,00010.800.000EP= elongation due to pull (in.)= applied pull (Ib)This procedure works best in straight holes. In deviated wells, the friction from pipe drag influencesthe reading.Several logging devices are also available for locating the point of sticking or giving information aboutthe fill surrounding a pipe, although all are limited in the information that they can convey. Most canonly accurately locate the uppermost stuck point, but cannot give information about the pipe below.Freepoint logs consist of a bar of metal with axial <strong>and</strong> transverse strain gauges to measure longitudinal<strong>and</strong> shear stress. Gauges at the top <strong>and</strong> bottom of the tool allow a differential to be generated. Aslong as the tool is completely in the free pipe or completely in the stuck pipe, the difference betweengauge reading is zero; but when the top of the stuck point is between the gauges, the difference isnoticeable. The tool is mounted in a wireline conveyed logging tool. At selected depths, the tool iscoupled to the casing with an electromagnet or extendable slips at the top <strong>and</strong> bottom of the loggingtool. After the coupling, a strain is placed on the pipe at the surface by straight pull or rotationaltorque, <strong>and</strong> the reading from the strain gauges is noted. The pipe stretch method is usually run first toget a rough approximation where the pipe is stuck.A small explosive charge can be added at the bottom of the tool to assist in backoff operations. Afterthe stuck point is identified, the first tool joint (coupling) above the stuck point is identified with a collarlocator, the charge is positioned in the joint, <strong>and</strong> tension <strong>and</strong> torque are applied at the surface. Whenthe charge is detonated, the coupling is momentarily exp<strong>and</strong>ed <strong>and</strong> heavily jarred, <strong>and</strong> the pipebreaks out (hopefully) at this point. A synopsis of how to apply torque is shown in Figure 19.8 (fromSchlumberger). The problems are obvious: (1) the string may unscrew at some other point, or (2) itmay not unscrew at all. Success with the tool is experience dominated; the application of the "right"torque <strong>and</strong> tension loads <strong>and</strong> the even makeup of the rest of the string are critical. This log is mostoften used to define the interval of pipe that can be removed easily before washover operations.19-7
Other types of tools are based upon sonic measurements much in the same manner as the cementbond log. These tools identify fill around the casing.If the pipe cannot be unscrewed, it is usually parted by an explosive or chemical cutter. The chemicalcutters use a special halogenated acid, sprayed at high pressure from a tool that severs the pipe inseconds. The explosive cutter is a modified shaped charge that cuts the pipe with a pressure pulse.Both systems are functional but neither is perfect.<strong>References</strong> - Fishing1. Porter, E. W.: “Fishing is More Art than Science,” <strong>Oil</strong> & <strong>Gas</strong> J. (September 21, 1970), pp. 95-96.2. Skeem, M. R., Friedman, M. B., Walker, B. H.: “Drillstring Dynamics During Jar Operation,”(November 1979), pp. 1381-1 386.3. McDaniel, G. L.: “A Theoretical <strong>and</strong> Experimental Study of Jarring,” Unsolicited Manuscript,SPE 10459.4. Harrison, C. G.: “Fishing Decisions Under Uncertainty,” J. Pet. Tech. (February 1982), pp. 299-300.5. Brouse, M.: “How to H<strong>and</strong>le Stuck Pipe <strong>and</strong> Fishing Operations,” World <strong>Oil</strong> (January 1983),pp. 123-126.6. Walker, G.: “Fishing,” SPE 13360, Eastern Regional Mtg., Charleston, October 31 -November 2,1984.7. Hutchinson, S. 0.: “Impression Tool Defines Downhole Equipment Problems,” World <strong>Oil</strong> (November1974), pp. 74-80.8. , “Completion Practices ’83: Well Designs for 8 U.S. Areas,” World <strong>Oil</strong> (May 1983), pp. 59-70.9. “Stuck Pipe: Causes <strong>and</strong> Prevention,” <strong>Oil</strong>field Review, October 1991, pp. 13-26.10. “Stuck Pipe: Jars, Jarring, <strong>and</strong> Jar Placement,” <strong>Oil</strong>field Review, October 1991, pp. 52-61.11. “Stuck Pipe: Backoff Basics,” <strong>Oil</strong>field Review, October 1991, pp. 48-51.12. “Stuck Pipe: Techniques for Breaking Free,” <strong>Oil</strong>field Review, October 1991, pp. 27-3513. Schofield, R., Whelehan, 0. P., Baruya, A.: “A New Fishing Equation,” SPE 22380, InternationalMeeting on <strong>Petroleum</strong> <strong>Engineering</strong>, Beijing, China, March 24-27, 1992.14. Pipe Recovery Guide, Atlas Wireline Services, 1987.15. Short, J. A.: “Fishing <strong>and</strong> Casing Repair,” PennWell Books, 1981.<strong>References</strong> - Milling1. Harvey, H, Lynde, G.:”New Milling Tool Achieves High Penetration Rate,” OGJ, Sept. 15, 1986,pp. 92-93.19-8
2. ,:”Mill Munches its Way Through Metal,” Drilling Contractor, Aug/Sept. 1986, p. 26, 28.3. Moore, S. D.:”Occidental Improves North Sea Milling Operation,” Pet. Eng. Intl., Jan 1987, p. 32,34, 37.4. Motley, T., Hollamby, R.:”Novel Milling Fluid Saves Time, Cuts Cost,” World <strong>Oil</strong>, pp. 32-36.19-9
Appendix 19.AThe total potential energy stored in the jar tool <strong>and</strong> fishing string during the initial pull is easily calculated,but the conversion of energy into motion <strong>and</strong> useful work after jar release is not easily calculated.Two fishing strings of different equipment or configuration of the equipment but the same storedpotential energy will not produce the same amount of useful work. McDaniel makes this conclusion inhis study of Jarring where the Jar was modeled as four separate areas3 He states that when a rod isstretched <strong>and</strong> released on one end, that end will take off at the free contraction velocity,where:Vfc = free contraction velocity, ft/secP =forceC = speed of sound in material, Wsec. 16,800 Wsec in steelE = Young’s modulusA = cross sectional areaA velocity wave of magnitude Vfc will move from the released end toward the other end. The front ofthe wave travels at the speed of sound in steel. The material ahead of the wave is at rest <strong>and</strong> thematerial behind the wave is traveling at Vfc McDaniel points out that if the strain energy stored in therod is set equal to its kinetic energy,where:PLAEpV=force= length= cross sectional area= Young’s modulus= density of string material= velocityThe variables that affect the force <strong>and</strong> energy transmitted to the area of the fish include collar size(when using drill collars), pipe size, maximum safe overpull, collar string length, <strong>and</strong> position of the jarin the collar string. Skeem describes the balance between impact force <strong>and</strong> impulse (pull) dictated bythe position of the jar?“Overpull <strong>and</strong> collar cross section define the hammer speed at release. The higher hammer speed atimpact, due to the acceleration of the collars above the jar, is determined by the ratio of the collar <strong>and</strong>pipe cross sections, the stroke, <strong>and</strong> the jar position. For a fixed number of collars between the stuckpoint <strong>and</strong> the drillpipe, the impact speed <strong>and</strong>, hence, the impact force increases as the jar is placedfurther from the stuck point. On the other h<strong>and</strong>, the impulse delivered decreases under the same conditions.This inverse relation between impact force <strong>and</strong> impulse delivered implies a (defined) jar placementexists for maximum jarring effectiveness depending on the combination of impact force <strong>and</strong>impulse desired. The latter is governed by the nature of the sticking force”This relationship is shown schematically in Figure 26.7 for jar position vs. force. Other data is availablein the work of Skeem, et al, <strong>and</strong> of Daniel, et al.19.A- 10
Chapter 20s Plug <strong>and</strong> Ab<strong>and</strong>onment ProceduresEvery well will eventually have to be plugged <strong>and</strong> ab<strong>and</strong>oned. If the process is done correctly, it is apermanent procedure, if not, the well fluids can leak to the surface, allow surface fluids to leak into thereservoir or allow crossflow of produced fluids from one zone to another. Any of these problems cancause extensive environmental <strong>and</strong>/or reservoir damage.Leaks of brine <strong>and</strong> hydrocarbons into domestic water drinking supplies are an increasing problemfrom producing or ab<strong>and</strong>oned oil <strong>and</strong> gas wells. The information in the following paragraphs was generatedin the U.S. by the General Accounting Office <strong>and</strong> reflects a problem which must be settled byeffective completion, monitoring, <strong>and</strong> ab<strong>and</strong>onment of all types of wellbores.’ The most commonsources of contaminant entry into underground drinking water supplies were:1. Cracks in injection wells. This may be splits in the casing with subsequent matrix injection oruncontrolled fracturing that has linked perforated productive zones to fresh water aquifers orother zones that allow cross flow to the aquifers. (It may also be channels in the cement. -author’s note)2. Injection directly into drinking water zones. This is generally the case where corrosion or accidentalperforations have opened up a channel into underground freshwater zones.3. Injected brine cross flow through improperly plugged <strong>and</strong> ab<strong>and</strong>oned wells. This method of entryis most common in old fields where channels exist along the outside of casing through a poor primarycement job or where wells not in use allow brine to flow from the injected zone up to freshwaterzones.Of the approximately 1.2 million ab<strong>and</strong>oned oil <strong>and</strong> gas wells in the United States12 over 200,000 ofthese wells have been judged to be not properly plugged.’ Since the volume of produced salt waterbrine exceeds the volume of oil production by approximately 7:l in the U.S., the brine leakage problemcan be severe. Chloride concentration of most oil field brine ranges from a few hundred to over150,000 ppm while the drinking water limit is 500 ppm, thus it does not take much chloride to effectivelycontaminate a drinking water zone.The EPA (Environmental Protection Agency) under the UIC (Underground Injection Control) programhas placed the following designations on disposal wells.Class 1 - hazardous waste, non-hazardous industrial waste, <strong>and</strong> municipal waste. The disposalzones of these wells must be located deeper than the deepest source of drinking water.Class 2 - oil <strong>and</strong> gas operations.Class 3 - special processes such as mineral productionClass 4 - hazardous waste above underground zones of drinking water. (These wells are now strictlyi I legal .)Class 5 - All other injection wells which do not fit in one of the above categories.Of the 253,000 injection wells in the United States, 160,265 were a Class 2. These were located in 31states.20- 1
The guidelines for active injection wells are beginning to be tightened <strong>and</strong> the P&A procedures onolder wells are being reviewed in almost all U.S. areas to reduce the risk of underground contamination.The primary plan then for P&A procedures is to permanently isolate both the producing intervals,the fresh water zones, <strong>and</strong> the zones of potential cross flow. Never depend upon the casing to form alasting barrier to flow.Legal RequirementsAb<strong>and</strong>onment of any type of well is covered by very specific (<strong>and</strong> often inconsistent) regulationsdesigned to prevent pollution. Because this is a book on well completion, the reader is left to dig outthe local laws on plug <strong>and</strong> ab<strong>and</strong>onment. The true purpose of the ab<strong>and</strong>onment job is to stop all theindividual permeable zones from flowing or accepting fluid <strong>and</strong> that is where this book will focus.There are a number of procedures <strong>and</strong> products that can be used for P&A jobs. The correct type touse will depend upon local regulations <strong>and</strong> how long the well is to be ab<strong>and</strong>oned <strong>and</strong> the severity ofthe well conditions. The trend in all environmental regulations is for the rules to become tougher. Thebest approach to P&A, therefore, is to do the job right. Initial plug <strong>and</strong> ab<strong>and</strong>onment costs may behigh, but they are small compared to the costs of cleanup of problems caused by a leaking well.Setting Cement PlugsDownhole plugs of cement are usually set to seal off, either temporarily or permanently, a zone ofunwanted production or a zone that will be held in reserve for an extended period of time. Plugs arealso useful in sealing off an entire well when the well is to be plugged <strong>and</strong> ab<strong>and</strong>oned. Cement plugsare only one of several methods of sealing off a zone; however, if they are placed correctly, they representthe most leak proof <strong>and</strong> mechanically trouble free of the alternatives.Plugging a well with cement may seem to be an easy task, but the correct use of cement to obtain ausable plug requires skilled operators <strong>and</strong> good equipment. There are three basic factors which influencethe setting <strong>and</strong> permanence of a cement plug: (1) the condition of the mud or drilling fluid in thehole, (2) the volume <strong>and</strong> type of cement used, <strong>and</strong> (3) the placement technique used to set the plug.The first thing considered in a plugging operation is the conditioning of the mud or wellbore fluid currentlyin the hole. Conditioning the mud in this case means bringing it to the correct density, viscosity<strong>and</strong> chemical content. If fluids are not properly conditioned prior to contact of cement, the cement plugmay never be successfully set. A number of the additives which are currently used to give mud specialproperties have the effect of retarding cement slurries to the point of not setting at all. The compositionof the mud in the hole must be known along with its general condition before a plug job can be successfullydesigned. Most failures of plugging operations are due directly to mud contamination orinability to “float” the cement on the mud in the hole.4~~ The best fluid that can be used to set a cementplug is a freshly prepared, gelled mud slurry which has sufficient density or a high enough viscosity tokeep the cement plug from migrating up or down the hole due to the difference in density between thecement <strong>and</strong> the mud. Cement has a density of approximately 16.4 Ib/gal for regular Class G <strong>and</strong> Hcement blends down to 11.5 Ib/gal or less for light weight blends. Mud in most P&A jobs range from 9to 10 Ib/gal. If the density of an ungelled mud is more than the cement used for the plug, the cementslurry will finger down the wellbore <strong>and</strong> a plug will not be created. The fingering of the cement throughthe mud also mixes the mud with the cement (contaminating the cement) <strong>and</strong> may prevent the plugfrom setting, even when very large volumes of cement are used. The only way to float a heavy cementon top of a lighter mud is to increase the viscosity of the mud high enough to resist the intrusion of thecement. This “resistance to intrusion” of the cement is similar to the yield point, or first resistance toflow, in a Bingham plastic fluid. Although viscosity alone may work in a Newtonian fluid, the yield pointor “initial stiffness” of the Bingham plastic fluids will be an advantage in plug setting without requiringunneeded <strong>and</strong> expensive viscosity.The second factor of plug setting is the selection of the plug material. A cement slurry for a plug musthave durability in contact with the drilling fluids in the hole as well as good bonding characteristics tothe pipe or formation. A long enough column of cement should be used so that it is capable of with-20-2
st<strong>and</strong>ing the weight of drill pipe without being pushed out of position. The bond with the formation iscritical to the success of a plug both from a adhesion st<strong>and</strong>point <strong>and</strong> from the elimination of any leakageinto or out of the permeable zones. Increasing the bonding to the formation is accomplished bycleaning the mud cake from the wall <strong>and</strong> selection of the proper place for setting the plug. Cleaning ofthe mud cake <strong>and</strong> other natural accumulations from the bore hole wall requires scratchers or abrasionby preflushes containing dispersants or other materials to facilitate cleaning of the wall. As with primarycementing, however, when the formation-masking deposits are removed, leakoff will beincreased. As an integral part of well completion, plug <strong>and</strong> ab<strong>and</strong>onment procedures have the samefirst goal: WELL CONTROL. Never assume that a P&A job cannot blow out - high pressure salt waterflows are common <strong>and</strong> can be extremely damaging to surface environment <strong>and</strong> shallow fresh watersupply s<strong>and</strong>s.The primary objectives in plug <strong>and</strong> ab<strong>and</strong>onment procedures are: (1) to prevent the contamination ordepletion of any formation based resource, (2) to prevent communication of subterranean fluids <strong>and</strong>surface fluids, <strong>and</strong> (3) to safely secure the surface of the well so that accidental entry is impossible.Many of the cave-ins around old wellheads result from the setting of poor quality or insufficient lengthplugs. When the steel casing corrodes sufficiently, surface water leakage is possible <strong>and</strong> the flow ofwater may carry very large volumes of soil into the well, creating surface <strong>and</strong>/or underground washouts.Never expect the steel casing to be a long term, integral part of the plugging system in the wellunless it is both surrounded by <strong>and</strong> filled with cement.The type of cement used should also match the formation characteristics. For instance, a salt saturatedcement is useful for plugs set in salt formations. In most cases, an API Class G or H cement witha dispersant to allow low water content is the best cement blend. The low water content allows aslightly more dense cement slurry which may achieve optimum strength <strong>and</strong> resist mud contamination.The low water content cement also achieves strength more rapidly than a higher water contentcement <strong>and</strong> has better fluid loss control than other cements. It is often advantageous to use a swellingcement when placing a plug to get the benefit of its better bonding characteristics caused by the slightexpansion of the cement while setting.Placement of the plug is the third critical factor of plug procedures. The physical location of a plug maydiffer with its intended location. The problem is usually caused by the higher density cement fingeringdown through the mud. The plug <strong>and</strong> ab<strong>and</strong>onment laws <strong>and</strong> designs usually specify a solid cementplug extending from 50 ft above to 50 ft below any fresh water zone or other productive zone. In caseswhere there is no cement behind the pipe or when the cement quality is unknown or even suspect, thepipe must be perforated 50 ft below the deepest usable water zone <strong>and</strong> cement circulated through theperfs <strong>and</strong> up the annulus to surface. Other considerations are setting plugs at liner tops <strong>and</strong> a thickplug near the surface to prevent accidental entry or flow when the wellhead is removed. Placement ofa plug is generally done by one of three methods.The balance method involves pumping the cement down the drill pipe or tubing <strong>and</strong> up to a calculatedheight which would balance the pressure exerted from the cement in <strong>and</strong> outside the pipe. This pressurebalanced tubing effect can be used to create a stable plug; provided that the mud that is currentlyin the hole will support the cement without allowing the cement to move through the mud by densitydifference. When a lightweight mud is to be used to spot a 16.4 Ib/gallon cement slurry, then the mudmust be gelled to prevent the cement from moving through the mud. The balance calculation can beaccomplished with the following form~la.~where:H=- NC+ THN= height of balanced cement column= ft3 of cement slurry used20-3
CT= ft3 per linear ft of annular space between tubing <strong>and</strong> casing or hole= ft3 per linear ft inside tubingIn the application of cement plugs for either temporary or permanent plug <strong>and</strong> ab<strong>and</strong>onment procedures,the failure rate of setting cement plugs is quite high. The most common field practice is to useopen-ended drill pipe or tubing to spot a 16.4 Ib/gal cement slurry onto a column of mud in the wellbore.This type of treatment has several drawbacks, the most significant of which is severe plug failuredue to density differences <strong>and</strong> stringing of the cement down one side of the mud column, Figure 20.1.et al., JPT, 1984)Figure 20.1:Density segregation of cement through alighter mud when trying to set a plug.In a paper that reported the results of a cement plug setting study, Smith, et used a model to spotvarious types of cement on gelled <strong>and</strong> ungelled mud <strong>and</strong> studied the success ratio of the treatment. Inthis work, it was found that when a gelled pill of mud was spotted in the wellbore <strong>and</strong> the cement wasspotted on top of the pill, the success of the plug setting procedure went up dramatically. In mostcases using the bentonite pill, a 13.6 Ib/gal cement slurry could be spotted on top of a 9 Ib/gal mud.The bentonite pill which was spotted immediately below the section where the plug was to be set wasthe same weight as the rest of the mud in the hole but heavily gelled to resist the viscous fingeringeffe~t.~ Even with the higher viscous bentonite plug, the higher weight slurries such as 13.8-17.5 Iblgal cement still fingered through the mud <strong>and</strong> collected near the bottom of the test borehole.An improvement on the bentonite pill procedure was to use a diverter tool as shown schematically inFigure 20.2. In this tool, the flow of the cement is turned 90" to the downward direction. By changingthe direction of the cement, the velocity component produced by pumping the cement is negated <strong>and</strong>the cement could be set with almost a 100% success rate on the gelled pill, provided mud <strong>and</strong> cementweights were within a 4 Ib/gal difference. Even with the diverter tool, when higher weight cementswere used, particularly those of over 4 Ib/gal difference from the mud, the cement plug would fail.Even with the diverter device, the velocity of pumping should be relatively low to prevent setting uppressure gradients that might lead to a flowing condition in the well during placement. If the well flowsduring the placement of a cement plug, the gas or water flow percolating through the cement will honeycombthe cement structure so that it is permeable or retard the cement to the point that it neverhardens. In a deviated well, there can easily be circulation within the wellbore: down the low side ofthe pipe <strong>and</strong> up the high side. This condition has been seen repeatedly in tests of production loggingtools such as spinners <strong>and</strong> tracer profiling tools, especially when a small amount of gas is available tolighten the fluids on the high side of the pipe <strong>and</strong> initiate the upward movement of fluid. With this typeof flow, unset plugs can be rapidly destroyed.20-4
9.0 #/Gal MudSpacer16.0 #/Gal CementDiverter Tool4 Holes Phased 4 5 O4 HolesBull Plug9.1 #/Gal BentonitePill Spacer9.0 #/Gal Mud(Smith et al., JPT, 1984)Figure 20.2:The diverter tool (left) used to deflect the cementtoward the borehole or casing wall. A bentonite spacerhelps prevent density segregation of the fluids.An alternative to the open end tubing is the use of a cement retainer. The cement is squeezed underpressure into the retainer, <strong>and</strong> the retainer itself helps prevent density segregation. Bridge plugs orpackers may also be set prior to the cementing operation to keep the cement from moving through themud. They are not commonly used due to their expense but they are very effective.A second method of cement plug placement is with a dump bailer. The bailer, which is run on wireline,is run to the necessary depth, <strong>and</strong> cement is flowed out of the bailer into the area used for the plug.Normally, several bailer runs are employed to get the required volume of cement over the zone. Accuratedepth control is a necessity. Placement of cement with a bailer often leads to severe mud contaminationof the cement since the operation of the bailer continuously stirs up the mud <strong>and</strong> cement. Thetechnique should only be used where the mud in the hole will not affect the cement setting characteristics.A thicker plug is also recommended. Time must be allowed between the bailer runs for thecement placed by each run to take an initial set or to build some gel strength. The bailer method iscommonly used in shallower zones or for plugs other than those used for permanent ab<strong>and</strong>onment ofthe well.The two plug method is the third positioning method for cement. This method involves a similar plugdesign to that used in primary cementing. The bottom plug is used to isolate the cement <strong>and</strong> the mudin the string as the cement is pumped down the pipe. At some point where the plug is to be set, a plugcatcher is placed in the tubulars to catch the plug as it is pumped out of the string. The cement followingthen fills the annulus around the pipe. The top plug which follows the cement causes a pressurerise when it hits the bottom of the pipe ensuring that a signal of cement positioning has been passed.This string may then be pulled up out of the cement plug <strong>and</strong> the plug left to harden. Mud conditioningis still required.Additional equipment is available to help in setting the plug. This equipment usually involves the runningof scratchers through the plug setting interval to help remove mud cake. Regardless of the plugsetting methods used, two operations should follow the plugging operation: (1) tagging the plug tomake sure it is in the right place <strong>and</strong> (2) pressure testing the plug to make sure that there are no leaks.20-5
aGroundYMud-fllled holeCement plugOpen hole, mud fllledCement plug--- -.---Freshwater strata below surface casingCement plugCasing stub, may or may not be in holeOpen hole, mud fllledCement plug---. --.Production strata, may be with casing <strong>and</strong> perforations-- L --.(McNally, PEI, Sept. 1990)Figure 20.3: An idealized case of plugs set during a plug <strong>and</strong> ab<strong>and</strong>onmentoperation. in real cases, plug thicknesses may bemuch in excess of what is required by law. Cement topsare always tagged to make sure of the location.Other Plugging ProcessesCement is by far the most durable of the plugging methods, but it is not the only method. The processesdivide into two categories: settable liquids <strong>and</strong> mechanical tools. Soft gels of sodium silicate<strong>and</strong> hard plastics are available for temporary or permanent sealing of annulus or formation. Variousmechanical isolation tools, such as bridge plugs, are also available.Settable liquids include the cement slurries described in the preceding section, plus the organic resins,polymer gels <strong>and</strong> inorganic gels. The advantages of the non-cement liquids is that they can penetratethe permeable formation to some distance <strong>and</strong> set up a secondary seal. The ability to invade theformation is particularly important when extensive natural or hydraulically created fractures exist.Cement will not extend into a thin natural fracture or a proppant packed fracture because of its highviscosity <strong>and</strong> fluid dehydration properties. Since fractures may extend far above <strong>and</strong> below the pay; toget a complete shutoff requires either filling the wellbore to a point above the uppermost reach of thefracture, or plugging the fracture. When two or more permeable zones have been linked by a fracture,the fracture itself needs to be plugged. Plugging a proppant packed fracture can be accomplished bypermanent gelling resins or inorganic gels, injected at just below the fracture extension pressure ofthe formation. Most organic polymers should be avoided for permanent plugging since the seal needsto be permanent <strong>and</strong> not susceptible to decomposition of the organic structure or bacterial attack.Mechanical tools are usually used in the placement of cement or other fluid based, plugging mediums.The tools are usually packers, bridge plugs, <strong>and</strong> blanking plugs that can positively position or isolatethe treatment. Although these tools represent an acceptable method of temporary ab<strong>and</strong>onment, theiruse in a permanent ab<strong>and</strong>onment should be studied carefully to be certain that the corrosion characteristicson metal <strong>and</strong> elastomer seals are acceptable. Besides corrosion limits, the mechanical toolscan only seal at the wellbore; fractures <strong>and</strong> channels beyond the casing can not be affected.20-6
Milling a PackerWhen a permanent packer must be removed, a milling operation is necessary. The explanation <strong>and</strong>figures used in this description is courtesy of Camco.’ The objective is to remove all of the packerwithout damaging the casing. There are three basic methods.1. Mill over the outer portion (slips <strong>and</strong> packing element) <strong>and</strong> retrieve remains or push them to bottom.2. Drill packer up completely with a flat bottom mill.3. Chop up packer with a s<strong>and</strong> line drill.Milling the outer portion of the packer is the most common. Milling up the entire packer takes moretime than overshot milling. S<strong>and</strong> line drills are drill collars (for weight) with a chisel tip (cable tool drill).The assembly is attached to the rig’s s<strong>and</strong> line (braided winch cable). The method is used in very shallowwells where it is not possible to apply enough weight for effective rotary milling. The packer istagged with bit (location marked on the s<strong>and</strong> line at surface) <strong>and</strong> then the rig operator will pick up thes<strong>and</strong> line about 30 to 40 ft <strong>and</strong> let it drop. The packer is chopped up by the bit.When the outer parts of the packer are to be milled, an overshot mill is used. The packer spear is runthrough the bore of the packer <strong>and</strong> unjayed. Pulling up on the string then drives the teeth out <strong>and</strong>catches the bottom of the packer. The mill shoe is unjayed from the spear allowing the spear to remainstationary as the mill burns over (cuts) the packer. The overshot design of the upper part of the millshoe housing allows remaining sections to be swallowed. After the seals <strong>and</strong> bottom slips are milledthrough, the remnants of the packer can be pulled.<strong>References</strong> - Plug <strong>and</strong> Ab<strong>and</strong>onment1.2.3.4.5.6.7.8.Government Accounting Office: “Safeguards <strong>and</strong> Not Preventing Contamination From Injected<strong>Oil</strong> <strong>and</strong> <strong>Gas</strong> Wastes,” Report GAOIRCED 89-97, July 1989.American <strong>Petroleum</strong> Institute Data.Oddo, J. E., Tomson, M. B.: “A Discussion of the Calcium Carbonate Scaling Problems <strong>and</strong> Solutionswith Respect to Produced Brines,” SPE 19763, SPE Annu. Tech. Mtg., San Antonio, Oct. 8-11, 1989.Herndon, J., Smith, D. K.: “Setting Plugs: A State-of-the-Art,” Pet. Eng. Int. (April 1978), 56, 60,62, 64, 69, 71.Scott, J.: “Completion Technology Includes Plugging Too,” Pet. Eng. Int. (Feb. 1971), 46-48.Smith, R. C., Beirute, R. M., Holman, G. B., Jr.,: “Improved Method of Setting SuccessfulCement Plugs,” J. Pet. Tech. (Nov. 1984), pp. 1897-1904.Fredrickson, S. E., Broaddus, G. C.: “Selective Placement of Fluids in a Fracture by ControllingDensity <strong>and</strong> Viscosity,” Paper SPE 5629,50th Annual Meeting, Dallas, September 28-October 1,1975.Camco: “Permanent Packer Milling Procedure,” Camco Products <strong>and</strong> Services Co., Copyrighted1991.20-7
Chapter 21: Effects of Completion, Stimulation <strong>and</strong>Workover Activities on Surface FacilityOperationsAlthough the discussion of surface facilities is unusual for a book on completion <strong>and</strong> workover operations,it is necessary to underst<strong>and</strong> the effects of workover, stimulation <strong>and</strong> completion fluids on thesurface-treating facilities.Surface facilities, Figure 1, exist for separation <strong>and</strong> treatment of produced fluids. The oldest examplesof surface facilities have been simple water separation tanks where gravity was sufficient to separatethe water from the produced oil. Although the techniques have become considerably more complexduring the development of surface facilities, the goal is still the same. The materials produced from awell may include gas, solids, hydrocarbon liquids <strong>and</strong> various concentrations of salt in water. Separationof these materials for sale or for disposal is necessary for efficient h<strong>and</strong>ling.To CompressorIBlanket<strong>Gas</strong>AFuel?*FromWellsSeparatTo <strong>Oil</strong>StorageTo WaterTreating@ = Level controller@ = Pressure controller@ FIOW meterFigure 21.1The first stage in the separation begins downstream of the pressure-regulating devices or well outlets.In wells that produce large amounts of gas <strong>and</strong> liquids, gas vent in the line (often called a gas buster)removes part of the produced volume <strong>and</strong> much of the mixing energy that inhibits fluid separation.Other gas removal steps usually follow <strong>and</strong> multiple stage separations can conserve pressure, animportant design consideration in gas h<strong>and</strong>ling. Fluids from a single well or from multiple wells maythen be gathered into a separator or freewater knockout, Figure 2, to do a quick separation of thewater that will separate easily from the crude oil or gas. This simple step reduces the treating stream<strong>and</strong> splits off an easily disposed segment of the produced fluid. The water that exits from the freewater21-1
knockout will also take a certain amount of solids, such as corrosion by-products or particles from theformation that have been lifted by the hydrocarbons.IToCompressionIcFrom WellFWKOiIFigure 21.2:To Water SkimmerFreewater KnockoutRemoval of the solids by settling or filtration is necessary to prevent filling the wellbore <strong>and</strong>/or fracturewith debris. Because of their simplicity, settling tanks are much more economical than the filtrationsystems which may require manual labor to process. Design of settling tanks are more scientific thanis apparent at first glance. Studies have shown that “swirl” designs produced by critically placed inletnozzles are more efficient at solids separation than straight settling. Without the inlet direction, flowthrough the tank often follows a “path” through the middle of the tank, leaving liquid along the sidesundisturbed <strong>and</strong> results in the whole tank volume not being efficiently used.The oil stream leaving the freewater knockout will still contain some water <strong>and</strong> some solids, as well asgas. When gas is present in large quantities, a gas vent to the compressor or pipeline will also bemade in the freewater knockout. This removes an additional component of the produced fluid <strong>and</strong>decreases the size of downstream treating vessels.The next vessel in the operation is usually a treating device of some type to break more stable mixturesof gas or oil. Most treaters are either horizontal or vertical vessels, where the hydrocarbon <strong>and</strong>water go through a final separation to produce pipeline quality oil <strong>and</strong> gas, <strong>and</strong> disposable water.Some gas may also be vented off at this step into the collection system to the pipeline. Although mostcrude oil <strong>and</strong> water emulsions break very quickly, some emulsions are stabilized by either viscosity,solids, chemical action or charge, <strong>and</strong> require treatment to gain the final separation. The size of theseparators is determined by the total amount of fluids flowing through the separators, the difficulty inseparating the hydrocarbon <strong>and</strong> water phases, <strong>and</strong> the occurrence of special conditions such as21-2
upsets, stimulation treatments or production of solids. Separators may be liquid-liquid separators,gas-liquid or gas-liquid-liquid separators. The residence time is the time the fluids spend in the separator.The time should allow the liquids to separate <strong>and</strong> the gas bubbles to rise to the surface. Generally,the time to break an emulsion is a function of the stability of the emulsion. Where a small amountof water is stable in a crude, a set time is allocated to separate the majority of the water, Figure 3, <strong>and</strong>other methods are necessary to separate the last of the water from the oil. The final treating level oramount of water in the oil is set by the maximum BS&W (Basic Sediment <strong>and</strong> Water) content of thesales contract.I Waterhw/hTimeFigure 21.3Emulsions are composed of two or more immiscible phases that have been mixed with each other withsufficient energy to produce a dispersion of one phase into another. If the emulsions are stable, then astabilizing agent such as surfactant, solids, viscosity, charge, pH or reactants is slowing the coalescenceof the droplets of the dispersed phase. Emulsion treating focuses on destroying the stabilizingmechanism in the emulsion. Although most downhole treatments focus on solvents <strong>and</strong> surfactants tobreak emulsions, surface treating usually focuses on dilute surfactants <strong>and</strong> heat in some cases. Surfacefacilities may also utilize neutralization of pHs to achieve a break. When continuous treating isnecessary, the economics dictate that specific solutions to generate the lowest cost break be made inevery case. The breaking of an emulsion begins with removal of the stabilizing agent. This allows thedroplets of the internal phase to join together <strong>and</strong> make larger droplets in a step called coalescence.Coalescence is the joining of small droplets to make larger drops. It is the first step in emulsion separation<strong>and</strong> is improved by low energy mixing, decreases in viscosity, heat (which decreases viscosity),dilution (which decreases viscosity), <strong>and</strong> contact with the wall of the container which produces thewetting-out of the droplet.21-3
The viscosity of an emulsion is usually dependent on the continuous phase or the external phase. Inmost oilfield operations, emulsions are either oil-in-water (water is the continuous phase) or water-inoil(oil is the continuous phase). At internal phase concentrations of less than 54%, the viscosity of theemulsion is approximately the same as the viscosity of the external fluid. At internal phase concentrationsof up to 72%, the viscosity rises slowly, as is shown in Figure 4. This is due to the droplets contactingeach other as the emulsion changes shape during flow. When the concentration passes 72%for a monodispersed (equal bubble size) emulsion, the viscosity builds extremely quickly because thedroplets must deform to flow by one another when the emulsion is moving. The emulsion becomessteadily more viscous until approximately 96% internal phase concentration where the emulsion mayinvert <strong>and</strong> swap the places of the internal <strong>and</strong> external phases. At this point the viscosity will fallsharply, <strong>and</strong> the viscosity of the emulsion will be the same as the new external fluid.Internal Phase ConcentrationDilute Contact Deformation I nve rs i o nII*CI.Iv)0v)554%Internal Phase ConcentrationFigure 21.4Temperature has an effect on the settling rate of droplets since an increase in temperature willdecrease viscosity <strong>and</strong> the specific gravity. Over 1 50' , however, temperature may promote mixing,since many of the light ends are nearing the boiling point. In general, crude emulsion separation bytemperature is a last resort. When heated, oils lose volume <strong>and</strong> API gravity decreasing the value ofthe crude oil. The specific gravity of the oil is related to its API gravity by:OAP1 = -- 141S 131.5S.G.The specific gravity of the gas is a function of the molecular weight, MW.21-4
The viscosity of emulsions is approximated by:MWS.G. = -29peff$= effective viscosity of emulsion= viscosity of the continuous phase= volume fraction of discontinuous phase.Salts can form a unique problem in treating. Although most salts are soluble in water, very high concentrationsof salts in the produced water may actually mix in with the oil as the crude wets part of theoil. If water volume is lost due to evaporation, the salt becomes more concentrated, <strong>and</strong> can be producedwith the crude. Salt content is a function of salt content in the water <strong>and</strong> quantity of water in theoil. Removal of the water removes most of this dissolved salt. However, solid salt may occur fromcooling, evaporation <strong>and</strong> pressure loss. This solid salt will be carried by the oil or water, with high viscosityoil being an excellent carrier. Treating of salts is usually done in a vessel known as a “desalter,”another secondary treating vessel. In these treating vessels, fresh water is often mixed with the oil toremove the salt particles. Since salt production is relatively constant, treatment with water is fairlyconsistent. After stimulations, however, salt contents may change dramatically (usually decreases) fora few weeks.Control ValveInlet DivertorMist Extract0Water WeirLevel Control ValvesFigure 21.5: One type of a horizontal separator.Separators may be vertical, horizontal or, less commonly, spherical. The type of separator requiredwill depend on the application <strong>and</strong> the preferences of the system designer. Horizontal separators,Figure 5, are more efficient in gas separation <strong>and</strong> in liquid/liquid separation. Vertical separators,Figure 6, are better for h<strong>and</strong>ling solids <strong>and</strong> in tolerating surges. The sizing of separators involves gasseparation, droplet coalescence <strong>and</strong> settling, <strong>and</strong> the retention time required to accomplish these twofunctions. Retention time takes into account the separation of all fluids at some design flow rate. Separationtime will typically range from 3 to 30 minutes. The amount of dispersed or internal phase in theemulsion will affect the coalescence time. In general, decreasing internal phase will lengthen the21-5
equired coalescence time (few drops to collide) <strong>and</strong> higher viscosity of the external phase willlengthen the required coalescence time (fewer drop collisions will lead to larger drops).Inlet Diverter.Mist ExtractorDowncomereve1 ControlFigure 21.6:Vertical separator with spreader.The effects of stimulation, completion <strong>and</strong> workover chemicals are usually seen during the backflow ofthese chemicals into the treaters. Acid backflow is accompanied by higher concentrations of chlorides,calcium, iron <strong>and</strong> a few other minerals, as well as solids from undissolved particles, corrosion by-products,<strong>and</strong> low pH fluids. Disturbances in the chemical equilibrium <strong>and</strong> separation of oil <strong>and</strong> waterphases following a stimulation treatment are known as upsets. These upsets create problems in thenormal separation of emulsions. In most cases, separation of these fluids can be h<strong>and</strong>led easily. However,special conditions such as return of low pH fluids or very high iron content fluids may createalmost unbreakable emulsions if correct procedures are not followed. H<strong>and</strong>ling these emulsionsrequires treatment of the stabilizing influence. In most acidizing treatments, it has been found thattreatment of the stimulation fluid or the overflush with a small amount of mutual solvent can preventemulsions during the backflow. In these cases, the mutual solvent is actually reducing the surface tensionof the aqueous phase <strong>and</strong> the viscosity of the oil phase. These actions help break <strong>and</strong> preventemulsions. Additionally, the mutual solvent wets the surfaces of emulsion-stabilizing fines such asfeldspar <strong>and</strong> silica. The complete wetting of these surfaces takes them away from the active dropletinterface.21-6
Stimulation FlowbacksReturning acid from any type stimulation or workover may be a serious problem if not h<strong>and</strong>led correctly.Returning acids may be accompanied by emulsions, organic solvents, surfactants, metal ions,solid debris, corrosion products <strong>and</strong> live acid. Because of the variety of acid backflow components,treatment is varied. Knowledge of the injected fluid <strong>and</strong> the formation interactions are helpful to avoidproblems. Disposal of the backflowed acid may require pH adjustments, oil/water separation, or classificationas a waste stream. Local regulations will set the disposal conditions.Acid backflow treating <strong>and</strong> disposal is not a complicated process but several easily gathered pieces ofinformation are needed to prevent future problems, both with the well <strong>and</strong> with environmental regulations.Using a treatment with only the required volume, strength of acid <strong>and</strong> additives is beneficial froman economic well treating st<strong>and</strong>point as well as an acid disposal process. When hydrochloric acid isspent on carbonate formations, the reaction products are calcium chloride salt <strong>and</strong> water. The concentrationof the salt in the reaction product depends on the initial concentration of the acid. With 15%HCI, for example, the total chlorides in the acid backflow reach about 70,000 ppm unless the backflowis diluted heavily by a fresher produced water. Disposal of a salt water is usually not a serious problem:it is the additional materials in the backflow that make the acid a waste product.Testing the BackflowCauses of UpsetsTreater upsets by emulsions is a common occurrence in many areas following acidizing. Upsets maylast from a few hours to a few days. A variety of causes of these emulsions have been found <strong>and</strong> mostinvolve the materials in the acid backflow. From studies of industry wells, properties <strong>and</strong> materials inthe acid backflow include:1. Spent <strong>and</strong> unspent acids from 0 to 12% HCI.2. Surface tension (initial 30 dynes/cm) from 35 to 50+ (untreated water is 72 dynes/cm).3. Densities of 8.7 to 9.5 Ib/gal (initial acid was 15%).4. Iron contents of 500 ppm to 70,000 ppm. (typical total iron contents from 500 to 11,000 ppm forsweet wells <strong>and</strong> up to 20,000 for H2S wells).5. Sodium ion contents to 10,000 ppm.6. Calcium ion contents to 750 ppm in s<strong>and</strong>stones <strong>and</strong> over 10,000 ppm in limestones with concentratedacids.7. Potassium ion contents to 1,000 ppm for HWHF acid jobs.8. Aluminum ion contents to 10,000 ppm from HCVHF acid jobs.9. Chloride ion contents from 70,000 to 125,000 depending on initial acid concentration <strong>and</strong> formation<strong>and</strong> connate water ions.10. Sulfate ion contents from 0 to about 150 ppm.Figure 7 shows an average backflow analysis after acidizing with HCI/HF acid in a Trinidad well. In thislook at the first 95 bbls backflow following a 102 bbl acid job, none of the ions were beginning to stabi-21-7
lize. In other analyses, sampling was carried out to 600 barrels of acid backflow. Ion concentrationusually stabilized between 200 <strong>and</strong> 300 barrels.Backflow from a Trinidad WellThere can be many causes of treater upsets but emulsions are the most common <strong>and</strong> often are thedifficult problem to solve. To prevent or break an emulsion, the stabilizing mechanism must be eliminated.In the following paragraphs, several components of acid backflow will be discussed. Ideal acid backflowfrom a well stimulation st<strong>and</strong>point will have the acid concentration between 1 % <strong>and</strong> 3% concentration.Typical acid backflows have been measured at pH of 7 (acid completely spent)'Oto 12% HCIfrom initial 15% acid strength. If returning acid concentration is above 3%, the initial treatment designmay need to be adjusted to reduce acid volume or acid concentration. The purpose of the acid jobshould also be reviewed to determine if another acid or solvent could be more effective. Excessiveacid concentration in the backflow is expensive from waste of initial acid cost, cost to neutralize <strong>and</strong>production equipment corrosion <strong>and</strong> facility upsets. Acid corrosion inhibitor quickly adsorbs on the formation.Returning (spent) acid does not usually have any functional corrosion inhibitor remaining.A special case of facility upset caused by acid corrosion inhibitor has been seen when the acid tankswere not kept circulated prior to <strong>and</strong> during pumping of an acid treatment on a well. Most acid corrosioninhibitors are not soluble in acid; they are dispersed <strong>and</strong> will separate if the tank is not continuouslycirculated. If a tank of acid is pumped without adequate circulation, the first fluid pumped is acidwith very little corrosion inhibitor <strong>and</strong> the last fluid injected (<strong>and</strong> the first seen in the facility on backflow)is nearly pure corrosion inhibitor. Corrosion inhibitor in concentrations over 5 to 10% are sometimesvery efficient emulsifiers. Breaking this type of emulsion is difficult; it requires a solvent withgood stripping action to clean <strong>and</strong> completely water-wet the solids <strong>and</strong> to clean the metal surface ofthe tanks <strong>and</strong> lines. Mutual solvents with xylene have been used successfully.Acid concentration of returning acid must be titrated. It cannot be checked with a hydrometer or pH.Spent acid solutions are CaCI2 brines with densities between 8.5 <strong>and</strong> nearly 10 Ib/gal. The differencebetween live HCI acid <strong>and</strong> brine cannot be seen by hydrometer. Measurement of pH is only useful forvery low strengths of HCI. For example, all HCI solutions with concentrations from 0.5% through 28%will have a pH below 1. Changes in this limited range of pH are very difficult to see, even when theacid strength change is large. If the pH is below 1, the strength should be titrated.Iron control in the well <strong>and</strong> in the surface equipment is a top priority. There is a definite link betweeniron <strong>and</strong> asphaltene contents of a solution <strong>and</strong> the tendency to form sludges <strong>and</strong> emulsions. Asphalteneshave only a limited solubility in crude oil. They exist as dispersions or micelles, stabilized bymaterials called resins <strong>and</strong> maltenes. The micelle unit may be suspended by a negative surfacecharge or other force. Addition of an acid (positive acid protons or hydrogenions) may neutralize thecharge <strong>and</strong> allow larger aggregates to form, starting a precipitation process. Iron in the spent acid may21-8
play a significant role in creation of asphaltic stabilized emulsions <strong>and</strong> sludges. Ferric iron, Fe3+,appears to be much worse than ferrous iron, Fe2+. Designing an effective treatment for these problemsis difficult because the composition of the emulsion <strong>and</strong> the trigger for its creation changes withthe fluid <strong>and</strong> well conditions. Field approaches have generally centered on iron reducing attempts <strong>and</strong>aromatic solvents to stabilize the asphaltenes. These steps are added to the initial treatment. Whenthe backflowed fluids create an iron/asphaltene stabilized emulsion or sludge (usually very high viscosity),thinning the emulsion with an aromatic solvent <strong>and</strong> then adding a demulsifier or desludger areaccepted practices. The problem, however, is in getting contact with the viscous emulsion. Once thematerial is in holdinghreating ponds, the mixing opportunity is gone <strong>and</strong> surface treating <strong>and</strong> skimmingis often the only alternative. Where possible, known problem backflows should be treated with chemicalsin the stimulation treatment, in the overflush or displacement, through a gas lift valve or at thewellhead prior to the choke. Field experience <strong>and</strong> testing will identify the proper location.Testing live <strong>and</strong> spent acid mixtures (with <strong>and</strong> without additives) with the crude oil can often help identifyproblem crudes, but is not fail-safe. Problems often occur when crude streams from several wellsare mixed. In known areas of acid upsets related to crude mixing, an active program of solvent oremulsion preventer injection at the wellhead is needed. When upsets do occur, collect the followingdata:1. Where was emulsion noticed? (This gives information about creation point <strong>and</strong> if other crudesadd problems when mixed.) Track the emulsion upstream until the point of creation is identified.2. What were emulsion characteristics?a. oil- or water-external?b. internal phase volume?c. stabilizing influence(s)?(1) iron content?(2) asphaltenes/paraffin content?(3) polymers?(4) fluid loss additives?(5) surfactant usage in job?(6) other solids/precipitates?3. Duration of emulsion problema. when during flowback did it start (volume flowed <strong>and</strong> time)?b. when did it stop (volume flowed <strong>and</strong> time)?c. pH at start, stop, <strong>and</strong> during the upset.If the acid concentration is at least 1 %, the dissolved iron will not precipitate although iron in solutioncan still react to form sludges. If the acid concentration is no more than 39'0, the corrosion of the acidon the tubulars for a short time exposure is significantly lessened. There are two forms or iron; iron +2(ferrous) <strong>and</strong> iron +3 (ferric). Ferric iron precipitates as the pH rises above about 1.8 <strong>and</strong> ferrous ironprecipitates when the pH reaches 7 (acid completely spent). Both forms of iron may be present in theabsence of oxygen, but as soon as the acid returns are exposed to air, the ferrous iron is oxidized toferric iron. This is the reason why precipitates form in many spent acid samples a few minutes aftersample collection. The iron precipitates as a hydroxide precipitate <strong>and</strong> has a green to brown color.Iron is present in several formation minerals but the primary source of iron is from acid reaction withcorrosion products in the tubulars. Iron from corrosion can be in one or more of the iron oxide materialsin sweet wells or one or more of the iron sulfide materials in sour wells. Presence of iron in anyform is enough to trigger viscous emulsions if other components are available. Reduction of iron, evenin sour systems (thought to be already reducing systems) has been found to be necessary. Simple21-9
chelants such as citric acid <strong>and</strong> EDTA, <strong>and</strong> pH control materials such as acetic acid are not effectiveat preventing this type of iron-caused emulsion. Ferric iron, theoretically, should not be available in areducing environment such as provided by a hydrogen sulfide concentration in the crude oil. However,sufficient evidence exists that the iron cross-linking is occurring. Part of the issue of iron reduction ishow the reducing agents work <strong>and</strong> how well the reducer prevents the iron from becoming active in creationof the sludge.Iron sulfide may exist in many forms in a well. At least eight different forms exist, some with the samechemical formula but a different shape or appearance.Mineralamorphous (no crystal)MackinawitePyrrhotitePyriteMarcasiteSmythitePyrrhotiteI-es (variable)Fe& (often listed as FeS)FeSFeS2FeS2Fe3S4Fe7S8CompositionThe form of the material makes a significant difference in reactivity. Forms of the material such asMackinawite are slowly acid soluble, while forms such as Pyrite are almost nonreactive. The surfacearea-to-weight or “size” of the iron sulfide material also is significant. Hard, thick scales of iron sulfideare very slowly reactive <strong>and</strong> are probably not involved in the type of reactions discussed here, however,their presence indicates a high iron sulfide availability in the water. Iron sulfide, with a solubilityof about 0.0005 parts in 100 parts water (5 ppm), at a pH of 7, should not be classed as a seriousreactant due to the limited concentration. The concentration of iron in a solution is pH sensitive; as thepH decreases (stronger acid), more iron is soluble. In 15% HCI, for example, field solution have beenanalyzed that contain over 70,000 ppm iron. The valence state of the iron is also a factor in solubility.Ferric iron (+3) is soluble in solutions with pHs below 2.0 (one author reports 1.8). Ferrous iron (+2) issoluble in solutions with pHs below 7. Presence of an oxidizer can convert ferrous to ferric, <strong>and</strong> areducer can convert ferric to ferrous. The amount of oxidizer or reducer required is a function of theeffectiveness of the oxidizer or reducer, <strong>and</strong> how much iron of a particular valence state is present.Other additives can also affect iron availability.In some field <strong>and</strong> flowback work, common iron contents range from 500 to 2,000 ppm <strong>and</strong> higher foracid from sour wells. The amount of ferric iron in the total iron is variable. Even with the H2S environment,these high iron contents are difficult to reduce from ferric iron to ferrous iron.There is also another source of iron, existing as one of the iron sulfide materials, in a dispersion inwater. Many of the produced waters in West Texas have this type of iron present. The iron particlesare so small that they can stay suspended easily. They may pass from solution in the liquid to the solidform <strong>and</strong> back again rapidly in response to alterations in pH or presence of oxidizers or reducers.Exposure of this water to oxygen, for example, triggers the black color characteristic of the producedwaters (after aeration) in the West Texas area. This is an oxidizing shift from ferrous to ferric iron. Precipitationof the very fine particles will occur but will happen very slowly. A drop or two of HCI in a beakerof this water will shift the pH lower <strong>and</strong> cause the black color (<strong>and</strong> most of the particles) toimmediately disappear. Both solubilized iron <strong>and</strong> the very finely divided iron may react with the sludges.One of the first conclusions of the early tests was that the surfactants by themselves would not preventthe sludge. Although some surfactants were found that were more effective than others, the generalfinding was that when iron loaded acid was mixed with a sludging oil, presence of a surfactant oreven a “high solvent capacity’’ solvent would not prevent the formation of the gel <strong>and</strong> the sludge. Mul-21-10
tichemical tests with iron control materials <strong>and</strong> surfactants found a few combinations that would preventthe sludges.The conclusions with the iron control materials were even more striking than the solvenVsurfactantwork. Iron control is commonly approached with one of three methods: pH control (acetic acid), achelating agent (citric acid or EDTA) or with an iron reducing agent. Iron exists in solution in an ionizedstate or as finely dispersed colloidal particles in rarer cases.The traditional thinking has been that the iron creates damage by precipitating from solution as gellanteousiron hydroxide as the pH rises in the spending acid. The pH at which the iron precipitatesdepends on its valence state, ferric iron (Fe+3) precipitates at a pH of 2, while ferrous iron (Fe+2) precipitatesat a pH of about 7. Ferrous iron converts or oxidizes to ferric iron in the presence of oxygen.Control of iron with acetic acid is limited, at best. The organic acids spend to an equilibrium underpressure, leaving a small amount of live acid at temperatures below 160°F. The live acid graduallyspends with time, even at pressure. As long as it remains, this trace of acid keeps the pH low <strong>and</strong>helps prevent the precipitation of iron. The valence state of the iron was thought to be relatively unimportant,as long as the pH was held low or the iron molecule was tied up by a chelant.In these early tests, however, both the acetic acid <strong>and</strong> the chelating agents were founds to be ineffectiveat stopping the sludge, even with a good solvent or surfactant. The results were relatively consistentwith either live acid (20% HCI) or acid spent on sodium hydroxide or dolomite formation fragmentsThe conclusion from the tests was that the iron was entering into a reaction with some component ofthe oil without precipitating from solution.The best sludge control system from these tests incorporated an iron reducer <strong>and</strong> an effective surfactant.In a few of the tests, particularly with oils that were very prone to formation of sludges, a good dispersingsurfactant worked better than a solvent. The reason for the surfactant’s success appears to centeron the “interrupting effect” (dispersant quality) of the surfactant in preventing some component of theoil from gaining viscosity during the attempted sludge formation process. The exact mechanism is stillunknown.The sludge formed in the tests would enter a gelled state first, followed by slow formation of a semisolidmass. The mass resembled cottage cheese in consistency <strong>and</strong> would not pass through a100 mesh screen.Tests for prevention of the sludge focused on finding effective combinations of iron reducer <strong>and</strong> surfactant.During these tests in two laboratories, the need for a combination of iron reducer <strong>and</strong> effectivesurfactant were repeatedly seen.Emulsions are physical mixtures of oil <strong>and</strong> water. Because of phase separation <strong>and</strong> density segregationforces, the oil <strong>and</strong> water will separate into distinct phases quickly if there are no stabilizing mechanisms.Stabilizing mechanisms include surfactants (either natural or added compounds), fines <strong>and</strong>component fluid viscosity. Surfactant <strong>and</strong> fines stabilization often work in combination. Added surfactantsthat are common in backflowed acid include corrosion inhibitors, diverting agents, fluid loss additives,foamers, silt suspenders, soaps, oil base mud emulsifiers, <strong>and</strong> several other materials. Themost common surfactant is excess corrosion inhibitor resulting from poor surface acid mixing beforethe job.Natural surfactants in some crudes along with iron can make some very stable emulsions. Testing withthe freshly produced oil <strong>and</strong> the acid <strong>and</strong> spent acid can often spot these problems. Treatment is usuallyby adding a mutual solvent to the job, to the afterflush or by adding it at the well head during backflow.<strong>Oil</strong> base mud cleanups are best addressed with aromatic solvents <strong>and</strong> then with acids <strong>and</strong>mutual solvents.21-11
Acid flowback emulsion stabilization by fines is usually by very small particles of 5 to 100 microns.Common materials that act as stabilization are silt, clays, asphaltenes, paraffins, acid precipitates,scale, corrosion products, polymer, drill cuttings, <strong>and</strong> partially dissolved acidizing reactants. Thesesolids are very common in backflowed acid. The solids gather at the interface of the oil <strong>and</strong> waterdroplets because they are partially wetted with both phases. Treating involves use of a mutual solventto water wet the particles, lower the interfacial tension <strong>and</strong> drop the materials from suspension.Viscosity stabilization is rarer but does occur with viscous crudes. The emulsion is more of an entrapmentof the spent acid in the oil phase. As the internal phase increases, viscosity increases due todroplet deformation <strong>and</strong> resistance to flow. Solvents are normally used to thin the external phasehydrocarbon. Mixing is critical, so the solvents should be injected as far upstream of the treater as ispractical.Precipitates are usually limited to iron but do occasionally include sulfate scales that have a temporarysolubility in live acid. Mixing high sulfate waters with spent acids (concentrated calcium) can producequick precipitations of calcium sulfate scale. This scale precipitation is hard to prevent: most scaleinhibitors do not work well below a pH of 3. Avoid mixing the acid with incompatible waters (high in sulfate,barium, or other ions) for best results.Returning spent acids should contain debris or solids. If returning acids are clear, the well is probablynot being cleaned. Continued damage, emulsions, <strong>and</strong> very slow cleanup can be signs of poorcleanup.Flowback DurationThere is no accurate method to predict the acid flowback time or volume. Wells have generally flowedback the last major traces of injected solutions after a volume of two to five time the injected volumehas been recovered. During the recovery period, mineral contents will vary widely as seen by therecovered fluid analysis over 320 bbls of backflow following a 90 bbl acid job (HCI <strong>and</strong> HCVHF) on aTrinidad well, Figure 8. In this data, most of the mineral contents begin to stabilize to near formationwater values after about 250 bbls. The pH, which is the best indicator in most s<strong>and</strong>stone acid jobs,begins to increase after about 220 bbls. Because treatment conditions vary from well to well, a predictionof normal operations should only be made after checking the individual well response. In s<strong>and</strong>stones,pH is suggested as a indicator of acid returns; in limestones, the calcium ion is a possibleindicator if rapid acid spending causes pHs to be high on flowback. Chloride ion content can be measuredquickly, but is only a good indicator when the connate waters are very much different in chloridecontent than the spent acid.Figure 21.8:10,000Q 1,000:U"M100$e2 10I -,"Acid Backflow Mineral Returns on a 90 bbl Stimulation on Trinidad Poui B-16XXI21-12
Treating the Returning AcidThe choice between pipelining the acid backflow along with the produced hydrocarbons to a treatingfacility <strong>and</strong> treating at the well or tank battery depends on the on-site equipment <strong>and</strong> the potential corrosionto the pipeline <strong>and</strong> treating facility.Fluids with any acid strength may cause problems. Acid neutralization is often linked to solving corrosion<strong>and</strong> treater upset problems. Soda ash or sodium bicarbonate is used to neutralize the acid afteran acid strength determination is made. The neutralization is performed in a small batch tank withsome method of mixing. Neutralization time is usually brief but depends on volumes <strong>and</strong> mixing. pH ismonitored until the acid is above a predetermined limit that will not cause emulsion problems for theparticular oil/spent acid system. Most emulsion problems begin to disappear when the solution pHrises above 6.5. If emulsions are present in the backflow, they must be broken before the pH can beneutralized.Figure 21.12: pH vs. Acid Backflow on a 90 bbl Stimulation on Trinidad Poui B-16XXTreatment ChoicesSeveral methods can be used to eliminate the problems caused by backflowed acid. One workableapproach to emulsions on backflow (Little Buffalo Basin-Madison Lime) was to place a small chemicalinjection pump just downstream of the wellhead to inject a mutual solvent such directly into the producedfluid. By the time the fluids traveled through the flow lines <strong>and</strong> reached the tank battery, theemulsions were broken <strong>and</strong> the fluids could be easily separated. Field optimization showed treatmentcould be discontinued after a pH of 6.5 to 6.8 without further treater upsets. Gidley achieved similarperformance by loading the acidizing treatment overflush with 5% mutual solvent.' Both these operationseliminated treater upsets. Coppel found that the diverting agents <strong>and</strong> precipitates from the spentacids, especially after commingling production streams, were the cause of emulsion upsets2 He successfullytreated the backflow with demulsifiers. An alternate method involves in-situ neutralization ofacid.3 This method may produce formation damage in some instances, however. The best method touse will, as stated earlier, depend on well conditions <strong>and</strong> available eq~ipment.~-~ A few common itemsare clear:1. Add emulsion breaking <strong>and</strong>lor neutralizing material before pipelining the fluid. This uses the flowaction in the pipeline to mix the mutual solvent <strong>and</strong> prevents the emulsion from becoming morestable due to energy input. Field tests are needed for selection of concentration <strong>and</strong> type ofmutual solvent. Typical ranges of 0.5% to 5% mutual solvents or 0.1 to 0.5% demulsifier surfactantsare common, but tests are required.2. Monitor the pH or a key ion <strong>and</strong> continue to treat until a predetermined level. A pH of 6.5 is suggestedunless another level is established by field test.21-13
3. Break out as much water as possible as early as possible to minimize the volume of the internalphase of oil external emulsions. This will reduce the emulsion viscosity.<strong>Oil</strong> Foams<strong>Oil</strong> foams or froths following treating are common for a few wells that produce crude or where foamproducing chemicals or solvents such as diesel are used. <strong>Oil</strong> foams are usually unstable except wherea froth is created where oil viscosity is high.g Natural oil foaming tendency is caused by short-chain(MW 5400) carboxylic acids <strong>and</strong> phenols in the crude.l0 The materials are usually in low concentration,often less than 0.02% of crude volume. Foams created by the action of treating fluids are usuallythe result of diesel or other oils. Soaps, silt suspenders, or foamers in the acid or water usually havelittle effect on oil foaming.Preventing natural oil foams is difficult. Antifoam squeezes have been tried with poor results.” Antifoamtreatment of oil in the production facilities may be chemical with silicones <strong>and</strong> polyglycolethers,12 or mechanical, using treaters with high interval surface area contact (cellulose, fiber,Foams break by spreading the film of the bubble until it becomes so weak that it will notsupport it~e1f.l~ Liquids or solids such as demulsifiers or mutual solvents that promote spreading willbreak the film. Silts <strong>and</strong> other small particles can stabilize foams <strong>and</strong> froths in the same way as solidsstabilize em~lsions.’~Preventing oil foaming after acid or solvent treating usually focuses on elimination of the componentthat is causing the foam problem. Diesel is the most common foam creator. Other foam producerschemicals include emulsifiers although the problems caused are usually much less than diesel. Mostfoams, whether following stimulation or natural production result from sudden pressure decrease <strong>and</strong>turbulence (chokes, pumps, etc.).<strong>References</strong>1. Gidley, J. L. <strong>and</strong> Hanson, H. R.: “Prevention of Central Terminal Upsets, Related to Stimulation<strong>and</strong> Consolidation Treatments,” SPE 4551, SPE 48th Annual Mtg., September 30-October 3,1973.2. Coppel, C. P.: “Factors Causing Emulsion Upsets in Surface Facilities Following Acid Stimulation,”J. Pet. Tech., (September 1975), pp. 1060-1 066.3. Green, E. B., Lybarger, J. H., <strong>and</strong> Richardson, E. A.: “In-Situ Acid Neutralization Solves FacilityUpset Problems,” J. Pet. Tech., October 1974, pp. 11 53-1 155.4. Gdanski, R. D. <strong>and</strong> Peavy, M. A.: “Well Return Analysis Causes Re-evaluation of HCI Theories,’’SPE 14825, Presented at the Formation Damage Control Symposium, Lafayette, February 26-27, 1986.5. Jacobs, I.: “Asphaltene Precipitation During Acid Stimulation Treatments,” SPE 14823, FormationDamage Symposium, Lafayette, February 26-27, 1986.6. Smith, C. F., Crowe, C. W., <strong>and</strong> Nolan, T. J.: “Secondary Deposition of Iron Compounds FollowingAcidizing Treatments,’’ J. Pet. Tech., September 1969, pp. 11 21 -1 126.7. Gougler, P. D. Jr., Hendrick, J. E., <strong>and</strong> Coulter, A. W.: “Field Investigation Identifies Source <strong>and</strong>Magnitude of Iron Problems,” SPE 13812, Presented at the 1985 Prod. Oper. Symposium, OklahomaCity, March 10-1 2, 1985.21-14
8. <strong>King</strong>, G. E. <strong>and</strong> Trbovich, L. 0.: “identification of Emulsions, Dispersions, Froths, Foams <strong>and</strong>Adverse Wetting Conditions,” F85-P-25.9. Rooker, M.: “Crude <strong>Oil</strong> Separator Foam Problems,” S.W.P.S.C., Lubbock, 1983, pp. 400-406.10. Callaghan, I. C., McKechnie, A. L., Ray, J. E., Wainwright, J. C.: “Identification of Crude <strong>Oil</strong> ComponentsResponsible for Foaming,” S.P.E.J., April 1985, pp. 171-1 75.11. Fallin, S., Sharp, S. P., Wolfe, J. L.: “Defoaming Agents for increased <strong>Oil</strong> Production Rates ofFoamy Crudes-Laboratory Screening Tests <strong>and</strong> Field Results J. Pet. Tech., February 1971,pp. 233-238.12. Hudgins, C. M. Jr.: “Chemical Treatments <strong>and</strong> Usage in Offshore <strong>Oil</strong> <strong>and</strong> <strong>Gas</strong> Production Systems,”OTC 6528, presented at the 23rd Annual OTC in Houston, May 6-9, 1991.13. Hancock, W. P., Hagen, D. A.: “Fine Tuning Increases Statfjord B Output 39%,” World <strong>Oil</strong>,January 1986, pp. 79-84.14. Laurence, L. L.: “Foaming Crudes Require Special Separation Techniques,” World <strong>Oil</strong>, November1981, pp. 103-1 05.15. Ross, S.: “Mechanics of Foam Stabilization <strong>and</strong> Antifoam Action,” Chemical <strong>Engineering</strong>Progress, Vol. 63, No. 9, September 1967, pp. 41-47.21-15