COM-1, pages 179-226 - ICOET
COM-1, pages 179-226 - ICOET
COM-1, pages 179-226 - ICOET

Create successful ePaper yourself
Turn your PDF publications into a flip-book with our unique Google optimized e-Paper software.
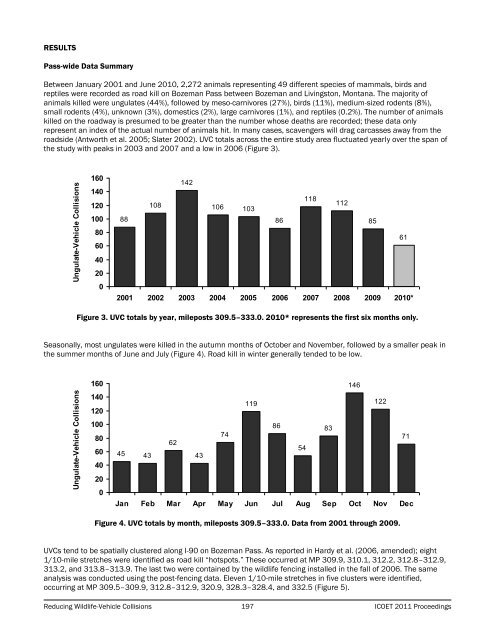
RESULTSPass-wide Data SummaryBetween January 2001 and June 2010, 2,272 animals representing 49 different species of mammals, birds andreptiles were recorded as road kill on Bozeman Pass between Bozeman and Livingston, Montana. The majority ofanimals killed were ungulates (44%), followed by meso-carnivores (27%), birds (11%), medium-sized rodents (8%),small rodents (4%), unknown (3%), domestics (2%), large carnivores (1%), and reptiles (0.2%). The number of animalskilled on the roadway is presumed to be greater than the number whose deaths are recorded; these data onlyrepresent an index of the actual number of animals hit. In many cases, scavengers will drag carcasses away from theroadside (Antworth et al. 2005; Slater 2002). UVC totals across the entire study area fluctuated yearly over the span ofthe study with peaks in 2003 and 2007 and a low in 2006 (Figure 3).Ungulate-Vehicle Collisions160140120100806040200142108106118103112888685612001 2002 2003 2004 2005 2006 2007 2008 2009 2010*Figure 3. UVC totals by year, mileposts 309.5–333.0. 2010* represents the first six months only.Seasonally, most ungulates were killed in the autumn months of October and November, followed by a smaller peak inthe summer months of June and July (Figure 4). Road kill in winter generally tended to be low.Ungulate-Vehicle Collisions16014012010080604020014611912286837471625445 4343Jan Feb Mar Apr May Jun Jul Aug Sep Oct Nov DecFigure 4. UVC totals by month, mileposts 309.5–333.0. Data from 2001 through 2009.UVCs tend to be spatially clustered along I-90 on Bozeman Pass. As reported in Hardy et al. (2006, amended); eight1/10-mile stretches were identified as road kill “hotspots.” These occurred at MP 309.9, 310.1, 312.2, 312.8–312.9,313.2, and 313.8–313.9. The last two were contained by the wildlife fencing installed in the fall of 2006. The sameanalysis was conducted using the post-fencing data. Eleven 1/10-mile stretches in five clusters were identified,occurring at MP 309.5–309.9, 312.8–312.9, 320.9, 328.3–328.4, and 332.5 (Figure 5).Reducing Wildlife-Vehicle Collisions 197 <strong>ICOET</strong> 2011 Proceedings