COM-1, pages 179-226 - ICOET
COM-1, pages 179-226 - ICOET
COM-1, pages 179-226 - ICOET

You also want an ePaper? Increase the reach of your titles
YUMPU automatically turns print PDFs into web optimized ePapers that Google loves.
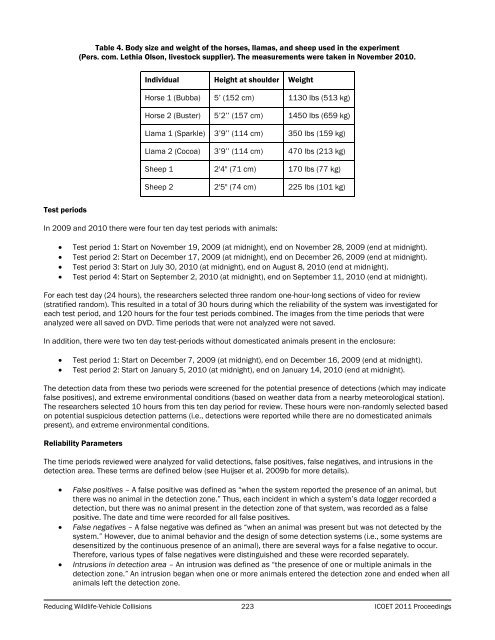
Table 4. Body size and weight of the horses, llamas, and sheep used in the experiment(Pers. com. Lethia Olson, livestock supplier). The measurements were taken in November 2010.Individual Height at shoulder WeightHorse 1 (Bubba) 5’ (152 cm) 1130 lbs (513 kg)Horse 2 (Buster) 5’2’’ (157 cm) 1450 lbs (659 kg)Llama 1 (Sparkle) 3’9’’ (114 cm) 350 lbs (159 kg)Llama 2 (Cocoa) 3’9’’ (114 cm) 470 lbs (213 kg)Sheep 1 2'4" (71 cm) 170 lbs (77 kg)Sheep 2 2'5" (74 cm) 225 lbs (101 kg)Test periodsIn 2009 and 2010 there were four ten day test periods with animals:Test period 1: Start on November 19, 2009 (at midnight), end on November 28, 2009 (end at midnight).Test period 2: Start on December 17, 2009 (at midnight), end on December 26, 2009 (end at midnight).Test period 3: Start on July 30, 2010 (at midnight), end on August 8, 2010 (end at midnight).Test period 4: Start on September 2, 2010 (at midnight), end on September 11, 2010 (end at midnight).For each test day (24 hours), the researchers selected three random one-hour-long sections of video for review(stratified random). This resulted in a total of 30 hours during which the reliability of the system was investigated foreach test period, and 120 hours for the four test periods combined. The images from the time periods that wereanalyzed were all saved on DVD. Time periods that were not analyzed were not saved.In addition, there were two ten day test-periods without domesticated animals present in the enclosure:Test period 1: Start on December 7, 2009 (at midnight), end on December 16, 2009 (end at midnight).Test period 2: Start on January 5, 2010 (at midnight), end on January 14, 2010 (end at midnight).The detection data from these two periods were screened for the potential presence of detections (which may indicatefalse positives), and extreme environmental conditions (based on weather data from a nearby meteorological station).The researchers selected 10 hours from this ten day period for review. These hours were non-randomly selected basedon potential suspicious detection patterns (i.e., detections were reported while there are no domesticated animalspresent), and extreme environmental conditions.Reliability ParametersThe time periods reviewed were analyzed for valid detections, false positives, false negatives, and intrusions in thedetection area. These terms are defined below (see Huijser et al. 2009b for more details).False positives – A false positive was defined as “when the system reported the presence of an animal, butthere was no animal in the detection zone.” Thus, each incident in which a system’s data logger recorded adetection, but there was no animal present in the detection zone of that system, was recorded as a falsepositive. The date and time were recorded for all false positives.False negatives – A false negative was defined as “when an animal was present but was not detected by thesystem.” However, due to animal behavior and the design of some detection systems (i.e., some systems aredesensitized by the continuous presence of an animal), there are several ways for a false negative to occur.Therefore, various types of false negatives were distinguished and these were recorded separately.Intrusions in detection area – An intrusion was defined as “the presence of one or multiple animals in thedetection zone.” An intrusion began when one or more animals entered the detection zone and ended when allanimals left the detection zone.Reducing Wildlife-Vehicle Collisions 223 <strong>ICOET</strong> 2011 Proceedings