disruption of migration routes (Beckmann and Hilty 2010), and direct mortality from collisions with vehicles (Huijserand McGowen 2010).Since 1990, Utah’s population has grown at an average annual rate of 2.5%, an increase of ~1.1 million peoplestatewide (Governor’s Office of Planning and Budget 2009). The result has been a need for, and an increase intransportation infrastructure, including both new road construction as well as the reconstruction of existing routesaimed at increasing capacity for additional motorists. This usually results in the widening of the road footprint and anincrease in speeds. The result is a higher occurrence of wildlife-vehicle collisions (WVCs) in these areas.The Utah Division of Wildlife Resources (UDWR) and Utah Department of Transportation (UDOT) have been formallyinvolved in removing wildlife carcasses from heavily used transportation routes since the mid-1990’s. Althoughcarcasses of all species were removed, the focus was on big game species, primarily mule deer (Odocoileus hemionus)and elk (Cervus canadensis), as these two species have the highest occurrence of WVCs and pose the greatest safetythreat to the traveling public. Initially, this effort was done primarily to clear the ROW of “litter” and to minimize thesocial outcry of the traveling public at seeing dead animals along the road. UDOT has hired private contractors for thiseffort, while UDWR continues to use existing personnel. Early on, there was no requirement to document the number ofcarcasses being collected so very few records were kept. After a time, it was realized that the number of WVCs wassignificant, and there was a need to quantify the problem. Beginning in 2003 at the request of UDWR, UDOT beganrequiring their contractors to track the number of WVCs occurring along specified routes by logging each carcass theycollected to the nearest milepost. UDWR also required logging of carcass removals by their own personnel. In an effortto become better coordinated, UDWR and UDOT entered into a Memorandum of Understanding in 2007 outliningspecific responsibilities of both agencies including: specific transportation routes each entity was responsible for,standardized data forms to document carcasses being removed, and the creation of a roadkill database where WVCdata would be housed long-term. This agreement remains in effect at the present time.The collection of WVC data during the past decade has allowed transportation and wildlife officials to better understandthe impact that major transportation routes are having on wildlife populations in Utah, and to look at ways to improvepublic safety. Coincidentally, the collection and analysis of WVC data just happened to correspond to the planning andimplementation of several high profile transportation reconstruction projects in the state. Two of these, U.S. Highway 6(US 6) and Interstate 70 (I-70), will be used as case studies to discuss how WVC data was used in concert with othertools to identify, recommend, and implement successful transportation mitigation in Utah. The US 6 examplescorrespond to major reconstruction projects that had been identified in environmental planning documents, while theI-70 example was a stand-alone wildlife mitigation retrofit project.STUDY AREASU.S. Highway 6Due to the high number of annual traffic accidents, US 6 from Spanish Fork to Price is a 63-mile (101 km) stretch oftenreferred to as one of the most dangerous roadways in Utah (see Figure 1). It lies in central Utah and transects a varietyof critical wildlife habitats throughout much of its course, including critical big game winter ranges and important fishpassage corridors. US 6 traverses a variety of vegetation zones that range from pinyon-juniper hills and sagebrush flatsto aspen forests. Elevation ranges from 1,500 -1,700 m (4,500 – 5,500 feet) at Spanish Fork and Price respectively,to nearly 2,300 m (7,500 feet) at Soldier Summit. US 6 bisects the Wasatch Mountain Range which is characterized byhigh peaks and steep canyons. This stretch of US 6 transects many streams and creeks, and parallels a major rail lineresulting in numerous water and rail crossings. The number of average daily vehicle trips ranges from about 9,000near Spanish Fork to 12,000 at Price (Utah Department of Transportation 2009).Interstate 70I-70 from the junction of Interstate 15 (I-15) to Richfield lies in south central Utah. Elevation ranges between 1,600 –2,130 m (5,200 to 7,000 feet). In this area, I-70 crosses through critical big game winter ranges and a historicalmigration route. The first seven miles of I-70 near its junction with I-15 is the second study area presented in thispaper (see Figure 1). Vegetation types are composed mainly of pinyon-juniper woodlands, mixed sagebrush-oakbrush,and mountain brush. This stretch of I-70 runs nearly east-west and transects the Pahvant Range to the north and theTushar Mountains on the south. Daily vehicle trips range between 5,000 near Cove Fort on the west to nearly 7,000 atRichfield to the east (Utah Department of Transportation 2009).<strong>ICOET</strong> 2011 Proceedings 180 Session <strong>COM</strong>-1
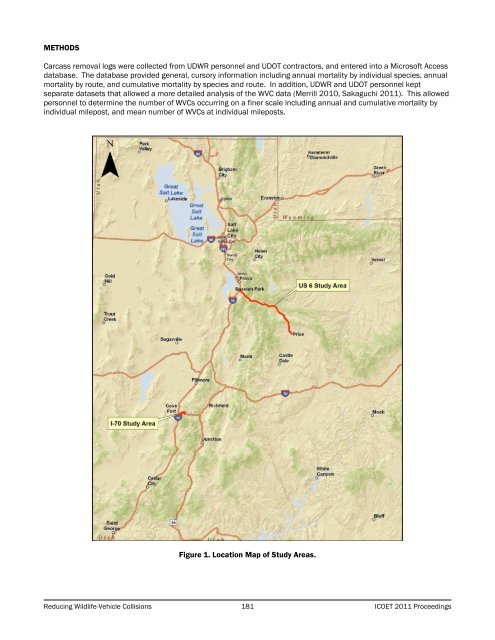
METHODSCarcass removal logs were collected from UDWR personnel and UDOT contractors, and entered into a Microsoft Accessdatabase. The database provided general, cursory information including annual mortality by individual species, annualmortality by route, and cumulative mortality by species and route. In addition, UDWR and UDOT personnel keptseparate datasets that allowed a more detailed analysis of the WVC data (Merrill 2010, Sakaguchi 2011). This allowedpersonnel to determine the number of WVCs occurring on a finer scale including annual and cumulative mortality byindividual milepost, and mean number of WVCs at individual mileposts.Figure 1. Location Map of Study Areas.Reducing Wildlife-Vehicle Collisions 181 <strong>ICOET</strong> 2011 Proceedings