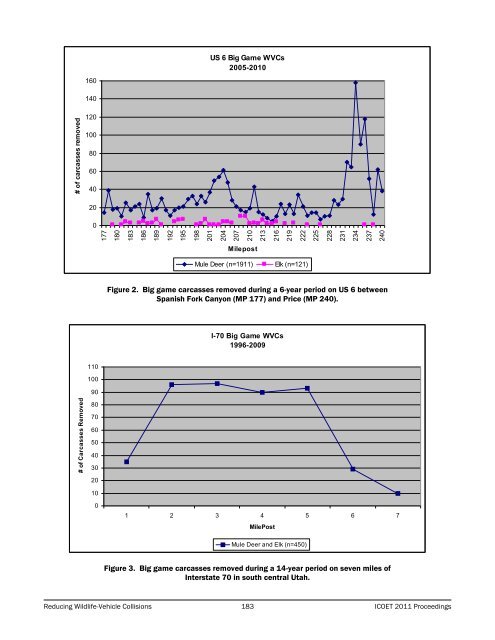
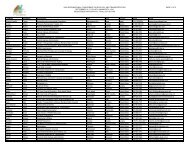
Once this finer scale analysis was complete, wildlife managers and transportation officials were able to take a closerlook at specific stretches of roadway, US 6 and I-70 in our examples, and were able to detect which stretches alongthese routes had the highest level of WVCs. They were able to compare the highest WVC areas to other “hotspots”(Kassar and Bissonette 2005) and high priority habitat linkages (Ruediger 2007, Ruediger et. al. 2007a) that had beenpreviously identified.RESULTSWildlife Vehicle Collision DataUS 6The cumulative number of big game WVCs along the US 6 study area is shown for the period 2005-2010 (see Figure 2).A total of 1,911 mule deer and 121 elk carcasses were removed from this 63-mile (101 km) stretch of highway ROWduring this 6-year period, a combined average of 339 annually (Sakaguchi 2011). This level is three times higher thanthat reported in the final Environmental Impact Statement (EIS) for US 6 using UDOT traffic and safety data (US 6 FEIS2005). In addition to mule deer and elk, mortalities from a variety of other wildlife species’ were also documentedincluding: black bear (Ursus americanus), moose (Alces alces), pronghorn (Antilocapra americana), red fox (Vulpesvulpes), raccoon (Procyon lotor), coyote (Canis latrans), bobcat (Lynx rufus), badger (Taxidea taxus), beaver (Castorcanadensis), wild turkey (Meleagris gallopavo) and several species of raptors.The presence of several mortality spikes on the graph, primarily those at milepost(s) 178, 187, 201-206, 211, 221,and 232-237, identify the highest collision areas within this stretch of US 6, and these areas were prioritized asneeding additional analysis to determine whether potential mitigation was needed.I-70The cumulative number of big game WVCs for the I-70 study area is shown for the period 1996-2009 (see Figure 3).A total of 450 big game carcasses were removed from this seven mile (11 km) stretch during that period, 367 of thesebeing mule deer and 83 being elk (Merrill 2010). A spike in WVCs between mileposts 2 to 6 illustrates a consistent highkill zone for big game. Ruediger and others reported that this stretch of I-70 has the one of the highest rates of WVCsanywhere in Utah, and may be one of the highest for elk anywhere in the United States (Ruediger et. al. 2007a). The WVCdata presented here support those claims. Carcass data for other species was not available in the I-70 dataset.Mitigation FeaturesWildlife and transportation officials were cognizant of the fact that the WVC information was collected only to the nearestmilepost and could not be used exclusively in determining where specific mitigation features should be located. Fieldvisits, knowledge of local biologists and transportation personnel, and other factors were also utilized to further define themost critical stretches of roadway and identify specific locations where mitigation projects should be targeted.US 6Since 2005, several major reconstruction projects have occurred on US 6, most of which have included significantwildlife mitigation features. With the WVC data showing a large number of collisions with deer and/or elk, several largewildlife crossing structures were programmed into highway reconstruction projects including three span bridgedunderpasses and one of the largest box culverts ever built in Utah (see Figures 4-7). These structures were designedwith the idea that if built to pass big game, most other species of wildlife would use them as well. Wildlife exclusionaryfencing and escape ramps were also included as part of the mitigation for these projects.I-70With more than a decade of documenting WVCs between mileposts 1 and 7, UDWR and UDOT personnel knew thatmitigation was needed in this stretch, and felt confident they knew the location it should be placed. With the highnumber of big game collisions occurring, especially those involving elk, officials recommended that underpasses andfencing be installed. Using the WVC data coupled with a prior habitat linkage analysis (Ruediger et. al. 2007a), on-thegroundsite visits, and photographic evidence, two paired bridged underpasses were planned for milepost 5.3. Afterseveral years of trying, funding was programmed and these features were installed in 2010 (see Figure 8). The use ofWVC data was key to securing the needed funding for this project as a cost-benefit analysis showed that thesestructures would “pay for themselves” in a relatively short period of time.<strong>ICOET</strong> 2011 Proceedings 182 Session <strong>COM</strong>-1
US 6 Big Game WVCs2005-2010160140# of carcasses removed120100806040200177180183186189192195198201204207210213216219222225228231234237240MilepostMule Deer (n=1911)Elk (n=121)Figure 2. Big game carcasses removed during a 6-year period on US 6 betweenSpanish Fork Canyon (MP 177) and Price (MP 240).I-70 Big Game WVCs1996-200911010090# of Carcasses Removed807060504030201001 2 3 4 5 6 7MilePostMule Deer and Elk (n=450)Figure 3. Big game carcasses removed during a 14-year period on seven miles ofInterstate 70 in south central Utah.Reducing Wildlife-Vehicle Collisions 183 <strong>ICOET</strong> 2011 Proceedings