C. Fiegna, S. C. Brugger, F. M. Bufler, P. Dollfus, V ... - ETH Zürich
C. Fiegna, S. C. Brugger, F. M. Bufler, P. Dollfus, V ... - ETH Zürich
C. Fiegna, S. C. Brugger, F. M. Bufler, P. Dollfus, V ... - ETH Zürich

You also want an ePaper? Increase the reach of your titles
YUMPU automatically turns print PDFs into web optimized ePapers that Google loves.
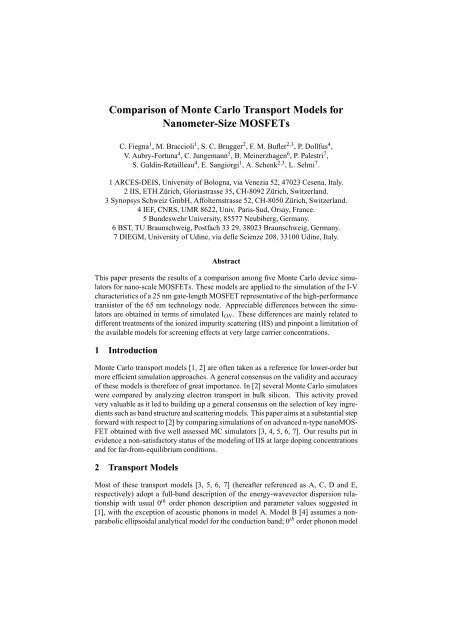
Comparison of Monte Carlo Transport Models forNanometer-Size MOSFETsC. <strong>Fiegna</strong> 1 , M. Braccioli 1 , S. C. <strong>Brugger</strong> 2 , F. M. <strong>Bufler</strong> 2,3 , P. <strong>Dollfus</strong> 4 ,V. Aubry-Fortuna 4 , C. Jungemann 5 , B. Meinerzhagen 6 , P. Palestri 7 ,S. Galdin-Retailleau 4 , E. Sangiorgi 1 , A. Schenk 2,3 , L. Selmi 7 .1 ARCES-DEIS, University of Bologna, via Venezia 52, 47023 Cesena, Italy.2 IIS, <strong>ETH</strong> <strong>Zürich</strong>, Gloriastrasse 35, CH-8092 <strong>Zürich</strong>, Switzerland.3 Synopsys Schweiz GmbH, Affolternstrasse 52, CH-8050 <strong>Zürich</strong>, Switzerland.4 IEF, CNRS, UMR 8622, Univ. Paris-Sud, Orsay, France.5 Bundeswehr University, 85577 Neubiberg, Germany.6 BST, TU Braunschweig, Postfach 33 29, 38023 Braunschweig, Germany.7 DIEGM, University of Udine, via delle Scienze 208, 33100 Udine, Italy.AbstractThis paper presents the results of a comparison among five Monte Carlo device simulatorsfor nano-scale MOSFETs. These models are applied to the simulation of the I-Vcharacteristics of a 25 nm gate-length MOSFET representative of the high-performancetransistor of the 65 nm technology node. Appreciable differences between the simulatorsare obtained in terms of simulated I ON . These differences are mainly related todifferent treatments of the ionized impurity scattering (IIS) and pinpoint a limitation ofthe available models for screening effects at very large carrier concentrations.1 IntroductionMonte Carlo transport models [1, 2] are often taken as a reference for lower-order butmore efficient simulation approaches. A general consensus on the validity and accuracyof these models is therefore of great importance. In [2] several Monte Carlo simulatorswere compared by analyzing electron transport in bulk silicon. This activity provedvery valuable as it led to building up a general consensus on the selection of key ingredientssuch as band structure and scattering models. This paper aims at a substantial stepforward with respect to [2] by comparing simulations of on advanced n-type nanoMOS-FET obtained with five well assessed MC simulators [3, 4, 5, 6, 7]. Our results put inevidence a non-satisfactory status of the modeling of IIS at large doping concentrationsand for far-from-equilibrium conditions.2 Transport ModelsMost of these transport models [3, 5, 6, 7] (hereafter referenced as A, C, D and E,respectively) adopt a full-band description of the energy-wavevector dispersion relationshipwith usual 0 th order phonon description and parameter values suggested in[1], with the exception of acoustic phonons in model A. Model B [4] assumes a nonparabolicellipsoidal analytical model for the conduction band; 0 th order phonon model
is assumed for f 2 , f 3 , g 3 intervalley transitions, while a 1 st order model is assumed forthe f 1 , g 1 , g 2 phonons.Concerning IIS, different approaches are adopted by the different groups: A adopts theBrooks Herring model with a screening length evaluated assuming equilibrium Fermi-Dirac electron energy distribution, with temperature coincident with lattice temperature(T=T L ); groups B and D implement a model similar to the one of A, with screeningcalculated assuming non-degenerate conditions (Maxwell-Boltzmann distribution);groups C and E use the Ridley model with a screening length computed according to aMaxwell-Boltzmann distribution with temperature self-consistently related to the carriermean energy (T=T e =2 < E > /(3K B ), rescaled, so that T e =300 K is recovered atequilibrium). Finally, while A computes the exact k-dependent scattering rate, B, C, Dand E adopt a more efficient scheme in which the scattering rate is calculated accordingto an energy-dependent inverse microscopic relaxation time and the final state israndomly selected. All the adopted models present limitations:• A, B, D assume equilibrium distributions;• C and E assume a simple heated-maxwellian approximation for the non-equilibriumdistribution;• B, C, D and E do not account for degeneracy effects.As it is well known IIS models fail to properly model mobility in the high-dopingconcentration limit ([6] and references therein); all the groups tried to compensate thiseffect by adopting a doping concentration dependent pre-factor for the IIS-rate, whosevalue is tuned to obtain agreement with experimental mobility data for majority carriersat large doping densities.Surface roughness (SR) is treated by the reflective-diffusive model in [4, 5, 6, 7], while[3] adopts an effective-field dependent scattering rate. In all cases, SR parameters aretuned in order to fit the universal mobility curve for n-MOSFETs.While A, B, D and E adopt an ensemble time-dependent Monte Carlo algorithm withself-consistency achieved through the frequent solution of the linear Poisson equation,C achieves self-consistency by iterating single-particle Monte Carlo transport simulationswith solutions of the non-linear Poisson equation until convergence is reached.In order to focus on the comparison of semiclassical transport models, quantum correctionsthat mimic the effects of carrier confinement are not included in the simulation.3 Results and DiscussionThe simulated device is a bulk n-MOSFET with 25 nm gate length and main characteristicsdefined in agreement with the specifications of the ITRS roadmap for the highperformancelogic transistors of the 65 nm technology node. The distance between thesource/drain contact and the gate edges is 50 nm, including a 23 nm long highly doped(N D ≈ 2 × 10 20 cm −3 ) region and a 27 nm extension region with N D ≈ 10 20 cm −3 .Notice that these doping levels are larger than usually assumed in Monte Carlo devicesimulation. At large current levels a significant longitudinal electric field is present inthe shallow moderately-doped extension regions, leading to appreciable carrier heatingeven at the source end of the channel. These latter characteristics make this simulation
I DS[mA/µm]0.80.60.40.2ABCDEA alt.I DS[mA/µm]32.521.51V DS= 0.1 V 0.5ABCDEA alt.V DS= 1.1 V00 0.5 1V GS[V]00 0.5 1V GS[V]Figure 1: Simulated I-V transfer characteristics for the 25 nm MOSFET without ionizedimpurityscattering; V DS =0.1 V (left) and V DS =1.1 V (right). Main device parameters are:L G =25nm EOT=0.9 nm, N SUB =3·10 18 cm −3 (plus halo implant).Longitudinal Electric Field [V/cm]1.5×10 61.0×10 65.0×10 50.0ABCD-30 -20 -10 0 10 20 30Position [nm]Average velocity [cm/s]2.5×10 72.0×10 71.5×10 71.0×10 75.0×10 6ABCD0.0-40 -20 0 20 40Position [nm]Figure 2: Longitudinal field (left) and average velocity (right) along the channel for the 25 nmMOSFET biased at V GS =V DS =1.0 V. Ionized-impurity scattering not included in the simulation.Averages in the vertical direction have been performed according to the electron concentration.particularly challenging, as the IIS models are developed for quasi-equilibrium conditionsand tend to fail at very large doping densities.Figure 1 reports the transfer characteristics in the linear and saturation regimes, calculatedwithout including the effect of IIS. A good agreement is found in saturation,while model A predicts much lower current in the linear region. This is mainly dueto the different deformation potential for the acoustic-phonons (D AC ) compared to theother partners (14.6 eV vs. 9 eV), since the model used for SR requires, in order to fitthe universal mobility curve, an increment of phonon scattering compared to the caseof bulk silicon, as is required when computing mobility for a 2-D electron gas [8]. Furthermore,model A has been calibrated to work with quantum corrections, turned-off inthis comparison. When model A is modified to become consistent with model D, i.e.D AC =9 eV and specular/diffusive surface scattering (A alt. in Fig. 1 left), a much betteragreement is found. Mutual agreement between models is confirmed also in terms ofinternal quantities (Fig. 2).When IIS is included (Fig. 3), a significant disagreement between the models is found
I DS[mA/µm]0.30.20.1ABCDEV DS= 0.1 V00 0.5 1V GS[V]I DS[mA/µm]21.510.5ABCDEV DS= 1.1 V00 0.5 1V GS[V]Figure 3: Simulated I-V transfer characteristics for the 25 nm MOSFET with ionized-impurityscattering; V DS =0.1 V (left), V DS =1.1 V (right); open circle: model A using T e in the evaluationof the screening length for ionized-impurity scattering.at large V DS , pinpointing the existence of subtle issues related to the treatment of thisscattering mechanism. In particular, the analysis reveals the role played by the differenttreatment of screening effects. In an attempt to understand whether the discrepanciesmainly involve electron transport in the channel or in the S/D regions, the MOSFEThas been simulated with model A under I ON bias condition, switching off the IIS insidethe transistor’s channel below the gate electrode. The calculated current was increasedby a mere 3% with respect to the standard simulation, showing that the IIS inside thechannel does not significantly affect the current and giving indirect indication of the factthat most of the ISS-related discrepancies involve the transport in the source and drainregions. The impact of different treatments of the screening effect has been addressedby changing model A in order to account for T e instead of T L as in models C and E.This led to a slight reduction of the ON-current (open circles in Fig. 3), still insufficientto eliminate the difference with respect to models C and E.Based on our results and on the existence of limitations affecting the IIS models, weconclude that more work is needed in order to provide an improved description of thisrelevant scattering mechanism.Acknowledgements Work partially supported by the European Commission in theframe of SINANO Network of Excellence (IST-506844).References[1] Jacoboni et al. Rev. Mod. Phys. 55, 645, 1983.[2] A. Abramo et al. IEEE Trans. Electron Devices 41, 1646, 1994.[3] P. Palestri et al. Solid State Electron. 49, 727, 2005.[4] V. Aubry-Fortuna et al., Semicond. Sci. Tech. 21 422, 2006.[5] F. M. <strong>Bufler</strong> et al. IEEE Trans. Electron Devices 50, 418, 2003.[6] C. Jungemann and B. Meinerzhagen, “Hierarchical Device Simulation: The Monte-CarloPerspective”, Springer, 2003.[7] S. C. <strong>Brugger</strong>, et al. SIAM Journ. of Appl. Math. SIAP 66 (4), 1209, 2006.[8] C. Jungemann et al. Solid-State Electron. 36, 1529, 1993.