Creating Prosperity: the role of higher education in ... - Universities UK
Creating Prosperity: the role of higher education in ... - Universities UK
Creating Prosperity: the role of higher education in ... - Universities UK

Create successful ePaper yourself
Turn your PDF publications into a flip-book with our unique Google optimized e-Paper software.
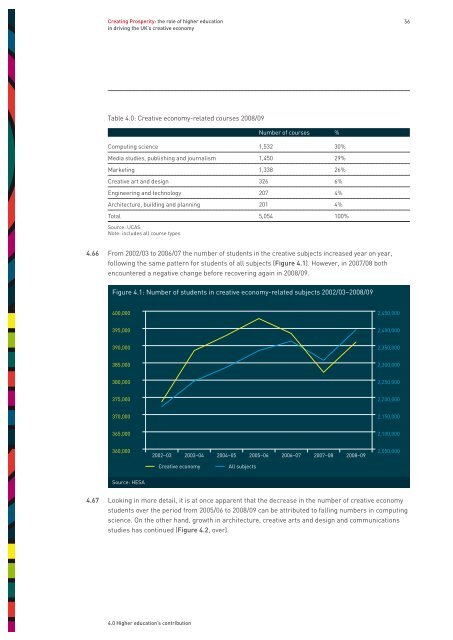
<strong>Creat<strong>in</strong>g</strong> <strong>Prosperity</strong>: <strong>the</strong> <strong>role</strong> <strong>of</strong> <strong>higher</strong> <strong>education</strong><strong>in</strong> driv<strong>in</strong>g <strong>the</strong> <strong>UK</strong>’s creative economy36Table 4.0: Creative economy-related courses 2008/09Number <strong>of</strong> courses %Comput<strong>in</strong>g science 1,532 30%Media studies, publish<strong>in</strong>g and journalism 1,450 29%Market<strong>in</strong>g 1,338 26%Creative art and design 326 6%Eng<strong>in</strong>eer<strong>in</strong>g and technology 207 4%Architecture, build<strong>in</strong>g and plann<strong>in</strong>g 201 4%Total 5,054 100%Source: UCASNote: <strong>in</strong>cludes all course types4.66 From 2002/03 to 2006/07 <strong>the</strong> number <strong>of</strong> students <strong>in</strong> <strong>the</strong> creative subjects <strong>in</strong>creased year on year,follow<strong>in</strong>g <strong>the</strong> same pattern for students <strong>of</strong> all subjects (Figure 4.1). However, <strong>in</strong> 2007/08 bo<strong>the</strong>ncountered a negative change before recover<strong>in</strong>g aga<strong>in</strong> <strong>in</strong> 2008/09.Figure 4.1: Number <strong>of</strong> students <strong>in</strong> creative economy-related subjects 2002/03–2008/09400,0002,450,000395,0002,400,000390,0002,350,000385,0002,300,000380,0002,250,000375,0002,200,000370,0002,150,000365,0002,100,000360,0002002–032003–042004–052005–062006–072007–082008–092,050,000Creative economyAll subjectsSource: HESA4.67 Look<strong>in</strong>g <strong>in</strong> more detail, it is at once apparent that <strong>the</strong> decrease <strong>in</strong> <strong>the</strong> number <strong>of</strong> creative economystudents over <strong>the</strong> period from 2005/06 to 2008/09 can be attributed to fall<strong>in</strong>g numbers <strong>in</strong> comput<strong>in</strong>gscience. On <strong>the</strong> o<strong>the</strong>r hand, growth <strong>in</strong> architecture, creative arts and design and communicationsstudies has cont<strong>in</strong>ued (Figure 4.2, over).4.0 Higher <strong>education</strong>’s contribution