- Page 1 and 2:
Wolfram webMathematica USER GUIDE
- Page 3 and 4:
webMathematica Users GuideIntroduct
- Page 5 and 6:
Web Server Connections . . . . . .
- Page 7 and 8:
Web Services . . . . . . . . . . .
- Page 9 and 10:
Security Validation . . . . . . . .
- Page 11 and 12:
KernelPool . . . . . . . . . . . .
- Page 13:
LiveGraphics3D . . . . . . . . . .
- Page 16 and 17:
2 webMathematica User GuideWhy Use
- Page 18 and 19:
4 webMathematica User GuideServer-B
- Page 20 and 21:
6 webMathematica User GuideResearch
- Page 22 and 23:
8 webMathematica User Guide2. webMa
- Page 24 and 25:
10 webMathematica User GuideExpress
- Page 26 and 27:
12 webMathematica User GuideClient
- Page 28 and 29:
14 webMathematica User GuideThis ch
- Page 30 and 31:
16 webMathematica User GuideWhen yo
- Page 32 and 33:
18 webMathematica User Guide[server
- Page 34 and 35:
20 webMathematica User GuideIt is o
- Page 36 and 37:
22 webMathematica User Guideinstall
- Page 38 and 39:
24 webMathematica User GuideConfigu
- Page 40 and 41:
26 webMathematica User GuideConfigu
- Page 42 and 43:
28 webMathematica User GuideIn thes
- Page 44 and 45:
30 webMathematica User GuideInstall
- Page 46 and 47:
32 webMathematica User GuideThe MSP
- Page 48 and 49: 34 webMathematica User GuideIn addi
- Page 50 and 51: If you wish to use webMathematica i
- Page 52 and 53: 38 webMathematica User GuideAfter t
- Page 54 and 55: 40 webMathematica User GuideHello.j
- Page 56 and 57: 42 webMathematica User GuideA form
- Page 58 and 59: 44 webMathematica User GuideMathema
- Page 60 and 61: 46 webMathematica User GuideIf[inte
- Page 62 and 63: 48 webMathematica User Guide${msp:e
- Page 64 and 65: 50 webMathematica User GuideThe pri
- Page 66 and 67: 52 webMathematica User GuideNeeds["
- Page 68 and 69: 54 webMathematica User GuideInterac
- Page 70 and 71: 56 webMathematica User GuideIf[MSPV
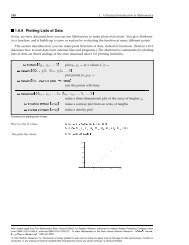
- Page 72 and 73: 58 webMathematica User GuidePlottin
- Page 74 and 75: 60 webMathematica User Guide<set
- Page 76 and 77: Developing Your Own PagesOnce you h
- Page 78 and 79: 64 webMathematica User GuideVariabl
- Page 80 and 81: 66 webMathematica User Guidex = 109
- Page 82 and 83: ApplicationsThis section shows how
- Page 84 and 85: 70 webMathematica User GuideHowever
- Page 86 and 87: 72 webMathematica User GuideThis sh
- Page 88 and 89: 74 webMathematica User GuideOne res
- Page 90 and 91: 76 webMathematica User GuideThis co
- Page 92 and 93: 78 webMathematica User GuideThis me
- Page 94 and 95: 80 webMathematica User GuideThe fol
- Page 96 and 97: 82 webMathematica User GuideIntegra
- Page 100 and 101: 86 webMathematica User Guide{"cx"->
- Page 102 and 103: 88 webMathematica User GuideIn[4]:=
- Page 104 and 105: 90 webMathematica User GuideIn[4]:=
- Page 106 and 107: 92 webMathematica User GuideHTMLTab
- Page 108 and 109: 94 webMathematica User GuideManipul
- Page 110 and 111: 96 webMathematica User GuideIn the
- Page 112 and 113: 98 webMathematica User GuideThese a
- Page 114 and 115: 100 webMathematica User GuideAn alt
- Page 116 and 117: 102 webMathematica User GuideNumber
- Page 118 and 119: 104 webMathematica User GuideIn thi
- Page 120 and 121: 106 webMathematica User GuideNumber
- Page 122 and 123: data = SQLSelect[conn, {"ROYSCHED"}
- Page 124 and 125: 110 webMathematica User GuideA fina
- Page 126 and 127: 112 webMathematica User GuideInstal
- Page 128 and 129: 114 webMathematica User GuideThe ex
- Page 130 and 131: 116 webMathematica User GuideIn thi
- Page 132 and 133: 118 webMathematica User Guideexpres
- Page 134 and 135: A page that contains an evaluateQue
- Page 136 and 137: 122 webMathematica User GuideOne fo
- Page 138 and 139: 124 webMathematica User GuideCreati
- Page 140 and 141: 126 webMathematica User GuideCertai
- Page 142 and 143: 128 webMathematica User Guidefuncti
- Page 144 and 145: 130 webMathematica User GuideIf[ $$
- Page 146 and 147: 132 webMathematica User Guide}catch
- Page 148 and 149:
134 webMathematica User GuideInform
- Page 150 and 151:
136 webMathematica User Guidevar ex
- Page 152 and 153:
138 webMathematica User Guide- - -
- Page 154 and 155:
ServiceReturn[EchoString] = _String
- Page 156 and 157:
esult = With[{var = Symbol["x"]}, P
- Page 158 and 159:
ByRef Serializer As SoapSerializer)
- Page 160 and 161:
146 webMathematica User Guidespecif
- Page 162 and 163:
148 webMathematica User GuideIn[2]:
- Page 164 and 165:
150 webMathematica User GuideAltern
- Page 166 and 167:
152 webMathematica User GuideNow Ec
- Page 168 and 169:
154 webMathematica User GuideThis i
- Page 170 and 171:
156 webMathematica User GuideOne im
- Page 172 and 173:
158 webMathematica User GuideIf[ in
- Page 174 and 175:
160 webMathematica User Guidetmp =
- Page 176 and 177:
162 webMathematica User GuideThe Ma
- Page 178 and 179:
164 webMathematica User GuideHere i
- Page 180 and 181:
166 webMathematica User GuideWhen e
- Page 182 and 183:
168 webMathematica User GuideGraphi
- Page 184 and 185:
170 webMathematica User GuideMultip
- Page 186 and 187:
172 webMathematica User GuideA samp
- Page 188 and 189:
174 webMathematica User GuideNeeds[
- Page 190 and 191:
TroubleshootingThis section describ
- Page 192 and 193:
178 webMathematica User GuideCheck
- Page 194 and 195:
180 webMathematica User Guidesu tom
- Page 196 and 197:
182 webMathematica User GuideTomcat
- Page 198 and 199:
184 webMathematica User GuideNot Us
- Page 200 and 201:
186 webMathematica User Guidedocume
- Page 203:
Configuration
- Page 206 and 207:
192 webMathematica User GuideCollec
- Page 208 and 209:
194 webMathematica User GuideFrontE
- Page 210 and 211:
196 webMathematica User GuideJLinkN
- Page 212 and 213:
198 webMathematica User GuideKernel
- Page 214 and 215:
200 webMathematica User GuideKernel
- Page 216 and 217:
202 webMathematica User GuideKernel
- Page 218 and 219:
204 webMathematica User GuideKernel
- Page 220 and 221:
206 webMathematica User GuideKernel
- Page 222 and 223:
208 webMathematica User GuideKernel
- Page 224 and 225:
210 webMathematica User GuideKernel
- Page 226 and 227:
212 webMathematica User GuideSecuri
- Page 228 and 229:
214 webMathematica User GuideURLPat
- Page 231 and 232:
webMathematica User Guide 217HTMLCh
- Page 233 and 234:
webMathematica User Guide 219HTMLFo
- Page 235 and 236:
webMathematica User Guide 221HTMLSe
- Page 237 and 238:
webMathematica User Guide 223TUTORI
- Page 239 and 240:
webMathematica User Guide 225In[2]:
- Page 241 and 242:
webMathematica User Guide 227MSPBlo
- Page 243 and 244:
webMathematica User Guide 229TUTORI
- Page 245 and 246:
webMathematica User Guide 231In[4]:
- Page 247 and 248:
webMathematica User Guide 233The fo
- Page 249 and 250:
webMathematica User Guide 235MSPGet
- Page 252 and 253:
238 webMathematica User GuideIn[1]:
- Page 254 and 255:
240 webMathematica User GuideIn[1]:
- Page 256 and 257:
242 webMathematica User GuideMSPMan
- Page 258 and 259:
244 webMathematica User GuideYou ca
- Page 260 and 261:
246 webMathematica User GuideYou ca
- Page 262 and 263:
248 webMathematica User GuideMSPMan
- Page 264:
250 webMathematica User GuideMSPPag
- Page 267 and 268:
webMathematica User Guide 253The th
- Page 269 and 270:
webMathematica User Guide 255MSPSes
- Page 271 and 272:
webMathematica User Guide 257SEE AL
- Page 273 and 274:
webMathematica User Guide 259MSPToE
- Page 275 and 276:
webMathematica User Guide 261MSPToE
- Page 277 and 278:
webMathematica User Guide 263In[4]:
- Page 279 and 280:
webMathematica User Guide 265Here a
- Page 281:
webMathematica User Guide 267TUTORI
- Page 285 and 286:
webMathematica User Guide 271Config
- Page 287 and 288:
webMathematica User Guide 273webMat
- Page 289 and 290:
webMathematica User Guide 275Web In
- Page 291:
Tags
- Page 294 and 295:
280 webMathematica User GuideTUTORI
- Page 296 and 297:
282 webMathematica User GuideTUTORI
- Page 298 and 299:
284 webMathematica User Guidegetget
- Page 301 and 302:
webMathematica User Guide 287Proces
- Page 303 and 304:
webMathematica User Guide 289Mathem
- Page 305 and 306:
webMathematica User Guide 291Determ
- Page 307 and 308:
webMathematica User Guide 293If any
- Page 309 and 310:
webMathematica User Guide 295The ta
- Page 311 and 312:
webMathematica User Guide 297Mathem
- Page 313 and 314:
webMathematica User Guide 299Site C
- Page 315 and 316:
webMathematica User Guide 301Securi
- Page 317 and 318:
webMathematica User Guide 303In add
- Page 319 and 320:
webMathematica User Guide 305Active
- Page 321 and 322:
webMathematica User Guide 307When t
- Page 323 and 324:
webMathematica User Guide 309LinksT
- Page 325 and 326:
webMathematica User Guide 311Web Br