that had a lower level <strong>of</strong> congestion than the others(the delay on a link was equal to the differencebetween actual travel time at a specific movement—when a decision is made—<strong>and</strong> free flow traveltime). A choice was considered negative if the subjectpicked the link with a higher level <strong>of</strong> congestion.We focused on the delay on a link when a particularmovement occurred instead <strong>of</strong> travel time, becausethe links are different in length <strong>and</strong> speed limit.Sixty-three subjects completed 10 trial dayseach, for a total <strong>of</strong> 539 trial days in the drive mode(the remainder <strong>of</strong> the trial days were in the transitmode). During the trial days, 4,753 movements(decisions) were made on the 40 network links. Out<strong>of</strong> the 4,753 movements, 1,667 were excluded fromthe analysis, because the driver had no choice butto proceed onto a unique coming link. The remaining3,086 link choices make up the data used forthe BGEE model with binomial logistic function.The model was correlated because each subject hadmultiple choices in the data structure. The responsevariable was binary with the value <strong>of</strong> one for positivechoices <strong>and</strong> zero for negative choices. Theexplanatory variables follow:1. Information familiarity: one if the subject, inreal life, uses pre-trip <strong>and</strong>/or en route informationusually or everyday, zero otherwise.2. Information provision: one for trial dayswhere en route information was provided,zero otherwise.3. Same color: one if the two coming links hadthe same color (qualitative congestion level),zero otherwise. This variable tests the effect <strong>of</strong>qualitative vs. quantitative information.4. System learning: one for the second five trialdays <strong>of</strong> the simulations, zero for the first five.This is based on the assumption that the subjectin the last five simulation runs is morefamiliar with the information system <strong>and</strong> canuse <strong>and</strong> benefit from it more effectively.5. Heavy rain: one for heavy rain conditions;zero for light rain or clear sky conditions.Weather conditions were provided as part <strong>of</strong>the information.6. Number <strong>of</strong> movements from the origin: representingthe closeness to the destination.Table 1 presents the results <strong>of</strong> the BGEE modelfor the independent case (no correlation is considered)<strong>and</strong> for the proposed exchangeable correlation.The differences in the results are due to the effect<strong>of</strong> correlation. By comparing the overall F statisticvalues for the two models, the exchangeable modelwas favored over the independent model. This indicatesthat the model has correlation that should beaccounted for.The modeling results showed that, in general, theprovision <strong>of</strong> en route information increases the likelihood<strong>of</strong> making a positive link choice. This meansthat the en route short-term information has a goodchance <strong>of</strong> being used. When the two coming linkshad the same qualitative level <strong>of</strong> congestion, driverswere less likely to make a positive choice. Thus, thequalitative information is more likely to be used thanthe quantitative information. Therefore, it is notenough to provide the driver with the expected traveltime or that there is congestion, but providing thedriver with information on the level <strong>of</strong> congestion isalso necessary.The following effects/interactions increase thelikelihood <strong>of</strong> following the en route short-terminformation:1. Being familiar with traffic information;2. Learning <strong>and</strong> being familiar with the systemthat provides the information;3. Heavy rain conditions;4. Being away from the origin, that is, close tothe destination (presented by the number <strong>of</strong>movements since the origin);5. Providing qualitative information in heavyrain conditions; <strong>and</strong>6. Being away from the origin <strong>and</strong> being familiarwith the device that provides the information.MGEE APPLICATIONThe long-term route choices <strong>of</strong> the subjects in theexperiment were used as the database for estimatingthis model. The 539 routes that were chosen duringthe 539 trial days (each subject chooses one routeeach trial day) were identified <strong>and</strong> categorized bythe sequence <strong>of</strong> links that were traversed on a giventrial day. The network used consists <strong>of</strong> four westeastexpressway/arterials that connect the origin to92 JOURNAL OF TRANSPORTATION AND STATISTICS V8, N1 2005
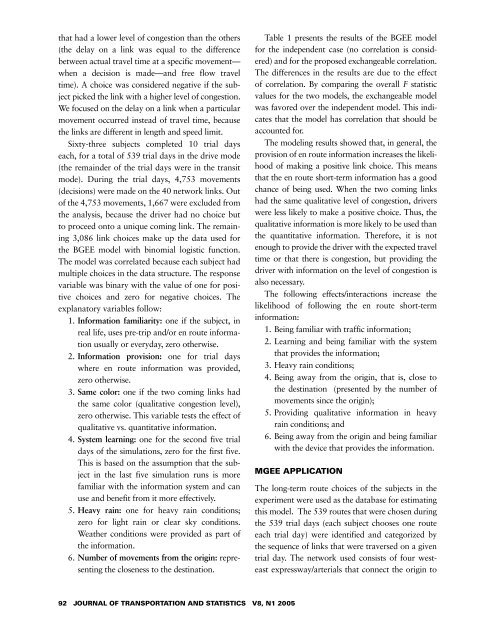
TABLE 1 Modeling Results for the BGEE Model with <strong>and</strong> without CorrelationWithout correlationWith correlationParameter Coefficient t statistic Coefficient t statisticIntercept –3.682 –20.29 –3.699 –20.11Information familiarity: 1 if subject usespre-trip <strong>and</strong>/or en route trafficinformation usually or everyday, 0otherwise0.406 10.12 0.421 9.94Information provision: 1 for scenario 4where en route information is providedwithout long-term advice, 0 otherwiseSame color: 1 if the two coming linkshad the same color (qualitativecongestion level), 0 otherwiseSystem learning: 1 for the second 5 trialdays <strong>of</strong> the experiment, 0 for the first 5trial daysHeavy rain: 1 for heavy rain condition, 0for light rain or clear sky0.236 2.07 0.243 2.11–0.467 –4.20 –0.476 –4.283.469 15.75 3.598 15.700.415 3.24 0.402 3.17Number <strong>of</strong> movements since the origin 0.610 9.78 0.634 9.61Interaction termsHeavy rain × Same color 0.453 2.25 0.536 2.16Number <strong>of</strong> movements since theorigin × System learning0.406 6.14 0.511 6.06Summary <strong>statistics</strong> df F statistic df F statisticOverall model 9 6,742.27 10 8,543.12the destination: named here MR1, MR2, MR3, <strong>and</strong>MR4.MR1 represents the expressway alternative onthe network. MR2 is a six-lane arterial while MR3is mainly a four-lane arterial with a relatively highnumber <strong>of</strong> traffic lights. MR4 is primarily a rural,two-lane, two-way arterial with a speed limitapproximately equal to that <strong>of</strong> MR2 <strong>and</strong> MR3.MR1 has the highest speed limit among the fouralternatives with few traffic lights, because it consistsmainly <strong>of</strong> expressway links. The network has als<strong>of</strong>ive local collectors that allow the subject to divertfrom one main route to another.In order to come up with a reasonable number <strong>of</strong>alternatives, in the analysis phase, the route choicesmade during the trial days were aggregated into theabove four main routes. We considered that eachchosen route belonged to a main route if most <strong>of</strong> thechosen route’s links belong to this main route. Thatis, a chosen route was assigned to a certain mainarterial if, <strong>and</strong> only if, the chosen route overlapswith this main arterial for a longer distance than itdoes with any <strong>of</strong> the other three main arterials. As aresult, the four main routes MR1, 2, 3, <strong>and</strong> 4 werechosen 374, 99, 37, <strong>and</strong> 29 times, respectively.The proposed MGEE method with a generalizedpolytomous logit function was employed to modelcorrelated route choices. The categorical dependentvariable has four alternatives, MR1, MR2, MR3,<strong>and</strong> MR4. These four alternatives form the fixedchoice set available for all subjects at all trial days.The reference alternative for which all attributes inthe analysis are set equal to zero is MR4. Thisroute was chosen because it was picked with lesserfrequency over the other three main routes. TheABDEL- ATY 93
- Page 1 and 2:
Volume 8 Number 1, 2005ISSN 1094-88
- Page 3 and 4:
A PEER-REVIEWED JOURNALJOURNAL OF T
- Page 5:
JOURNAL OF TRANSPORTATION AND STATI
- Page 9 and 10:
The Dynamics of Aircraft Degradatio
- Page 11 and 12:
would show a corresponding increase
- Page 13 and 14:
FIGURE 2 Aircraft Degradation and R
- Page 15 and 16:
so that- r 2 1 ) . (15)This change
- Page 17 and 18:
β⎛⎜⎜⎜= ⎜⎜⎜⎜⎝β 1
- Page 19:
and the fleet management practices
- Page 22 and 23:
of passengers and cargo to the econ
- Page 24 and 25:
TABLE 3 Cycle Parameters and Final
- Page 26 and 27:
TABLE 4 Forecasts of Numbers of Pas
- Page 28 and 29:
FIGURE 4 Slope Components for the Z
- Page 30 and 31:
2. LS: this kind of intervention ha
- Page 32 and 33:
CONCEPTTon-miles is the primary phy
- Page 34 and 35:
FIGURE 2 Air Freight, Express, and
- Page 36 and 37:
FIGURE 5 Railroad Ton-MilesTon-mile
- Page 38 and 39:
Transport Canada. 1990-2002. Transp
- Page 40 and 41:
32 JOURNAL OF TRANSPORTATION AND ST
- Page 42 and 43:
34 JOURNAL OF TRANSPORTATION AND ST
- Page 44 and 45:
36 JOURNAL OF TRANSPORTATION AND ST
- Page 46 and 47:
account for premature investments i
- Page 48 and 49:
zonal definitions. In Supernak et a
- Page 50 and 51: TABLE 2 Differences Among the 1972,
- Page 52 and 53: FIGURE 1 Research Sequence of Stage
- Page 54 and 55: TABLE 3 Regression Models by Metrop
- Page 56 and 57: TABLE 5 Tobit Models by Metropolita
- Page 58 and 59: Table 9 presents the predicted aver
- Page 60 and 61: TABLE 9 Aggregate Estimation Result
- Page 62 and 63: TABLE 11 Tobit Estimation of Nontra
- Page 64 and 65: Fleet, C. and S. Robertson. 1968. T
- Page 66 and 67: INTRODUCTIONThe Intermodal Surface
- Page 68 and 69: SUPPLEMENTAL STATE-LEVEL DATAIn add
- Page 70 and 71: METHODOLOGYAn exploratory factor an
- Page 72 and 73: Thus, a relatively large p value an
- Page 74 and 75: FIGURE 1 Final Model Specifications
- Page 76 and 77: CONCLUSIONSISTEA and the TEA-21 leg
- Page 78 and 79: Survey Question 2: Do your agency
- Page 80 and 81: Survey Question 11 (continued): Has
- Page 82 and 83: Survey Question 16: Every state has
- Page 84 and 85: Incidents have become one of the ma
- Page 86 and 87: FIGURE 1 Map of the M4 MotorwayA40A
- Page 88 and 89: TABLE 2 Variables in the Fuzzy Logi
- Page 90 and 91: FIGURE 9 Result of the ANN ModelMod
- Page 92 and 93: Garib, A., A.E. Radwan, and H. Al-D
- Page 94 and 95: usually the case for studies that u
- Page 96 and 97: proportional to overlap length. Rou
- Page 98 and 99: Fx ( )Working Correlation Matrix in
- Page 102 and 103: dependent variable takes on a value
- Page 104 and 105: TABLE 3 Modeling Results for the MG
- Page 106 and 107: REFERENCESAbdalla, M. 2003. Modelin
- Page 108 and 109: the relevant covariates including t
- Page 111 and 112: BOOK REVIEWSEconomic Impacts of Int
- Page 113: I found the second section dealing
- Page 116 and 117: TABLE 1 Airline Employees by Busine
- Page 119 and 120: JOURNAL OF TRANSPORTATION AND STATI
- Page 122: U.S. Department of TransportationRe