32 JOURNAL OF TRANSPORTATION AND STATISTICS V8, N1 2005TABLE A1 All Ton-Miles (continued)Eno Ton-Miles(billions)Mode 1990 1991 1992 1993 1994 1995 1996 1997 1998 1999 2000 2001Air 10 10 11 12 12 13 14 14 14 15 16 15Intercity truck 735 758 815 861 908 921 972 996 1,027 1,059 1,074 1,051Railroad 1,091 1,100 1,138 1,183 1,275 1,375 1,426 1,421 1,442 1,499 1,534 1,558Water 353 345 353 340 356 366 355 356 357 362 360 348Rivers/canals 292 290 298 284 298 306 297 294 295 305 303 297Great Lakes 61 55 56 56 58 60 58 62 62 57 58 51domesticPipeline 584 579 589 593 591 601 619 617 620 618 577 576Oil <strong>and</strong> oil 584 579 589 593 591 601 619 617 620 618 577 576productsNatural gas — — — — — — — — — — — —TOTAL 2,774 2,792 2,906 2,989 3,142 3,276 3,386 3,404 3,459 3,552 3,561 3,548TABLE A2 Airline Freight, Express, <strong>and</strong> Mail Revenue Ton-Miles(billions)1990 1991 1992 1993 1994 1995 1996 1997 1998 1999 2000 2001 2002 2003 pAir (improved 10.420 9.960 10.990 11.540 12.030 12.720 13.760 13.900 14.140 14.500 15.810 13.288 13.837 15.096BTS) 1,2Air (NTS) 3 9.064 8.860 9.820 10.675 11.803 12.520 12.861 13.601 13.840 14.202 14.983 13.088Air (Eno) 4 10.420 9.960 10.990 11.540 12.030 12.720 13.760 13.900 14.140 14.500 15.810 15.1801U.S. Department <strong>of</strong> Transportation, Bureau <strong>of</strong> Transportation Statistics, Office <strong>of</strong> Airline Information, Air Carrier Traffic Statistics Monthly (Washington, DC: 1990–2003), Freight, Express, <strong>and</strong> MailRevenue Ton-Miles table, p. 2, line 3.2 Federal Aviation Administration, supplementary <strong>statistics</strong>.3U.S. Department <strong>of</strong> Transportation, Bureau <strong>of</strong> Transportation Statistics, National Transportation Statistics (Washington, DC: 2003), table 1-44.4Eno Transportation Foundation, Transportation in America (Washington, DC: 2002).Key: p = preliminary.
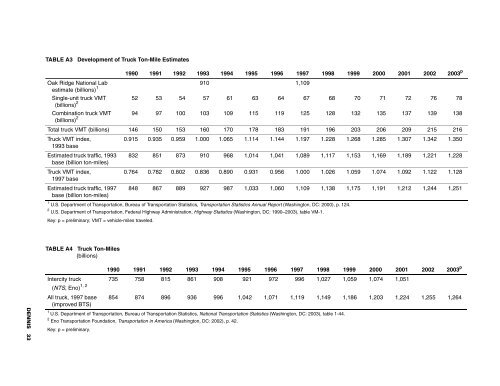
TABLE A3 Development <strong>of</strong> Truck Ton-Mile Estimates1990 1991 1992 1993 1994 1995 1996 1997 1998 1999 2000 2001 2002 2003 pOak Ridge National Lab910 1,109estimate (billions) 1Single-unit truck VMT 52 53 54 57 61 63 64 67 68 70 71 72 76 78(billions) 2Combination truck VMT 94 97 100 103 109 115 119 125 128 132 135 137 139 138(billions) 2Total truck VMT (billions) 146 150 153 160 170 178 183 191 196 203 206 209 215 216Truck VMT index,0.915 0.935 0.959 1.000 1.065 1.114 1.144 1.197 1.228 1.268 1.285 1.307 1.342 1.3501993 baseEstimated truck traffic, 1993 832 851 873 910 968 1,014 1,041 1,089 1,117 1,153 1,169 1,189 1,221 1,228base (billion ton-miles)Truck VMT index,0.764 0.782 0.802 0.836 0.890 0.931 0.956 1.000 1.026 1.059 1.074 1.092 1.122 1.1281997 baseEstimated truck traffic, 1997base (billion ton-miles)848 867 889 927 987 1,033 1,060 1,109 1,138 1,175 1,191 1,212 1,244 1,2511 U.S. Department <strong>of</strong> Transportation, Bureau <strong>of</strong> Transportation Statistics, Transportation Statistics Annual Report (Washington, DC: 2000), p. 124.2 U.S. Department <strong>of</strong> Transportation, Federal Highway Administration, Highway Statistics (Washington, DC: 1990–2003), table VM-1.Key: p = preliminary; VMT = vehicle-miles traveled.TABLE A4 Truck Ton-Miles(billions)DENNIS 331990 1991 1992 1993 1994 1995 1996 1997 1998 1999 2000 2001 2002 2003 pIntercity truck(NTS, Eno) 1, 2 735 758 815 861 908 921 972 996 1,027 1,059 1,074 1,051All truck, 1997 base(improved BTS)854 874 896 936 996 1,042 1,071 1,119 1,149 1,186 1,203 1,224 1,255 1,2641U.S. Department <strong>of</strong> Transportation, Bureau <strong>of</strong> Transportation Statistics, National Transportation Statistics (Washington, DC: 2003), table 1-44.2 Eno Transportation Foundation, Transportation in America (Washington, DC: 2002), p. 42.Key: p = preliminary.
- Page 1 and 2: Volume 8 Number 1, 2005ISSN 1094-88
- Page 3 and 4: A PEER-REVIEWED JOURNALJOURNAL OF T
- Page 5: JOURNAL OF TRANSPORTATION AND STATI
- Page 9 and 10: The Dynamics of Aircraft Degradatio
- Page 11 and 12: would show a corresponding increase
- Page 13 and 14: FIGURE 2 Aircraft Degradation and R
- Page 15 and 16: so that- r 2 1 ) . (15)This change
- Page 17 and 18: β⎛⎜⎜⎜= ⎜⎜⎜⎜⎝β 1
- Page 19: and the fleet management practices
- Page 22 and 23: of passengers and cargo to the econ
- Page 24 and 25: TABLE 3 Cycle Parameters and Final
- Page 26 and 27: TABLE 4 Forecasts of Numbers of Pas
- Page 28 and 29: FIGURE 4 Slope Components for the Z
- Page 30 and 31: 2. LS: this kind of intervention ha
- Page 32 and 33: CONCEPTTon-miles is the primary phy
- Page 34 and 35: FIGURE 2 Air Freight, Express, and
- Page 36 and 37: FIGURE 5 Railroad Ton-MilesTon-mile
- Page 38 and 39: Transport Canada. 1990-2002. Transp
- Page 42 and 43: 34 JOURNAL OF TRANSPORTATION AND ST
- Page 44 and 45: 36 JOURNAL OF TRANSPORTATION AND ST
- Page 46 and 47: account for premature investments i
- Page 48 and 49: zonal definitions. In Supernak et a
- Page 50 and 51: TABLE 2 Differences Among the 1972,
- Page 52 and 53: FIGURE 1 Research Sequence of Stage
- Page 54 and 55: TABLE 3 Regression Models by Metrop
- Page 56 and 57: TABLE 5 Tobit Models by Metropolita
- Page 58 and 59: Table 9 presents the predicted aver
- Page 60 and 61: TABLE 9 Aggregate Estimation Result
- Page 62 and 63: TABLE 11 Tobit Estimation of Nontra
- Page 64 and 65: Fleet, C. and S. Robertson. 1968. T
- Page 66 and 67: INTRODUCTIONThe Intermodal Surface
- Page 68 and 69: SUPPLEMENTAL STATE-LEVEL DATAIn add
- Page 70 and 71: METHODOLOGYAn exploratory factor an
- Page 72 and 73: Thus, a relatively large p value an
- Page 74 and 75: FIGURE 1 Final Model Specifications
- Page 76 and 77: CONCLUSIONSISTEA and the TEA-21 leg
- Page 78 and 79: Survey Question 2: Do your agency
- Page 80 and 81: Survey Question 11 (continued): Has
- Page 82 and 83: Survey Question 16: Every state has
- Page 84 and 85: Incidents have become one of the ma
- Page 86 and 87: FIGURE 1 Map of the M4 MotorwayA40A
- Page 88 and 89: TABLE 2 Variables in the Fuzzy Logi
- Page 90 and 91:
FIGURE 9 Result of the ANN ModelMod
- Page 92 and 93:
Garib, A., A.E. Radwan, and H. Al-D
- Page 94 and 95:
usually the case for studies that u
- Page 96 and 97:
proportional to overlap length. Rou
- Page 98 and 99:
Fx ( )Working Correlation Matrix in
- Page 100 and 101:
that had a lower level of congestio
- Page 102 and 103:
dependent variable takes on a value
- Page 104 and 105:
TABLE 3 Modeling Results for the MG
- Page 106 and 107:
REFERENCESAbdalla, M. 2003. Modelin
- Page 108 and 109:
the relevant covariates including t
- Page 111 and 112:
BOOK REVIEWSEconomic Impacts of Int
- Page 113:
I found the second section dealing
- Page 116 and 117:
TABLE 1 Airline Employees by Busine
- Page 119 and 120:
JOURNAL OF TRANSPORTATION AND STATI
- Page 122:
U.S. Department of TransportationRe