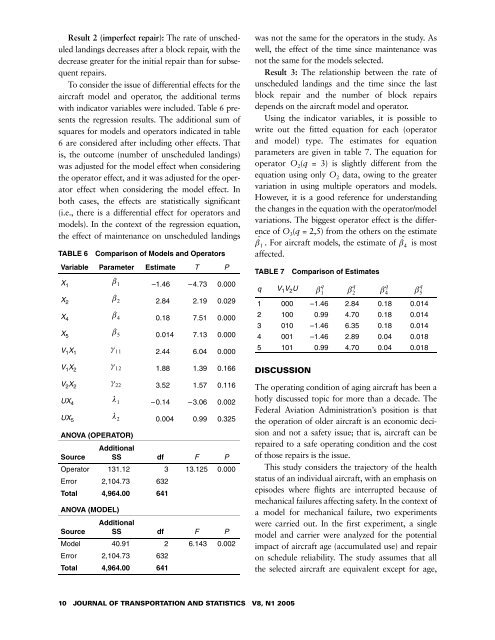
Result 2 (imperfect repair): The rate <strong>of</strong> unscheduledl<strong>and</strong>ings decreases after a block repair, with thedecrease greater for the initial repair than for subsequentrepairs.To consider the issue <strong>of</strong> differential effects for theaircraft model <strong>and</strong> operator, the additional termswith indicator variables were included. Table 6 presentsthe regression results. The additional sum <strong>of</strong>squares for models <strong>and</strong> operators indicated in table6 are considered after including other effects. Thatis, the outcome (number <strong>of</strong> unscheduled l<strong>and</strong>ings)was adjusted for the model effect when consideringthe operator effect, <strong>and</strong> it was adjusted for the operatoreffect when considering the model effect. Inboth cases, the effects are statistically significant(i.e., there is a differential effect for operators <strong>and</strong>models). In the context <strong>of</strong> the regression equation,the effect <strong>of</strong> maintenance on unscheduled l<strong>and</strong>ingsTABLE 6 Comparison <strong>of</strong> Models <strong>and</strong> OperatorsVariable Parameter Estimate T Pβ 1X 1 –1.46 –4.73 0.000β 2X 2 2.84 2.19 0.029β 4X 4 0.18 7.51 0.000β 5X 5 0.014 7.13 0.000γ 11V 1 X 1 2.44 6.04 0.000γ 12V 1 X 2 1.88 1.39 0.166γ 22V 2 X 2 3.52 1.57 0.116λ 1UX 4 –0.14 –3.06 0.002λ 2UX 5 0.004 0.99 0.325ANOVA (OPERATOR)AdditionalSource SS df F POperator 131.12 3 13.125 0.000Error 2,104.73 632Total 4,964.00 641ANOVA (MODEL)AdditionalSource SS df F PModel 40.91 2 6.143 0.002Error 2,104.73 632Total 4,964.00 641was not the same for the operators in the study. Aswell, the effect <strong>of</strong> the time since maintenance wasnot the same for the models selected.Result 3: The relationship between the rate <strong>of</strong>unscheduled l<strong>and</strong>ings <strong>and</strong> the time since the lastblock repair <strong>and</strong> the number <strong>of</strong> block repairsdepends on the aircraft model <strong>and</strong> operator.Using the indicator variables, it is possible towrite out the fitted equation for each (operator<strong>and</strong> model) type. The estimates for equationparameters are given in table 7. The equation foroperator O 2 (q = 3) is slightly different from theequation using only O 2 data, owing to the greatervariation in using multiple operators <strong>and</strong> models.However, it is a good reference for underst<strong>and</strong>ingthe changes in the equation with the operator/modelvariations. The biggest operator effect is the difference<strong>of</strong> O 3 (q = 2,5) from the others on the estimateˆˆβ 1 . For aircraft models, the estimate <strong>of</strong> β 4 is mostaffected.TABLE 7 Comparison <strong>of</strong> EstimatesqV 1 V 2 U1 000 –1.46 2.84 0.18 0.0142 100 0.99 4.70 0.18 0.0143 010 –1.46 6.35 0.18 0.0144 001 –1.46 2.89 0.04 0.0185 101 0.99 4.70 0.04 0.018DISCUSSIONβ 1qThe operating condition <strong>of</strong> aging aircraft has been ahotly discussed topic for more than a decade. TheFederal Aviation Administration’s position is thatthe operation <strong>of</strong> older aircraft is an economic decision<strong>and</strong> not a safety issue; that is, aircraft can berepaired to a safe operating condition <strong>and</strong> the cost<strong>of</strong> those repairs is the issue.This study considers the trajectory <strong>of</strong> the healthstatus <strong>of</strong> an individual aircraft, with an emphasis onepisodes where flights are interrupted because <strong>of</strong>mechanical failures affecting safety. In the context <strong>of</strong>a model for mechanical failure, two experimentswere carried out. In the first experiment, a singlemodel <strong>and</strong> carrier were analyzed for the potentialimpact <strong>of</strong> aircraft age (accumulated use) <strong>and</strong> repairon schedule reliability. The study assumes that allthe selected aircraft are equivalent except for age,β 2qβ 4qβ 5q10 JOURNAL OF TRANSPORTATION AND STATISTICS V8, N1 2005
<strong>and</strong> the fleet management practices <strong>of</strong> the carrierremain consistent over time. In this setting, the variabilityin the failure rate (unscheduled l<strong>and</strong>ings) canbe partly attributed to the aging <strong>of</strong> the aircraft <strong>and</strong>incomplete repair during preventive maintenance.The second experiment involved multiple operators<strong>and</strong> aircraft models. With the same failure model,the differential effect <strong>of</strong> operational practices <strong>and</strong>aircraft design can be studied.The following can be concluded from the results<strong>of</strong> this study.1. The percentage <strong>of</strong> variation in unscheduledl<strong>and</strong>ings that can be explained by degradationwith age <strong>and</strong> incomplete repair is high.2. Age (accumulated hours <strong>of</strong> use) has a statisticallysignificant effect on failures (unscheduledl<strong>and</strong>ings), with an increasing failure rate as ageincreases.3. The improvement in the operating conditionwith planned preventive maintenance is not togood-as-new.4. The relationship between failures <strong>and</strong> degradationdiffers from model to model.5. The relationship between failures <strong>and</strong> repairdiffers from operator to operator.The clear relationship between unscheduledl<strong>and</strong>ings <strong>and</strong> degradation/repair in the regressionmodel has implications for the maintenance policies<strong>of</strong> operators. The operator has control overthe repair intervals— ( τδ , ) <strong>and</strong> the repair effortβ —the fraction <strong>of</strong> good-as-new. The dependence <strong>of</strong>the regression coefficients on the maintenanceparameters ( τδβ , , ) is implied in this paper, but thatconnection can be made more explicit by using theactual derivatives in the series approximations. Inthat way, changes in the values <strong>of</strong> the maintenanceparameters would translate into changes in the rate<strong>of</strong> unscheduled l<strong>and</strong>ings. Therefore, an operatorcould explore the outcome (in terms <strong>of</strong> unscheduledl<strong>and</strong>ings) <strong>of</strong> changes in the repair parameters, forexample, the block repair interval.The purpose <strong>of</strong> our research was to establishthe feasibility <strong>of</strong> predicting unscheduled l<strong>and</strong>ingsfrom data on use <strong>and</strong> maintenance. An earlierstudy (Nowlan <strong>and</strong> Heap 1978) found that 89% <strong>of</strong>aviation mechanical malfunctions were unpredictedusing operating limits or undertaking repeatedchecks <strong>of</strong> equipment. The results <strong>of</strong> this work indicatethat important problems in the operation <strong>of</strong>aircraft can be studied with existing field data. Use<strong>of</strong> these results in the management <strong>of</strong> an airlinewould require additional study, but a step in thatdirection has been taken here.REFERENCESAlfred, L., R. Ellis, <strong>and</strong> W. Shepard. 1997. The Dynamics <strong>of</strong> AircraftAging, mimeo. Decision Dynamics Inc.AlgoPlus. 2004. Available at http://www.cislpiloti.org/Technical/GAIN/WGB.Aven, T. <strong>and</strong> U. Jensen. 1998. Stochastic Models in Reliability.New York, NY: Springer Verlag.AvS<strong>of</strong>t. 2004. Available at http://www.avs<strong>of</strong>t.co.uk/.Block, H., W. Borges, <strong>and</strong> T. Savits. 1985. Age-Dependent MinimalRepair. Journal <strong>of</strong> Applied Probability 22:370–385.Brown, M. <strong>and</strong> F. Proschan. 1983. Imperfect Repair. Journal <strong>of</strong>Applied Probability 20:851–859.Friend, C. 1992. Aircraft Maintenance Management. Essex,Engl<strong>and</strong>: Longman Scientific <strong>and</strong> Technical.Kanafani, A., T. Keeler, <strong>and</strong> S. Sathisan. 1993. Airline SafetyPosture: Evidence from Service Difficulty Reports. Journal <strong>of</strong>Transportation Engineering 119(4):655–664.Lincoln, J.W. 2000. Risk Assessments <strong>of</strong> Aging Aircraft. AgingAircraft Fleets: Structural <strong>and</strong> Other Subsystem Aspects,RTO Lecture Series 218, RTO-EN-015.McCullagh, P. <strong>and</strong> J. Nelder. 1989. Generalized Linear Models,2nd ed. New York, NY: Chapman <strong>and</strong> Hall.Nowlan, F.S. <strong>and</strong> H.F. Heap. 1978. Reliability Centered Maintenance,Report No. AD-A066-579. Available from theNational Technical Information Service, Springfield, VA.Phelan, M. 2003. Health Check. Flight International163(4865):26–27.Sampath, S.G. 2000. Safety <strong>and</strong> Service Difficulty Reporting,Aging Aircraft Fleets: Structural <strong>and</strong> Other SubsystemAspects, RTO Lecture Series 218, RTO-EN-015.MACLEAN, RICHMAN, LARSSON & RICHMAN 11
- Page 1 and 2: Volume 8 Number 1, 2005ISSN 1094-88
- Page 3 and 4: A PEER-REVIEWED JOURNALJOURNAL OF T
- Page 5: JOURNAL OF TRANSPORTATION AND STATI
- Page 9 and 10: The Dynamics of Aircraft Degradatio
- Page 11 and 12: would show a corresponding increase
- Page 13 and 14: FIGURE 2 Aircraft Degradation and R
- Page 15 and 16: so that- r 2 1 ) . (15)This change
- Page 17: β⎛⎜⎜⎜= ⎜⎜⎜⎜⎝β 1
- Page 22 and 23: of passengers and cargo to the econ
- Page 24 and 25: TABLE 3 Cycle Parameters and Final
- Page 26 and 27: TABLE 4 Forecasts of Numbers of Pas
- Page 28 and 29: FIGURE 4 Slope Components for the Z
- Page 30 and 31: 2. LS: this kind of intervention ha
- Page 32 and 33: CONCEPTTon-miles is the primary phy
- Page 34 and 35: FIGURE 2 Air Freight, Express, and
- Page 36 and 37: FIGURE 5 Railroad Ton-MilesTon-mile
- Page 38 and 39: Transport Canada. 1990-2002. Transp
- Page 40 and 41: 32 JOURNAL OF TRANSPORTATION AND ST
- Page 42 and 43: 34 JOURNAL OF TRANSPORTATION AND ST
- Page 44 and 45: 36 JOURNAL OF TRANSPORTATION AND ST
- Page 46 and 47: account for premature investments i
- Page 48 and 49: zonal definitions. In Supernak et a
- Page 50 and 51: TABLE 2 Differences Among the 1972,
- Page 52 and 53: FIGURE 1 Research Sequence of Stage
- Page 54 and 55: TABLE 3 Regression Models by Metrop
- Page 56 and 57: TABLE 5 Tobit Models by Metropolita
- Page 58 and 59: Table 9 presents the predicted aver
- Page 60 and 61: TABLE 9 Aggregate Estimation Result
- Page 62 and 63: TABLE 11 Tobit Estimation of Nontra
- Page 64 and 65: Fleet, C. and S. Robertson. 1968. T
- Page 66 and 67: INTRODUCTIONThe Intermodal Surface
- Page 68 and 69:
SUPPLEMENTAL STATE-LEVEL DATAIn add
- Page 70 and 71:
METHODOLOGYAn exploratory factor an
- Page 72 and 73:
Thus, a relatively large p value an
- Page 74 and 75:
FIGURE 1 Final Model Specifications
- Page 76 and 77:
CONCLUSIONSISTEA and the TEA-21 leg
- Page 78 and 79:
Survey Question 2: Do your agency
- Page 80 and 81:
Survey Question 11 (continued): Has
- Page 82 and 83:
Survey Question 16: Every state has
- Page 84 and 85:
Incidents have become one of the ma
- Page 86 and 87:
FIGURE 1 Map of the M4 MotorwayA40A
- Page 88 and 89:
TABLE 2 Variables in the Fuzzy Logi
- Page 90 and 91:
FIGURE 9 Result of the ANN ModelMod
- Page 92 and 93:
Garib, A., A.E. Radwan, and H. Al-D
- Page 94 and 95:
usually the case for studies that u
- Page 96 and 97:
proportional to overlap length. Rou
- Page 98 and 99:
Fx ( )Working Correlation Matrix in
- Page 100 and 101:
that had a lower level of congestio
- Page 102 and 103:
dependent variable takes on a value
- Page 104 and 105:
TABLE 3 Modeling Results for the MG
- Page 106 and 107:
REFERENCESAbdalla, M. 2003. Modelin
- Page 108 and 109:
the relevant covariates including t
- Page 111 and 112:
BOOK REVIEWSEconomic Impacts of Int
- Page 113:
I found the second section dealing
- Page 116 and 117:
TABLE 1 Airline Employees by Busine
- Page 119 and 120:
JOURNAL OF TRANSPORTATION AND STATI
- Page 122:
U.S. Department of TransportationRe