

journal of transportation and statistics - Research and Innovative ...
journal of transportation and statistics - Research and Innovative ...
journal of transportation and statistics - Research and Innovative ...

You also want an ePaper? Increase the reach of your titles
YUMPU automatically turns print PDFs into web optimized ePapers that Google loves.
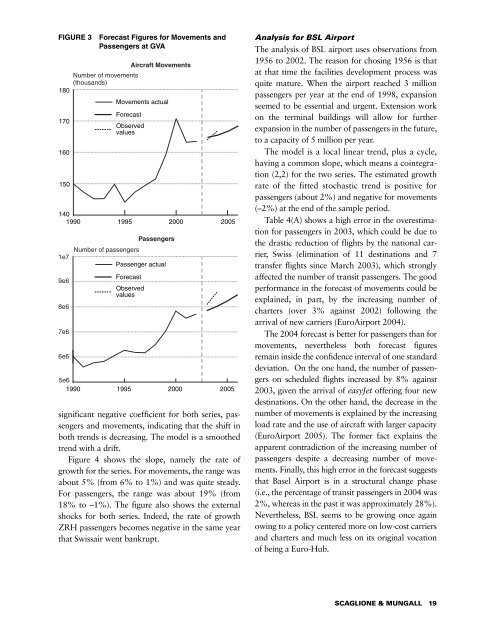
FIGURE 3 Forecast Figures for Movements <strong>and</strong>Passengers at GVA1801701601501e79e68e67e66e6Number <strong>of</strong> movements(thous<strong>and</strong>s)Number <strong>of</strong> passengersMovements actualForecast1401990 1995 2000 2005Passenger actualForecastAircraft MovementsObservedvaluesObservedvaluesPassengers5e61990 1995 2000 2005significant negative coefficient for both series, passengers<strong>and</strong> movements, indicating that the shift inboth trends is decreasing. The model is a smoothedtrend with a drift.Figure 4 shows the slope, namely the rate <strong>of</strong>growth for the series. For movements, the range wasabout 5% (from 6% to 1%) <strong>and</strong> was quite steady.For passengers, the range was about 19% (from18% to –1%). The figure also shows the externalshocks for both series. Indeed, the rate <strong>of</strong> growthZRH passengers becomes negative in the same yearthat Swissair went bankrupt.Analysis for BSL AirportThe analysis <strong>of</strong> BSL airport uses observations from1956 to 2002. The reason for chosing 1956 is thatat that time the facilities development process wasquite mature. When the airport reached 3 millionpassengers per year at the end <strong>of</strong> 1998, expansionseemed to be essential <strong>and</strong> urgent. Extension workon the terminal buildings will allow for furtherexpansion in the number <strong>of</strong> passengers in the future,to a capacity <strong>of</strong> 5 million per year.The model is a local linear trend, plus a cycle,having a common slope, which means a cointegration(2,2) for the two series. The estimated growthrate <strong>of</strong> the fitted stochastic trend is positive forpassengers (about 2%) <strong>and</strong> negative for movements(–2%) at the end <strong>of</strong> the sample period.Table 4(A) shows a high error in the overestimationfor passengers in 2003, which could be due tothe drastic reduction <strong>of</strong> flights by the national carrier,Swiss (elimination <strong>of</strong> 11 destinations <strong>and</strong> 7transfer flights since March 2003), which stronglyaffected the number <strong>of</strong> transit passengers. The goodperformance in the forecast <strong>of</strong> movements could beexplained, in part, by the increasing number <strong>of</strong>charters (over 3% against 2002) following thearrival <strong>of</strong> new carriers (EuroAirport 2004).The 2004 forecast is better for passengers than formovements, nevertheless both forecast figuresremain inside the confidence interval <strong>of</strong> one st<strong>and</strong>arddeviation. On the one h<strong>and</strong>, the number <strong>of</strong> passengerson scheduled flights increased by 8% against2003, given the arrival <strong>of</strong> easyJet <strong>of</strong>fering four newdestinations. On the other h<strong>and</strong>, the decrease in thenumber <strong>of</strong> movements is explained by the increasingload rate <strong>and</strong> the use <strong>of</strong> aircraft with larger capacity(EuroAirport 2005). The former fact explains theapparent contradiction <strong>of</strong> the increasing number <strong>of</strong>passengers despite a decreasing number <strong>of</strong> movements.Finally, this high error in the forecast suggeststhat Basel Airport is in a structural change phase(i.e., the percentage <strong>of</strong> transit passengers in 2004 was2%, whereas in the past it was approximately 28%).Nevertheless, BSL seems to be growing once againowing to a policy centered more on low-cost carriers<strong>and</strong> charters <strong>and</strong> much less on its original vocation<strong>of</strong> being a Euro-Hub.SCAGLIONE & MUNGALL 19


