journal of transportation and statistics - Research and Innovative ...
journal of transportation and statistics - Research and Innovative ...
journal of transportation and statistics - Research and Innovative ...
Create successful ePaper yourself
Turn your PDF publications into a flip-book with our unique Google optimized e-Paper software.
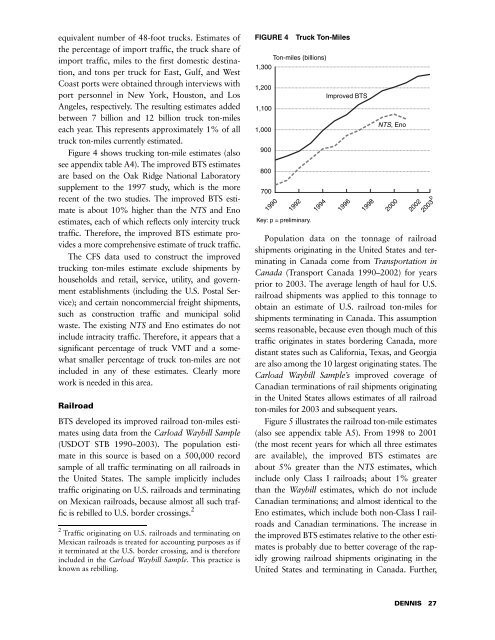
equivalent number <strong>of</strong> 48-foot trucks. Estimates <strong>of</strong>the percentage <strong>of</strong> import traffic, the truck share <strong>of</strong>import traffic, miles to the first domestic destination,<strong>and</strong> tons per truck for East, Gulf, <strong>and</strong> WestCoast ports were obtained through interviews withport personnel in New York, Houston, <strong>and</strong> LosAngeles, respectively. The resulting estimates addedbetween 7 billion <strong>and</strong> 12 billion truck ton-mileseach year. This represents approximately 1% <strong>of</strong> alltruck ton-miles currently estimated.Figure 4 shows trucking ton-mile estimates (alsosee appendix table A4). The improved BTS estimatesare based on the Oak Ridge National Laboratorysupplement to the 1997 study, which is the morerecent <strong>of</strong> the two studies. The improved BTS estimateis about 10% higher than the NTS <strong>and</strong> Enoestimates, each <strong>of</strong> which reflects only intercity trucktraffic. Therefore, the improved BTS estimate providesa more comprehensive estimate <strong>of</strong> truck traffic.The CFS data used to construct the improvedtrucking ton-miles estimate exclude shipments byhouseholds <strong>and</strong> retail, service, utility, <strong>and</strong> governmentestablishments (including the U.S. Postal Service);<strong>and</strong> certain noncommercial freight shipments,such as construction traffic <strong>and</strong> municipal solidwaste. The existing NTS <strong>and</strong> Eno estimates do notinclude intracity traffic. Therefore, it appears that asignificant percentage <strong>of</strong> truck VMT <strong>and</strong> a somewhatsmaller percentage <strong>of</strong> truck ton-miles are notincluded in any <strong>of</strong> these estimates. Clearly morework is needed in this area.RailroadBTS developed its improved railroad ton-miles estimatesusing data from the Carload Waybill Sample(USDOT STB 1990–2003). The population estimatein this source is based on a 500,000 recordsample <strong>of</strong> all traffic terminating on all railroads inthe United States. The sample implicitly includestraffic originating on U.S. railroads <strong>and</strong> terminatingon Mexican railroads, because almost all such trafficis rebilled to U.S. border crossings. 22 Traffic originating on U.S. railroads <strong>and</strong> terminating onMexican railroads is treated for accounting purposes as ifit terminated at the U.S. border crossing, <strong>and</strong> is thereforeincluded in the Carload Waybill Sample. This practice isknown as rebilling.FIGURE 4 Truck Ton-MilesTon-miles (billions)1,3001,2001,1001,00090080070019901992Key: p = preliminary.1994Improved BTS19961998NTS, Eno200020022003 pPopulation data on the tonnage <strong>of</strong> railroadshipments originating in the United States <strong>and</strong> terminatingin Canada come from Transportation inCanada (Transport Canada 1990–2002) for yearsprior to 2003. The average length <strong>of</strong> haul for U.S.railroad shipments was applied to this tonnage toobtain an estimate <strong>of</strong> U.S. railroad ton-miles forshipments terminating in Canada. This assumptionseems reasonable, because even though much <strong>of</strong> thistraffic originates in states bordering Canada, moredistant states such as California, Texas, <strong>and</strong> Georgiaare also among the 10 largest originating states. TheCarload Waybill Sample’s improved coverage <strong>of</strong>Canadian terminations <strong>of</strong> rail shipments originatingin the United States allows estimates <strong>of</strong> all railroadton-miles for 2003 <strong>and</strong> subsequent years.Figure 5 illustrates the railroad ton-mile estimates(also see appendix table A5). From 1998 to 2001(the most recent years for which all three estimatesare available), the improved BTS estimates areabout 5% greater than the NTS estimates, whichinclude only Class I railroads; about 1% greaterthan the Waybill estimates, which do not includeCanadian terminations; <strong>and</strong> almost identical to theEno estimates, which include both non-Class I railroads<strong>and</strong> Canadian terminations. The increase inthe improved BTS estimates relative to the other estimatesis probably due to better coverage <strong>of</strong> the rapidlygrowing railroad shipments originating in theUnited States <strong>and</strong> terminating in Canada. Further,DENNIS 27


