Booklet 7 - Flow Measurement Methods in Open Channels
Booklet 7 - Flow Measurement Methods in Open Channels
Booklet 7 - Flow Measurement Methods in Open Channels

Create successful ePaper yourself
Turn your PDF publications into a flip-book with our unique Google optimized e-Paper software.
Centre d’expertise en analyse environnementale du QuébecSampl<strong>in</strong>g Guide forEnvironmental AnalysisBOOKLET 7FLOW MEASUREMENT METHODSIN OPEN CHANNELSEnglish Version ofThe Orig<strong>in</strong>al Publish<strong>in</strong>gEDITION : May 2007
Note to the reader: Information regard<strong>in</strong>g registered trademarks or commercial products is provided only as a guide andcan be substituted for equivalent products.For additional <strong>in</strong>formationCentre d’expertise en analyse environnementale du Québecto access our documents on our Web siteat the follow<strong>in</strong>g address: www.ceaeq.gouv.qc.caor to contact us at:Centre d’expertise en analyse environnementale du Québec2700, rue E<strong>in</strong>ste<strong>in</strong>, bureau E.2.220Québec (Québec) G1P 3W8Telephone: 418 643-1301Fax: 418 528-1091Email: ceaeq@mddep.gouv.qc.caBibliographic Reference:MINISTÈRE DU DÉVELOPPEMENT DURABLE, DE L’ENVIRONNEMENT ET DES PARCS DU QUÉBEC, May2007, Sampl<strong>in</strong>g Guide for Environmental Analysis: <strong>Booklet</strong> 7 – <strong>Flow</strong> <strong>Measurement</strong> <strong>Methods</strong> <strong>in</strong> <strong>Open</strong> <strong>Channels</strong>, Centred’expertise en analyse environnementale du Québec, 223 p.,http://www.ceaeq.gouv.qc.ca/documents/publications/guides_ech.htmLegal Deposit – Bibliothèque et Archives nationales du Québec, 2009ISBN 978-2-550-55291-8 Guide d’échantillonnage à des f<strong>in</strong>s d’analyse environnementaleISBN 978-2-550-55292-5 Guide d’échantillonnage à des f<strong>in</strong>s d’analyse environnementale (English Version)ISBN 978-2-550-54958-1 (PDF) (previously published <strong>in</strong> English by Thompson - Groupe Modulo)ISBN 978-2-550-55509-4 (PDF) (French Edition: August 2008)ISBN 978-2-550-55309-0 (previously published <strong>in</strong> French by Les éditions le Griffon d’argile, ISBN 2-89443-075-2,1 st Edition 1998)© Gouvernement du Québec, 2007
FOREWORDThis Sampl<strong>in</strong>g Guide for Environmental Analyses details a series of good practices to plan and conductsampl<strong>in</strong>g activities. The purpose of the guide is to ensure the quality of samples collected and thevalidity of scientific <strong>in</strong>formation aris<strong>in</strong>g from these samples.This essentially descriptive reference guide was developed to serve as an <strong>in</strong>formation tool for<strong>in</strong>dividuals who carry out activities that are part of an environment characterization program. Theprogram was <strong>in</strong>itiated by the Centre d’expertise en analyse environnementale du Québec and them<strong>in</strong>istère du Développement durable, de l'Environnement et des Parcs, after <strong>in</strong>formation came to lightreveal<strong>in</strong>g that samplers did not have the tools necessary to ga<strong>in</strong> an immediate knowledge of sampl<strong>in</strong>gpractices <strong>in</strong> Québec.From the outset, samplers have expressed a keen <strong>in</strong>terest <strong>in</strong> hav<strong>in</strong>g this type of reference documentavailable. Information <strong>in</strong> the guide is not all unpublished material, but we thought it of <strong>in</strong>terest anduseful to <strong>in</strong>clude a summary of <strong>in</strong>formation conta<strong>in</strong>ed <strong>in</strong> technical references or <strong>in</strong>formation based onpractical sampl<strong>in</strong>g experience <strong>in</strong> Québec.The Sampl<strong>in</strong>g Guide for Environmental Analyses consists of a series of booklets that deal specificallywith sampl<strong>in</strong>g <strong>in</strong> different environments. <strong>Booklet</strong> 1, Généralités (<strong>in</strong> French only), must accompanyeach booklet <strong>in</strong> the series. It provides a general framework for implement<strong>in</strong>g a sampl<strong>in</strong>g program anddiscusses technical procedures relat<strong>in</strong>g to quality, legality, health and safety issues. It also recommendsprocedures to optimize sampl<strong>in</strong>g programs.<strong>Booklet</strong> 7, entitled “<strong>Flow</strong> <strong>Measurement</strong> <strong>Methods</strong> <strong>in</strong> <strong>Open</strong> <strong>Channels</strong>”, describes techniques that areused to gauge the volume of effluent released dur<strong>in</strong>g processes that <strong>in</strong>volve use of large volumes ofwater.We s<strong>in</strong>cerely thank those <strong>in</strong>dividuals who have contributed to this document.May 2007<strong>Booklet</strong> 7 - <strong>Flow</strong> <strong>Measurement</strong> <strong>Methods</strong> <strong>in</strong> <strong>Open</strong> <strong>Channels</strong> Page 3 of 223
TABLE OF CONTENTSLIST OF TABLES......................................................................................................... .7LIST OF ILLUSTRATIONS ............................................................................................8INTRODUCTION ..........................................................................................................91. General....................................................................................................................................... 1Page1.1. Def<strong>in</strong>ition of flowrate................................................................................111.2. Purpose of flow measurement.................................................................... .131.3. Types of flow measurements ......................................................................131.4. Discharge system .....................................................................................141.5. <strong>Flow</strong> pr<strong>in</strong>ciples <strong>in</strong> open conduits .................................................................141.6. Pr<strong>in</strong>ciples of flow measurement <strong>in</strong> open channels.......................................... .151.7. Primary measurement device methods......................................................... .161.8. <strong>Flow</strong> meter<strong>in</strong>g system ...............................................................................201.9. Units of measurement ...............................................................................201.10. Reference measurement............................................................................ .211.11. Measur<strong>in</strong>g po<strong>in</strong>t...................................................................................... .211.12. Choos<strong>in</strong>g a measurement method ................................................................272. Description of flumes.........................................................................................352.1. Parshall flume......................................................................................... .352.2. Palmer-Bowlus Flume.............................................................................. .552.3. Leopold-Lagco flume............................................................................... .672.4. Cutthroat flume....................................................................................... .762.5. H flume ..................................................................................................923. Description of th<strong>in</strong>-plated weirs........................................................................ 1073.1. General ................................................................................................ 1073.2. Rectangular weir without contractions....................................................... . 1143.3. Rectangular weir with contractions........................................................... . 1203.4. Trapezoidal weir (Cipolletti) .................................................................... 1283.5. Triangular weir ...................................................................................... 1333.6. Comb<strong>in</strong>ed weir ...................................................................................... 1393.7. Compound weir ..................................................................................... 1434. Other methods of measurement........................................................................ 1484.1. Use of tracers ........................................................................................ 1484.2. Volumetric method................................................................................ . 1884.3. <strong>Flow</strong> measurement us<strong>in</strong>g pump<strong>in</strong>g stations .................................................191<strong>Booklet</strong> 7 - <strong>Flow</strong> <strong>Measurement</strong> <strong>Methods</strong> <strong>in</strong> <strong>Open</strong> <strong>Channels</strong> Page 5 of 223
4.4. Area/velocity method............................................................................. . 1985. Comparison of the precision and accuracy of volumetric, dilution and flow metermethods ......................................................................................................... 2045.1. Precision and accuracy ............................................................................ 2045.2. Volumetric method................................................................................ . 2055.3. Dilution method.................................................................................... . 2055.4. <strong>Flow</strong> meter method................................................................................ . 206REFERENC ES ........................................................................................................... 208BIBLIOGRAPHY...................................................................................................... . 213Page 6 of 223<strong>Booklet</strong> 7 - <strong>Flow</strong> <strong>Measurement</strong> <strong>Methods</strong> <strong>in</strong> <strong>Open</strong> <strong>Channels</strong>
LIST OF TABLESTable 1 - Dimensions for Palmer-Bowlus Flume Chamber............................................................... . 25Table 2 - Dimensions for Parshall Flume Chamber......................................................................... . 26Table 3 - Chart for compar<strong>in</strong>g the measurement capabilities of primary devices ................................... 31Table 4 - Dimensions for still<strong>in</strong>g wells .......................................................................................... 33Table 5 - Parshall flume – Standard dimensions............................................................................. . 39Table 6 - Parshall flume - Recommended m<strong>in</strong>imum and maximum flows <strong>in</strong> free flow conditions............ . 41Table 7 - Parshall Flume - Discharge equations <strong>in</strong> free flow conditions.............................................. . 42Table 8 - Coefficients and exponents - Parshall flume <strong>in</strong> submerged flow conditions ............................. 52Table 9 - Palmer-Bowlus flume - Standard dimensions accord<strong>in</strong>g to Ludwig ....................................... 58Table 10 - Palmer-Bowlus Flume - Standard dimensions accord<strong>in</strong>g to Plasti-Fab Inc............................ . 61Table 11 - Palmer-Bowlus flume - Recommended m<strong>in</strong>imum and maximum flowrates <strong>in</strong> free flow conditions.............................................................................................................................. 62Table 12 - Leopold-Lagco flume - Standard dimensions accord<strong>in</strong>g to F.B. Leopold Company Inc........... . 70Table 13 - Leopold-Lagco flume - Recommended m<strong>in</strong>imum and maximum flowrates <strong>in</strong> free flow conditions.............................................................................................................................. 72Table 14 - Cutthroat flume – Standard dimensions .......................................................................... 79Table 15 - Cutthroat flume - Recommended m<strong>in</strong>imum and maximum flowrates free flow conditions ....... 81Table 16 - Cutthroat flume - Values of coefficients C and K <strong>in</strong> free flow conditions .............................. 83Table 17 - Cutthroat flume - Discharge equations <strong>in</strong> free flow conditions (imperial system)................... . 84Table 18 - Cutthroat flume - Discharge equations <strong>in</strong> free flow conditions (metric system) ...................... 85Table 19 - Cutthroat flume - Values of coefficients C and K <strong>in</strong> submerged flow conditions.................... . 90Table 20 - HS flume – Standard dimensions.................................................................................. . 98Table 21 - H flume – Standard dimensions.................................................................................... . 99Table 22 - HL flume – Standard dimensions................................................................................ . 100Table 23 - H flume - Recommended m<strong>in</strong>imum and maximum flowrates <strong>in</strong> free flow conditions ............ 101Table 24 - H flume - Coefficient and exponent values................................................................... . 103Table 25 - Weir calibration - Volumetric method - Limited dimensions............................................ . 113Table 26 - Rectangular weir without contraction - Recommended m<strong>in</strong>imum and maximum flowrates <strong>in</strong> freeflow conditions...................................................................................................... . 117Table 27 - Rectangular weir with contractions - Recommended m<strong>in</strong>imum and maximum flowrates <strong>in</strong> freeflow conditions...................................................................................................... . 124Table 28 - Rectangular weir with contractions - Coefficients “a”, “C” and “k” ................................... 127Table 29 - Trapezoidal weir (Cipolletti) - Recommended m<strong>in</strong>imum and maximum flowrates <strong>in</strong> free flowconditions............................................................................................................. . 131Table 30 - Triangular weir - Recommended m<strong>in</strong>imum and maximum flowrates <strong>in</strong> free flow conditions .. 136Table 31 - Triangular Weir - Value of coefficient “C 1 ”................................................................... 138Table 32 - Compound weir - <strong>Measurement</strong> capacity ......................................................................147<strong>Booklet</strong> 7 - <strong>Flow</strong> <strong>Measurement</strong> <strong>Methods</strong> <strong>in</strong> <strong>Open</strong> <strong>Channels</strong> Page 7 of 223
LIST OF ILLUSTRATIONSFigure 1 - Weir Components ....................................................................................................... 19Figure 2 - Palmer-Bowlus - Flume Chamber .................................................................................. 23Figure 3 - Parshall Flume - Chamber ............................................................................................ 24Figure 4 - Flume - Flume and flow channel layout.......................................................................... . 29Figure 5 - Parshall flume - Illustration of flume .............................................................................. 36Figure 6 - Parshall flume - physical and flow characteristics............................................................. . 38Figure 7 - Parshall flume – Slope of the approach section ................................................................. 46Figure 8 - Parshall flume – Junction of approach and converg<strong>in</strong>g sections (setup that should be avoided). . 47Figure 9 - Parshall Flume - Effects of a submerged flow.................................................................. . 49Figure 10 - Parshall flume - h 2 /h 1 Ratio ......................................................................................... 50Figure 11 - Loss of head - Parshall flumes: 1 to 8 feet..................................................................... . 53Figure 12 - Loss of head - Parshall flumes: 10 to 50 feet.................................................................. . 54Figure 13 - Shape of a Palmer-Bowlus flume accord<strong>in</strong>g to Ludwig.................................................... . 59Figure 14 - Shape of a Palmer-Bowlus flume - Plasti-Fab Inc........................................................... . 60Figure 15 - Shape of Leopold-Lagco flume - F.B. Leopold Company Inc. ........................................... 71Figure 16 - Cutthroat flume - Physical characteristics ...................................................................... 78Figure 17 - Hs flume - Physical characteristics ............................................................................... 94Figure 18 - H flume - Physical characteristics................................................................................ . 95Figure 19 - HL flume - Physical characteristics.............................................................................. . 96Figure 20 - Rectangular weir without contractions - Physical characteristics ...................................... 115Figure 21 - Rectangular weir with contractions - Physical characteristics.......................................... . 121Figure 22 - Trapezoidal weir (Cipolletti) - Physical characteristics ................................................... 129Figure 23 - Triangular weir - Physical characteristics.................................................................... . 134Figure 24 - Comb<strong>in</strong>ed weir - Physical characteristics.................................................................... . 140Figure 25 -Compound weir - Physical characteristics.................................................................... . 145Figure 26 - Examples of how current velocities are distributed <strong>in</strong> a flow section .................................202Page 8 of 223<strong>Booklet</strong> 7 - <strong>Flow</strong> <strong>Measurement</strong> <strong>Methods</strong> <strong>in</strong> <strong>Open</strong> <strong>Channels</strong>
INTRODUCTIONMany <strong>in</strong>dustrial processes use large amounts of water as part of manufactur<strong>in</strong>g and process<strong>in</strong>goperations. The petrochemical, metallurgical and pulp and paper <strong>in</strong>dustries are examples of such typesof operations. Measur<strong>in</strong>g the amount of water that is used dur<strong>in</strong>g production is often a crucialcomponent of manag<strong>in</strong>g processes. In terms of the environment, measurements of the volumes ofeffluent that are released <strong>in</strong>to the aquatic system is <strong>in</strong>formation that is essential to enforc<strong>in</strong>gregulations. This type of assessment is particularly useful when effluent standards are expressed on thebasis of the amount of product produced or on a periodic basis.The amount of effluent is usually gauged by means of open channels that enable water flowmeasurements, more specifically volume per time unit. This booklet discusses the pr<strong>in</strong>cipal techniquesthat are used for this type of measurement. This is an essentially descriptive document and the contentscentre on four ma<strong>in</strong> topics:−−−−measur<strong>in</strong>g elements commonly used <strong>in</strong> Québec;procedures to operate and ma<strong>in</strong>ta<strong>in</strong> <strong>in</strong>struments;tables and equations to calculate flow;a few calibration and test<strong>in</strong>g procedures for measur<strong>in</strong>g <strong>in</strong>struments.This document can by used by experts and beg<strong>in</strong>ners <strong>in</strong> the field. It details pr<strong>in</strong>ciples for measurementmethods and calculation techniques, with an emphasis on problems that are commonly encountered.Given the costs associated with permanent <strong>in</strong>stallations of this type of equipment, the guidel<strong>in</strong>esconta<strong>in</strong>ed <strong>in</strong> this booklet should be followed to determ<strong>in</strong>e the type of device that is best suited to theneeds of a company. The <strong>in</strong>formation provided will also guide the reader <strong>in</strong> determ<strong>in</strong><strong>in</strong>g whichma<strong>in</strong>tenance techniques should be used to ma<strong>in</strong>ta<strong>in</strong> reliable measurements and optimal use of ameasur<strong>in</strong>g device.In some <strong>in</strong>stances, however, implement<strong>in</strong>g these methods may require adjustments. Although thedocument provides notes of caution regard<strong>in</strong>g a number of problems that may arise, it is impossible toaddress each and every one. Therefore, the design, <strong>in</strong>stallation and use of structures rema<strong>in</strong>s the entireresponsibility of the operator. Furthermore, reference to trademarks or product models is not anendorsement of a particular trademark or product.<strong>Booklet</strong> 7 - <strong>Flow</strong> <strong>Measurement</strong> <strong>Methods</strong> <strong>in</strong> <strong>Open</strong> <strong>Channels</strong> Page 9 of 223
1. GENERAL1.1. Def<strong>in</strong>ition of flowrateIn hydraulics, flowrate (Q) is def<strong>in</strong>ed as a volume (V) of liquid that flows through a given section of aflume or channel per time unit (t).Q = ΔV/Δt (1)The above equation-solv<strong>in</strong>g process therefore consists of determ<strong>in</strong><strong>in</strong>g the volume (ΔV) on the basis oftime.For example, <strong>in</strong> the case of a cyl<strong>in</strong>drical pipe, determ<strong>in</strong>ation of the volume of a section is obta<strong>in</strong>ed bymultiply<strong>in</strong>g the area (A) by the length (L).A = πR 2 (2)V = A x L (3)The volume of the cyl<strong>in</strong>der is the product of the area (A) times length (L).<strong>Booklet</strong> 7 - <strong>Flow</strong> <strong>Measurement</strong> <strong>Methods</strong> <strong>in</strong> <strong>Open</strong> <strong>Channels</strong> Page 11 of 223
To express a flowrate, one of the variables has to be time dependent. Assum<strong>in</strong>g that the area (A) isconstant, the other variable (L) is expressed <strong>in</strong> terms of distance of movement as a function of time.The expression of the length of movement (ΔL) as a function of time (Δt) gives the speed (U).U = ΔL/Δt (4)where:U is the velocity of flow through the area (A).By replac<strong>in</strong>g the variable (L) <strong>in</strong> equation (3), with the value determ<strong>in</strong>ed <strong>in</strong> equation (4), the equationbecomes:V = AUΔt (5)Also, by replac<strong>in</strong>g (V), <strong>in</strong> equation (1), with the value determ<strong>in</strong>ed <strong>in</strong> equation (5), the dischargeequation can be expressed as follows:Q = AU (6)<strong>Flow</strong>rate is usually expressed <strong>in</strong> terms of a volume unit as a function of a time unit. The unit ofmeasurement is m 3 /s or pi 3 /s.To express mass, the discharge (Q m ), equation (6) must be changed to <strong>in</strong>clude the density factor of theliquid be<strong>in</strong>g measured. The equation therefore becomes:Q m = ρ AU (7)whereρ is the density of the liquid kg/m 3 ;A is the area <strong>in</strong> m 2 ;U is the velocity of the liquid through the area <strong>in</strong> m/s.Page 12 of 223<strong>Booklet</strong> 7 - <strong>Flow</strong> <strong>Measurement</strong> <strong>Methods</strong> <strong>in</strong> <strong>Open</strong> <strong>Channels</strong>
Note: If effluents have different densities, this expression may result <strong>in</strong> a seriously <strong>in</strong>accuratemeasurement. Express<strong>in</strong>g the flow value <strong>in</strong> volumetric units per time unit is therefore recommended.1.2. Purpose of flow measurementPrecise and uniform methods of flow measurement are necessary to:−−−−−−determ<strong>in</strong>e the pollution load of urban, <strong>in</strong>dustrial and agricultural sources;determ<strong>in</strong>e the size of equipment for the transport and treatment of effluent and feed water;understand variations of flow and load <strong>in</strong> terms of time;measure, locate, analyze and solve problems relat<strong>in</strong>g to water collection and distribution networks;assess the performance of treatment equipment;determ<strong>in</strong>e the quality of water bodies and calculate available water resources.These measurements are also necessary to enforce environmental laws and regulations.1.3. Types of flow measurements1.3.1. Po<strong>in</strong>t-specific flow measurementPo<strong>in</strong>t-specific measurements are performed at a specific moment <strong>in</strong> time and generally cover a verybrief period (a few m<strong>in</strong>utes). They are therefore only representative of the moment at which they weretaken.Po<strong>in</strong>t-specific measurements are used primarily to:−−−−verify the calibration of certa<strong>in</strong> hydraulic structures (ex. pumps, flumes);determ<strong>in</strong>e the flowrate of a stable discharge (ex. prolonged effluent aeration pond);immediately determ<strong>in</strong>e a flowrate;determ<strong>in</strong>e the measurements of hydraulic transport and treatment equipment.The methods generally used to perform this type of measurement are as follows:− volumetric method (see section 4.2);− dilution method (see section 4.1.3);− area/velocity method (see section 4.4);− a po<strong>in</strong>t-specific read<strong>in</strong>g of water depth us<strong>in</strong>g a portable comb<strong>in</strong>ed <strong>in</strong>sertion weir (see section 3.7).When you are forward<strong>in</strong>g results, it is important to provide <strong>in</strong>formation about the location, date, timeand method of measurement, to avoid confusion when results are <strong>in</strong>terpreted.<strong>Booklet</strong> 7 - <strong>Flow</strong> <strong>Measurement</strong> <strong>Methods</strong> <strong>in</strong> <strong>Open</strong> <strong>Channels</strong> Page 13 of 223
1.3.2. Cont<strong>in</strong>uous flow measurementCont<strong>in</strong>uous flow measurements consist of a series of po<strong>in</strong>t-specific measurements at very close time<strong>in</strong>tervals (a few seconds apart), us<strong>in</strong>g <strong>in</strong>struments capable of record<strong>in</strong>g values dur<strong>in</strong>g the procedure.The advantage of this type of measurement is the fact that it can extend over an extended time period (afew hours to a few days) and reveals variations <strong>in</strong> flowrate that occurs dur<strong>in</strong>g this period. Informationthat is obta<strong>in</strong>ed is therefore more complete.This type of measurement usually requires a temporary or permanent primary measur<strong>in</strong>g device.1.4. Discharge system1.4.1. Closed conduitsA discharge is said to be <strong>in</strong> a closed conduit when the liquid is conf<strong>in</strong>ed <strong>in</strong> a pipe and subjected topressure that is greater than atmospheric pressure.1.4.2. <strong>Open</strong> conduitsA discharge is said to be <strong>in</strong> an open conduit when the surface of the water, so-called waterl<strong>in</strong>e, is <strong>in</strong>contact with the air and subjected to atmospheric pressure only.Conduits can be natural, such as streams and rivers, or artificial, such as channels for navigation,irrigation, dra<strong>in</strong>age ditches, sewer networks, etc.1.5. <strong>Flow</strong> pr<strong>in</strong>ciples <strong>in</strong> open conduitsStorm sewer and build<strong>in</strong>g dra<strong>in</strong>age systems are open conduits. The flow area is <strong>in</strong> contact with the airand is subjected to atmospheric pressure only. Because pressure cannot be forced from one end of theflow channel to the other end, the flowrate depends on the gradient of the slope of the channel and thefrictional drag along the walls. Because the flow is stable and uniform (streaml<strong>in</strong>ed), there is always aprogressive drop <strong>in</strong> water level from the beg<strong>in</strong>n<strong>in</strong>g to the end of the channel.In an open channel, the total energy conta<strong>in</strong>ed <strong>in</strong> the flow is the k<strong>in</strong>etic energy present <strong>in</strong> the form ofvelocity (Head Velocity) and the pressure energy due to the difference <strong>in</strong> water depth. Which producesthe follow<strong>in</strong>g equation:VTotal energy = + d2g2(8)whereVgdis the flowrate;is the gravitational constant;is the water depth measured from the channel bottom.Page 14 of 223<strong>Booklet</strong> 7 - <strong>Flow</strong> <strong>Measurement</strong> <strong>Methods</strong> <strong>in</strong> <strong>Open</strong> <strong>Channels</strong>
This equation shows that water depth varies when there is a variation <strong>in</strong> velocity, unlike closedconduits where changes <strong>in</strong> velocity produce changes <strong>in</strong> pressure. If flow <strong>in</strong>creases and energy isconverted to velocity, water depth must fall. Inversely, when velocity decl<strong>in</strong>es, water depth must<strong>in</strong>crease. A drop <strong>in</strong> water flow area is known as “drawdown”. On the contrary, <strong>in</strong> closed conduits,changes <strong>in</strong> pressure translate <strong>in</strong>to changes <strong>in</strong> flowrate, but the water level rema<strong>in</strong>s constant.This flow can manifest itself <strong>in</strong> the form of three possible categories:uniform flow: the slope of the water l<strong>in</strong>e is parallel to the slope of the channel bottom;gradually vary<strong>in</strong>g flow: liquid experiences an acceleration or deceleration due to a moderatechange <strong>in</strong> the flow section or the slope of the channel bottom;critical flow: this type of flow is produced by a strong contraction created by a lift <strong>in</strong> thebottom and/or a narrow<strong>in</strong>g of the width of the channel or by a sudden change <strong>in</strong> the slope of thechannel bottom.A Parshall flume is an excellent example of an <strong>in</strong>strument that measures changes <strong>in</strong> liquid depth whenvelocity <strong>in</strong>creases. When water enters the flume, it accelerates <strong>in</strong> the converg<strong>in</strong>g section (approach) andreaches a maximum velocity when it moves through the throat section where the bottom slopes down;caus<strong>in</strong>g the water level to drop significantly.This variation <strong>in</strong> liquid depth is directly related to the amount of water flow (flowrate). <strong>Flow</strong> curvesand flow tables for standard Parshall flumes are prepared on the basis of these variations.1.6. Pr<strong>in</strong>ciples of flow measurement <strong>in</strong> open channelsA number of approaches can be used to measure the flow of liquid <strong>in</strong> an open channel:−−−consider only k<strong>in</strong>etics, that is, the mechanics of movement of a liquid without the need to exam<strong>in</strong>eunderly<strong>in</strong>g forces. This is the pr<strong>in</strong>ciple of the depth/velocity method;basic <strong>in</strong>formation on known relations between gravity caus<strong>in</strong>g the flow and the <strong>in</strong>ertial andviscosity forces that slow it down;quantitatively analyze changes <strong>in</strong> the physical or chemical properties of the liquid after solublesubstances have been added. This is the pr<strong>in</strong>ciple of the dilution method.<strong>Flow</strong> can be measured us<strong>in</strong>g a variety of methods:−−−use of the flow regime variations pr<strong>in</strong>ciple, by creat<strong>in</strong>g a critical flow with the help of a measur<strong>in</strong>g<strong>in</strong>strument known as a “weir” or “control flume”;measurement of the dilution rate of a tracer, the concentration of which is known at the <strong>in</strong>takepo<strong>in</strong>t;the “volumetric tank” method, which consists of determ<strong>in</strong><strong>in</strong>g the time required to fill a conta<strong>in</strong>erof a known volume;<strong>Booklet</strong> 7 - <strong>Flow</strong> <strong>Measurement</strong> <strong>Methods</strong> <strong>in</strong> <strong>Open</strong> <strong>Channels</strong> Page 15 of 223
−the Q = AU relation uses a wet section (A) and the average velocity (U).Each of these methods will be discussed <strong>in</strong> detail <strong>in</strong> the sections that follow.1.7. Primary measurement device methods<strong>Measurement</strong>s of cont<strong>in</strong>uous flows, <strong>in</strong> the case of an open channel flow, are performed us<strong>in</strong>g ahydraulic structure that establishes a unique depth-flow relationship. These hydraulic structures arecalled “primary measur<strong>in</strong>g devices” and can be separated <strong>in</strong>to two categories: control flumes and weirs.This method, which is most common, determ<strong>in</strong>es flow by means of calculation, based solely on ameasurement of the water depth upstream from the primary measur<strong>in</strong>g device.Choos<strong>in</strong>g a primary flow measurement device must be exam<strong>in</strong>ed and designed on the basis of thefollow<strong>in</strong>g:−−−−−a precise knowledge of the maximum and m<strong>in</strong>imum flowrates that may be channeled to theprimary device. The flows must, depend<strong>in</strong>g on the primary device considered, be <strong>in</strong>cluded <strong>in</strong> thelimits recommended <strong>in</strong> this guide;fluctuations <strong>in</strong> water depth, accord<strong>in</strong>g to m<strong>in</strong>imum and maximum flows, must be the extremelimits, <strong>in</strong> order to <strong>in</strong>crease measurement precision, particularly if there are small variations <strong>in</strong> flow;the presence of solid material and possible obstruction;compliance with standards govern<strong>in</strong>g <strong>in</strong>stallation, conditions for approach to the primary deviceand loss of pressure due to <strong>in</strong>sert<strong>in</strong>g the device;the ease of calibration and test<strong>in</strong>g equipment.Flumes are generally preferred over weirs, due to their numerous advantages, namely greater drops <strong>in</strong>pressure and their ability to self-clean.1.7.1. FlumesFlumes are usually prefabricated devices that are <strong>in</strong>stalled temporarily or permanently <strong>in</strong> a flowsystem.They can be a “flat-bottom” type. In the case of a flat-bottom flume, the shape of the side walls createsa contraction of the flow of liquid (ex. cutthroat flume). They can also comb<strong>in</strong>e vertical and sidecontractions (ex. Parshall flume).1.7.1.1 General descriptionA flume is essentially a specially-molded open section that creates a restriction <strong>in</strong> the flow area. Flumeswork accord<strong>in</strong>g to the Venturi pr<strong>in</strong>ciple. By reduc<strong>in</strong>g the flow area, velocity <strong>in</strong>creases and water depthchanges (1) .A flume usually has three sections: a converg<strong>in</strong>g section, throat section and diverg<strong>in</strong>g section.Page 16 of 223<strong>Booklet</strong> 7 - <strong>Flow</strong> <strong>Measurement</strong> <strong>Methods</strong> <strong>in</strong> <strong>Open</strong> <strong>Channels</strong>
Sizes vary accord<strong>in</strong>g to the type and shape of flume. For practical purposes, to determ<strong>in</strong>e the absoluteflow of a flume, the calibration curves supplied by the manufacturer should be used.1.7.1.2 Advantages−−−−M<strong>in</strong>imal drop <strong>in</strong> pressure.Enables measurement <strong>in</strong> a large range of flow.The flowrate <strong>in</strong> flumes is usually high enough to prevent sedimentation; they are therefore selfclean<strong>in</strong>g.Provides a reliable measurement <strong>in</strong> free flow and submerged flow conditions.1.7.1.3 Disadvantages−−−−Installation is usually expensive.Installation requires extremely careful work.Requires a secure watertight base.<strong>Flow</strong> at the entrance must be evenly distributed, with little turbulence, to produce accuratemeasurements.1.7.2. WeirsA weir is one of the simplest and oldest structures used to measure flow. The weir’s large parts are easyto <strong>in</strong>spect, and any abnormalities can be detected or corrected immediately (2) .1.7.2.1 General descriptionA weir can be def<strong>in</strong>ed as a structure that is erected across an open channel to measure the discharge ofliquid.A th<strong>in</strong>-plated weir is a 3 to 6 mm (1/8 to 1/4 <strong>in</strong>) thick plate with a straight edge (crest), or a thick platewith a 45° angle edge that is used to reduce the thickness of the crest to the aforementioned sizes. Thisplate is placed across the flow and liquid is forced over the plate or <strong>in</strong>to a V-notch <strong>in</strong> the weir.The edge over which water flows is called the crest.The height of the weir between the crest and the channel bottom is called the crest height.The height of the discharge over the crest is called the nappe.The air space under the nappe, downstream from the weir, is called the ventilation.Figure 1 shows the components of a weir.<strong>Booklet</strong> 7 - <strong>Flow</strong> <strong>Measurement</strong> <strong>Methods</strong> <strong>in</strong> <strong>Open</strong> <strong>Channels</strong> Page 17 of 223
When a discharge is far enough away from the crest height to ensure that there is ventilation below thenappe, the flow is said to be free or critical. If air cannot move freely under the nappe, the flow is saidto be submerged. This type of situation can create <strong>in</strong>accurate read<strong>in</strong>gs because there is not enoughpressure upstream from the weir. Water depth measurements are therefore too deep and the velocity tooslow.The name of a weir is usually attributed to the shape of the notch <strong>in</strong> the weir. V-notch is therefore atriangular weir, a notch <strong>in</strong> the shape of a |_| is a rectangular weir, etc.Page 18 of 223<strong>Booklet</strong> 7 - <strong>Flow</strong> <strong>Measurement</strong> <strong>Methods</strong> <strong>in</strong> <strong>Open</strong> <strong>Channels</strong>
FIGURE 1 - WEIR COMPONENTS<strong>Flow</strong> is determ<strong>in</strong>ed by simply measur<strong>in</strong>g the vertical height, between the bottom of the notch (crest)and the surface of the water, at a determ<strong>in</strong>ed distance upstream from the weir, and us<strong>in</strong>g the calculationformula or table that corresponds to the shape and size of the weir.For each type of weir, empirical formulas and flow tables have been established for quick reference.Weirs are reliable measur<strong>in</strong>g <strong>in</strong>struments because, for a particular size and shape weir, <strong>in</strong> free flow orstable flow conditions, there is only one water depth upstream for a particular weir.1.7.2.2 Advantages−−−Is approximately 98 % precise <strong>in</strong> a laboratory. To produce this type of precision, it is important tocarefully respect all of the recommended dimensions when a weir is manufactured and <strong>in</strong>stalled.Inexpensive to manufacture.Can be used to measure a wide range of flowrates.1.7.2.3 Disadvantages- Serious loss of depth and backwater effect upstream.- Causes solids to deposit upstream.- Requires regular ma<strong>in</strong>tenance and frequent <strong>in</strong>spection.<strong>Booklet</strong> 7 - <strong>Flow</strong> <strong>Measurement</strong> <strong>Methods</strong> <strong>in</strong> <strong>Open</strong> <strong>Channels</strong> Page 19 of 223
1.8. <strong>Flow</strong> meter<strong>in</strong>g systemA flow meter<strong>in</strong>g system usually consists of two components: a primary device, as def<strong>in</strong>ed earlier, and asecondary device (or flowmeter).1.8.1. The secondary deviceTo obta<strong>in</strong> a flow measurement us<strong>in</strong>g the primary device, a second device called a “secondary device”must be <strong>in</strong>stalled. A secondary device can be simple or more sophisticated.The simplest device is a po<strong>in</strong>t-specific level read<strong>in</strong>g <strong>in</strong>dicator, such as a float. Depth is converted toflow us<strong>in</strong>g the depth/flow table that corresponds to the primary device <strong>in</strong> use. More sophisticated<strong>in</strong>struments can measure depth, perform a depth/flow conversion, cont<strong>in</strong>uously monitor values andeven transmit them over distances.1.9. Units of measurementThe most common units of measurement are:gal US /d : US gallons per daygal US /m<strong>in</strong> : US gallons per m<strong>in</strong>utegal UK /d : imperial gallons per daygal UK /m<strong>in</strong> : imperial gallons per m<strong>in</strong>utem 3 /d : cubic meters per dayft 3 /s : cubic feet per secondl/m<strong>in</strong> : liters per m<strong>in</strong>uteThe follow<strong>in</strong>g units are also used occasionally:Mgal US /d : millions of US gallons per daygal US /h : US gallons per hourgal US /s : US gallons per secondMgal UK /d : millions of imperial gallons per daygal UK /h : imperial gallons per hourgal UK /s : imperial gallons per secondm 3 /h : cubic meters per hourm 3 /m<strong>in</strong> : cubic meters per m<strong>in</strong>utel/h : liters per hourl/s : liters per secondUnits/day are used occasionally to express hourly flow.Example:The flow for an 8 to 9 hour period is 42,000 m 3 /d. To obta<strong>in</strong> the absolute hourlyvolume, divide this figure by 24. 42,000 m 3 /d therefore becomes 1,750 m 3 /h.For the purpose of this document, except <strong>in</strong> very specific <strong>in</strong>stances, metric units of measurement havebeen used.Page 20 of 223<strong>Booklet</strong> 7 - <strong>Flow</strong> <strong>Measurement</strong> <strong>Methods</strong> <strong>in</strong> <strong>Open</strong> <strong>Channels</strong>
1.10. Reference measurementIf a measur<strong>in</strong>g device is <strong>in</strong>stalled <strong>in</strong> an open channel, a reference measurement technique must be used.A reference measurement is usually a ruler <strong>in</strong> meters or feet, that is permanently placed at themeasur<strong>in</strong>g po<strong>in</strong>t and is used to:−−−calibrate the secondary device (flowmeter);take a po<strong>in</strong>t-specific flow read<strong>in</strong>g;quickly and easily check and compare the flowmeter value to the reference value.The reference value is always considered the true value.1.11. Measur<strong>in</strong>g po<strong>in</strong>t1.11.1. LocationThe location of a measur<strong>in</strong>g po<strong>in</strong>t to gauge the discharge of liquid must be determ<strong>in</strong>ed on the basis ofthe follow<strong>in</strong>g considerations:−−−−−there must be a m<strong>in</strong>imum number of measur<strong>in</strong>g po<strong>in</strong>ts, consider<strong>in</strong>g the costs to build and ma<strong>in</strong>ta<strong>in</strong>them;the measur<strong>in</strong>g po<strong>in</strong>t must allow measurement of the cont<strong>in</strong>uous flowrate of the total liquiddischarge;the primary device must allow m<strong>in</strong>imum, medium and maximum flows to be measured;no branch<strong>in</strong>g off should be made downstream from the measur<strong>in</strong>g chamber;the site must be accessible all year long.1.11.2. Measur<strong>in</strong>g chamberThe physical characteristics of a chamber must enable personnel to carry out the measurements,ma<strong>in</strong>tenance and test<strong>in</strong>g necessary to ensure the quality of measurements. The chamber must meetspecific requirements:−−−−−−−−depend<strong>in</strong>g on the flowrates present and the primary device <strong>in</strong>stalled, the chamber must be largeenough to allow the primary device to be <strong>in</strong>spected and the secondary device to be <strong>in</strong>serted. Theremust also be enough room available to <strong>in</strong>stall a temporary or permanent automatic sampler;it must have a light<strong>in</strong>g and heat<strong>in</strong>g system that meet the requirements of this type of structure;it must have a remotely-controlled ventilation system;if the chamber is located deeper than 6 m, it must have a safety land<strong>in</strong>g;the chamber’s access hole must be at least 915 mm <strong>in</strong> diameter;the access cover must be at least 750 mm <strong>in</strong> diameter to allow access for personnel and equipment;a ladder must be permanently <strong>in</strong>stalled to provide access <strong>in</strong>side the manhole;safety standards govern<strong>in</strong>g construction and access to enclosed locations must be respected.<strong>Booklet</strong> 7 - <strong>Flow</strong> <strong>Measurement</strong> <strong>Methods</strong> <strong>in</strong> <strong>Open</strong> <strong>Channels</strong> Page 21 of 223
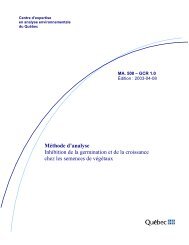
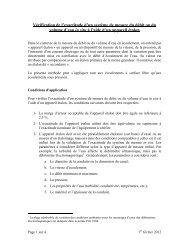
Figure 2 shows the ma<strong>in</strong> physical components and characteristics of a measur<strong>in</strong>g chamber where theprimary device is a Palmer-Bowlus flume. For purposes of this demonstration, pre-fabricatedre<strong>in</strong>forced concrete observation wells are used. Where appropriate, a measurement chamber can bebuilt <strong>in</strong> a square or rectangular shape.Figure 3 shows the pr<strong>in</strong>cipal components and physical characteristics of a measur<strong>in</strong>g chamber, <strong>in</strong>which the primary device is a Parshall flume.The dimensions and physical characteristics of the measur<strong>in</strong>g chambers <strong>in</strong> Tables 1 and 2 are shownfor <strong>in</strong>formation purposes only. An assessment of flow conditions will help to determ<strong>in</strong>e whichcharacteristics are required.Page 22 of 223<strong>Booklet</strong> 7 - <strong>Flow</strong> <strong>Measurement</strong> <strong>Methods</strong> <strong>in</strong> <strong>Open</strong> <strong>Channels</strong>
FIGURE 2 - PALMER-BOWLUS - FLUME CHAMBERNote: The dimensions that correspond to the letters are shown <strong>in</strong> Table 1.<strong>Booklet</strong> 7 - <strong>Flow</strong> <strong>Measurement</strong> <strong>Methods</strong> <strong>in</strong> <strong>Open</strong> <strong>Channels</strong> Page 23 of 223
FIGURE 3 - PARSHALL FLUME - CHAMBERPage 24 of 223<strong>Booklet</strong> 7 - <strong>Flow</strong> <strong>Measurement</strong> <strong>Methods</strong> <strong>in</strong> <strong>Open</strong> <strong>Channels</strong>
TABLE 1 - DIMENSIONS FOR PALMER-BOWLUS FLUME CHAMBERDimensions <strong>in</strong> millimeters and <strong>in</strong>chesDiameter (D)mm (<strong>in</strong>)Recommended m<strong>in</strong>imum dimensionsH Z B A* F D1 D2 D3 H1102 mm4 (<strong>in</strong>)1526432171024686275121219489143676230121948152 mm6 (<strong>in</strong>)2038635251526813327631600639143676230121948203 mm8 (<strong>in</strong>)25410839332038813327631600639143676230121948254 mm10 (<strong>in</strong>)3051210424125410839337632135849143676230152460305 mm12 (<strong>in</strong>)3551412444930512889357632440969143676230182872381 mm15 (<strong>in</strong>)43217154961381159653876328951149143676230182872457 mm18 (<strong>in</strong>)508201854734571810414176333521329143676230198178533 mm21 (<strong>in</strong>)584232159855332111174476338101509143676230210084610 mm24 (<strong>in</strong>)6602624639761024134653101444191749143676230228690686 mm27 (<strong>in</strong>)736292768109686271422561014487619291436762302591102762 mm30 (<strong>in</strong>)812323099122762301625641014548621691436762302591102914 mm36 (<strong>in</strong>)9653836831459143619557710146553258914367623028951141067 mm42 (<strong>in</strong>)111744429216910674222608915267620300914367623030481201219 mm48 (<strong>in</strong>)1270504902193121948256510115268686342914367623032001261372 mm54 (<strong>in</strong>)1422565511217137254287011315269753384914367623033521321524 mm60 (<strong>in</strong>)1574626121241152460317512515261082042691436762303505138* The m<strong>in</strong>imum distance should always be twice the diameter of the <strong>in</strong>let conduit.<strong>Booklet</strong> 7 - <strong>Flow</strong> <strong>Measurement</strong> <strong>Methods</strong> <strong>in</strong> <strong>Open</strong> <strong>Channels</strong> Page 25 of 223
Dimensions <strong>in</strong> millimeters and <strong>in</strong>ches (or feet)TABLE 2 - DIMENSIONS FOR PARSHALL FLUME CHAMBERW L D M B E F G S P P1 T T1251 "512 "763 "1526 "2299 "30512 "45718 "61024 "9143’12194’15245’18296’21347’24388’304810’365812’457215’609620’762525’914430’1219240’1524050’30512 "45718 "61024 "91436 "137254 "18296’24388’24388’304810’365812’457215’457215’487716’548618’640121’731524’914430’1158238’1371645’1463048’1645954’1889862’1686 19/32 "2148 13/32 "25910 3/16 "3971' 3 5/8"5751' 10 5/8"8452' 9 1/4"10263' 4 3/8"12073' 11 1/2"15725' 1 7/8"16326' 4 1/4"19977' 6 5/8"26678' 9"30329' 11 3/8"339711' 1 3/4"475615' 7 1/4"560718' 4 3/4"762525'914430'1066835'1231240' 4 3/4"1548150' 9 1/2"1852960' 9 1/2"--- 3561'2"--- 4061'4"--- 4571'6"305 6101' 2'305 8641' 2'10"381 13431'3" 4' 4 7/8"381 14191'3" 4' 7 7/8"381 14951'3" 4' 10 7/8"381 16451'3" 5' 4 3/4"457 17941'6" 5' 10 5/8"457 19431'6" 6' 4 1/2"457 20921'6" 6' 10 3/8"457 22421'6" 7' 4 1/4"457 23911'6" 7' 10 1/8"--- 426714'--- 487716'--- 762525'--- 762525'--- 762525'--- 792526'--- 823027'--- 823027'2299"30512"61024"61024"76230"9143'9143'9143'9143'9143'9143'9143'9143'9143'12194'15245'18296'21347'21347'21347'21347'21347'763"1144 1/2"1526"3051'3051'6102'6102'6102'6102'6102'6102'6102'6102'6102'9143'9143'12194'18296'18296'18296'18296'18296'2038"25410"3051'6102'4571' 6"9143'9143'9143'9143'9143'9143'9143'9143'9143'18296'24388'304810'365812'396213'426714'487716'609620'30512"45718"61024"61024"76230"91436"106742"106742"12194'15245'15245'18296'18296'21347'21347'24388'24388'27699'27699'304810'304810'335311'1686 19/32"91436"214 9148 13/32" 36"259 91410 3/16" 36"902 9142' 11 1/2" 36"1080 12193' 6 1/2" 4'1492 15244' 10 3/4 5'1676 18295' 6" 6'1854 21346' 1" 7'2223 24387' 3 1/2" 8'2712 27698' 10 3/4" 9'3080 335310' 1 1/4" 11'3442 365711' 3 1/2" 12'3810 396212' 6" 13'4172 426713' 8 1/4" 14'--- 487716'--- 609620'--- 762525'--- 914430'--- 1066835'--- 1280242'--- 1585052'--- 1889862'2489 3/4"32712 7/8"63525"68627"83833"9913' 3"9913' 3"9913' 3"9913' 3"9913' 3"9913' 3"9913' 3"9913' 3"9913' 3"13724' 6"16765' 6"20576' 9"24388'24388'24388'24388'24388'25710 1/8"34813 11/16"66726 1/4"72428 1/2"87634 1/2"114345 "114345 "114345"114345 "114345 "114345 "114345 "114345 "114345 "15625' 1 1/2"18676' 1 1/2"22867' 6"28199' 3"28199' 3"28199' 3"28199' 3"28199' 3"Page 26 of 223<strong>Booklet</strong> 7 - <strong>Flow</strong> <strong>Measurement</strong> <strong>Methods</strong> <strong>in</strong> <strong>Open</strong> <strong>Channels</strong>
1.12. Choos<strong>in</strong>g a measurement method1.12.1. Selection criteriaIt is important to select the right method to produce an accurate effluent flow measurement. The variety ofmethods available makes choos<strong>in</strong>g the right one difficult. To guide you <strong>in</strong> determ<strong>in</strong><strong>in</strong>g which method is best,needs must be def<strong>in</strong>ed, the methods available must be gauged and possible compromises exam<strong>in</strong>ed.The follow<strong>in</strong>g criteria must be considered (3) :− the presence of solids <strong>in</strong> water;− the desired precision and possible precision of each method;− the maximum flow to measure (Q max );− range of measurements (Q max /Q m<strong>in</strong> );− tolerance to fluctuations <strong>in</strong> discharge;− width of the flume;− the allowable and result<strong>in</strong>g maximum drop <strong>in</strong> pressure for each method;− the repeatability and reliability required;− the need to connect the measur<strong>in</strong>g <strong>in</strong>strument to a data entry and process<strong>in</strong>g system;− the acceptable precision produced by the measur<strong>in</strong>g <strong>in</strong>strument <strong>in</strong> use;− sensitivity of the <strong>in</strong>strument to fluctuations <strong>in</strong> flow;− <strong>in</strong>stallation and ma<strong>in</strong>tenance costs.1.12.2. Presence of solidsEffluents conta<strong>in</strong> all types of suspended solids of vary<strong>in</strong>g shapes and sizes. Solids tend to deposit upstreamfrom the measur<strong>in</strong>g device, stick to walls, become entangled <strong>in</strong> equipment and adhere to structures.Upstream deposits can obstruct flow or change approach velocities, and deposits that adhere to the walls of ameasur<strong>in</strong>g device can distort geometry and its orig<strong>in</strong>al dimensions. Read<strong>in</strong>gs us<strong>in</strong>g such equipment can be<strong>in</strong>accurate. This is particularly true <strong>in</strong> the case of weirs.Some primary measurement devices are affected little by the presence of suspended solids, particularly flumes,because they have smooth walls and a relatively flat bottom.1.12.3. Maximum flowBefore select<strong>in</strong>g a particular measurement method, it is important to <strong>in</strong>spect the size of flow that may bemeasured. This <strong>in</strong>formation can be obta<strong>in</strong>ed <strong>in</strong> a several ways:−−−−a thorough knowledge of the facility (process, use of water, sewer network, etc.);a measurement of water consumption;the relationship between water consumption and manufactur<strong>in</strong>g rates for a similar facility;the water supply capacity;<strong>Booklet</strong> 7 - <strong>Flow</strong> <strong>Measurement</strong> <strong>Methods</strong> <strong>in</strong> <strong>Open</strong> <strong>Channels</strong> Page 27 of 223
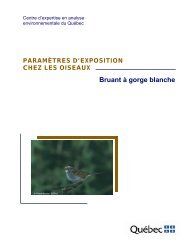
−−−a visual assessment of effluent flow by an experienced <strong>in</strong>dividual;an <strong>in</strong>stant measurement of effluent flow (ex. depth/velocity);determ<strong>in</strong>ation of the approximate diameter and slope of sewer pipes, <strong>in</strong>dication of the network’smaximum capacity.If plant activities cause major fluctuations <strong>in</strong> flow and the only <strong>in</strong>dication of flow available is an average flowvalue. This flow value should be <strong>in</strong>creased by a factor of 2.5 to determ<strong>in</strong>e the maximum discharge, to reflectpeak periods.1.12.4. Tolerance of fluctuations <strong>in</strong> flowIf a measur<strong>in</strong>g device has been <strong>in</strong>stalled correctly, it should cont<strong>in</strong>ue to have the same precision dur<strong>in</strong>gfluctuations <strong>in</strong> flow. It is therefore important to verify how systems react dur<strong>in</strong>g fluctuations.In the control section of a measur<strong>in</strong>g device, a drop or <strong>in</strong>crease <strong>in</strong> discharge should not cause turbulence andcause the flowrate to vary. It should <strong>in</strong>stead show up essentially as a variation of water depth <strong>in</strong> the primarydevice.1.12.5. Flume widthIf a flow channel is too wide or too narrow, the possibility of restrict<strong>in</strong>g or enlarg<strong>in</strong>g the flow area should beexam<strong>in</strong>ed, to allow measur<strong>in</strong>g equipment to be <strong>in</strong>stalled and to ensure that equipment can operate correctly.The flow channel should be at least as wide as the measur<strong>in</strong>g device and no wider than the width of themeasur<strong>in</strong>g element plus 10 m. Figure 4 illustrates this type of setup.1.12.6. Loss of chargeBefore <strong>in</strong>stall<strong>in</strong>g a measur<strong>in</strong>g device, it is important to verify the allowable maximum drop <strong>in</strong> charge.Different measurement methods create different drops <strong>in</strong> charge. For a particular measur<strong>in</strong>g <strong>in</strong>strument, themaximum loss of depth corresponds to the maximum flow.Loss of charge for flumes is generally less than that caused by weirs. The difference is approximately 30 %.Page 28 of 223<strong>Booklet</strong> 7 - <strong>Flow</strong> <strong>Measurement</strong> <strong>Methods</strong> <strong>in</strong> <strong>Open</strong> <strong>Channels</strong>
FIGURE 4 - FLUME - FLUME AND FLOW CHANNEL LAYOUT<strong>Booklet</strong> 7 - <strong>Flow</strong> <strong>Measurement</strong> <strong>Methods</strong> <strong>in</strong> <strong>Open</strong> <strong>Channels</strong> Page 29 of 223
1.12.7. PrecisionIt is important not to expect to obta<strong>in</strong> a very high degree of precision. <strong>Measurement</strong>s where the marg<strong>in</strong> forerror is less than 1 % may be unrealistic and often very expensive, whereas a marg<strong>in</strong> for error of 3 % to 5 %, or10 % is quite acceptable <strong>in</strong> most cases (3) .Under normal conditions of use, where a device has been <strong>in</strong>stalled accord<strong>in</strong>g to str<strong>in</strong>gent codes and by skilled<strong>in</strong>dividuals, most measurement methods produce a marg<strong>in</strong> for error of less than 10 %.1.12.8. Range of measurementWhen select<strong>in</strong>g a method of measurement, it is important to exam<strong>in</strong>e the ratio between the m<strong>in</strong>imum andmaximum discharge, <strong>in</strong> order to select an <strong>in</strong>strument that creates an optimum water depth differential.It is also important to ensure that the method chosen produces the same type of precision of measurements forthe range of flow values that are likely to occur.Table 3 shows a chart that can be used for a quick comparison of devices and to select the device best adaptedto the situation. A number of publications provide these types of charts (4) .1.12.9. Important figuresAlthough precision is required for the compilation of data collected, precision should not be estimated with aseries of figures <strong>in</strong> excess than what is allowed for the <strong>in</strong>strument with the least precision. This will result <strong>in</strong> aprecision that does not exist and can cause confusion (2) .Page 30 of 223<strong>Booklet</strong> 7 - <strong>Flow</strong> <strong>Measurement</strong> <strong>Methods</strong> <strong>in</strong> <strong>Open</strong> <strong>Channels</strong>
TABLE 3 - CHART FOR COMPARING THE MEASUREMENT CAPABILITIES OF PRIMARYDEVICESDéversoirsTriangulaires22,5 mm30 mm45 mm60 mm90 mmRectangulairesavec contractions305 mm457 mm610 mm762 mm914 mm1219 mm1524 mm1829 mm2438 mm3048 mmRectangulairessans contractions305 mm457 mm610 mm762 mm914 mm1219 mm1524 mm1829 mm2438 mm3048 mmCipolletti305 mm457 mm610 mm762 mm914 mm1219 mm1524 mm1829 mm2438 mm3048 mmCanauxParshall25 mm51 mm76 mm152 mm229 mm305 mm457 mm610 mm914 mm1219 mm1524 mm1829 mm3048 mm3658 mmPalmer-Bowlus101 mm152 mm203 mm254 mm305 mm381 mm457 mm533 mm610 mm686 mm762 mmLeopold-Lagco102 mm152 mm203 mm254 mm305 mm381 mm457 mm533 mm610 mm762 mm914 mm1067 mm1219 mm1372 mm1524 mm1676 mm1829 mmHs122 mm152 mm183 mm244 mm305 mmH152 mm229 mm305 mm457 mm610 mm762 mm914 mm1372 mmHL610 mm762 mm914 mm1067 mm1219 mm0 1 3 6 10 15 25 40 60 90 130 180 240 310 390 480 580 690 810 940 1080Débit en mille mètres cubes par jour<strong>Booklet</strong> 7 - <strong>Flow</strong> <strong>Measurement</strong> <strong>Methods</strong> <strong>in</strong> <strong>Open</strong> <strong>Channels</strong> Page 31 of 223
Usually, <strong>in</strong> a calculation that <strong>in</strong>volves multiply<strong>in</strong>g or divid<strong>in</strong>g with figures from observations, the result shouldconta<strong>in</strong> the same number of figures as the value that has the least number of figures.Application of this rule implies that the last figure does not necessarily represent a value but rather a moreprobable value.1.12.10. Repeatability and reliabilityRepeatability, for a measur<strong>in</strong>g <strong>in</strong>strument, is the ability to always produce the same result when used under thesame conditions.Reliability is the ability of an <strong>in</strong>strument to operate without failure, under controlled conditions and for aspecific period of time.It is important to ensure that <strong>in</strong>formation gathered is accurate and that fluctuations <strong>in</strong> measurement are theresult of an <strong>in</strong>dustrial process, not the <strong>in</strong>strument. This criterion is particularly important because <strong>in</strong>spection of<strong>in</strong>struments is often centralized and an operator cannot immediately determ<strong>in</strong>e if an <strong>in</strong>strument is operat<strong>in</strong>gcorrectly. The period between a visual <strong>in</strong>spection and the date a read<strong>in</strong>g is logged often raises questions whenresults are <strong>in</strong>terpreted.1.12.11. Installation detailsManufactur<strong>in</strong>g a layout that complies with code is recommended, rather than try<strong>in</strong>g to estimate the effects ofconditions that do not comply with regulations and try<strong>in</strong>g to correct values obta<strong>in</strong>ed under these conditions.Primary measur<strong>in</strong>g devices should be located <strong>in</strong> a straight section of flow and should be perfectly aligned withthe direction of flow.Flumes and weirs must be placed level longitud<strong>in</strong>ally and transversely, <strong>in</strong> other words, <strong>in</strong> the direction of flowand perpendicular to flow.In the approach section, there should be no branch l<strong>in</strong>es, curves, heads of water or abrupt changes <strong>in</strong> thechannel bottom.To avoid generat<strong>in</strong>g a submerged flow due to backwater, the channel should have enough capacity to allowwater to discharge immediately at the highest flowrate.Installation of primary measur<strong>in</strong>g devices equipped with still<strong>in</strong>g wells is recommended. Still<strong>in</strong>g wells areconnected to the measur<strong>in</strong>g device through small conduits. They must be positioned <strong>in</strong> locations where waterdepth measurements are taken <strong>in</strong> the flume. The dimensions of wells and conduits must correspond to thestandards prescribed <strong>in</strong> Table 4.Still<strong>in</strong>g wells should be wide enough to allow a flowmeter level detector to be <strong>in</strong>stalled and operated and thewell to be cleaned.A staff gauge (ruler) must be permanently placed at the measur<strong>in</strong>g po<strong>in</strong>t.Page 32 of 223<strong>Booklet</strong> 7 - <strong>Flow</strong> <strong>Measurement</strong> <strong>Methods</strong> <strong>in</strong> <strong>Open</strong> <strong>Channels</strong>
TABLE 4 - DIMENSIONS FOR STILLING WELLSDiameter of still<strong>in</strong>g wellDiameter of conduitmm <strong>in</strong> mm <strong>in</strong>203 8 12.70 1/2254 10 12.70 1/2305 12 12.70 1/2406 16 12.70 1/2508 20 15.90 5/8610 24 19.00 3/4762 30 31.80 1 1/41.12.12. Ma<strong>in</strong>tenanceAlthough some types of flumes are designed to allow movement of solids, heavy debris can become depositedand cause meter<strong>in</strong>g errors. Periodic <strong>in</strong>spections of all primary measur<strong>in</strong>g devices is recommended. Thefollow<strong>in</strong>g items should be checked and the follow<strong>in</strong>g work carried out, where necessary:−−−−−the presence of solids or debris;longitud<strong>in</strong>al and transversal planes;the presence of cracks <strong>in</strong> the structure;clean<strong>in</strong>g out still<strong>in</strong>g wells and connect<strong>in</strong>g conduits;calibration of the water level detector.<strong>Booklet</strong> 7 - <strong>Flow</strong> <strong>Measurement</strong> <strong>Methods</strong> <strong>in</strong> <strong>Open</strong> <strong>Channels</strong> Page 33 of 223
1.12.13. CalibrationA primary device may require calibration <strong>in</strong> the follow<strong>in</strong>g <strong>in</strong>stances:−−the system does not comply with standards specified <strong>in</strong> this guide;a serious deterioration of the system is noted.Calibration consists of determ<strong>in</strong><strong>in</strong>g, for vary<strong>in</strong>g degrees of flow, a relationship between the flow and waterdepth measured <strong>in</strong> the primary device. On the basis of this, a new empirical depth/flow relationship can beestablished for the flow of liquid that may be measured by the device.Even <strong>in</strong> systems have been <strong>in</strong>stalled under exact<strong>in</strong>g standard, measur<strong>in</strong>g devices produce an estimated 5 %deviation, it may be difficult to f<strong>in</strong>d a method that is precise and accurate enough to perform calibration.Technically, the method that is used should have no error. In practice, however, it is realistic to tolerate a 1 %to 2 % marg<strong>in</strong> of error. Precision (which can improve through repeated measurements) should beapproximately 95 %. Section 5 discusses the precision and accuracy of methods. It is the responsibility of theuser to demonstrate that the method(s) employed complies with the aforementioned accuracy and precisionobjectives or other objectives prescribed by a public authority or <strong>in</strong> accordance with regulation.Generally, the volumetric method is used only if the follow<strong>in</strong>g conditions can be respected (5) ;−−−A regular shape tank is available and its capacity can be measured at different levels with a precision of99 %.For each test, water depth <strong>in</strong> the primary device at the measur<strong>in</strong>g po<strong>in</strong>t is stable. The allowable deviationlimits are detailed <strong>in</strong> the description of each primary device.It takes longer than 90 seconds to fill the measur<strong>in</strong>g tank.The dilution method, which uses salt or a chemical tracer, if:−−−the primary measurement device is too large for use of the volumetric method;the water depth <strong>in</strong> the primary device at the measur<strong>in</strong>g po<strong>in</strong>t is stable, for each test. The allowabledeviation limits are <strong>in</strong>dicated <strong>in</strong> the description of each primary device;a regular shape tank is unavailable, the capacity of which can be calibrated precisely at different levels.Dur<strong>in</strong>g calibration of the primary device, <strong>in</strong>formation detail<strong>in</strong>g its <strong>in</strong>stallation and status must be taken down.The calibration procedure and method of measur<strong>in</strong>g water depth and flow must be described <strong>in</strong> detail. This<strong>in</strong>formation must be kept as a reference document, dur<strong>in</strong>g the entire period the primary device is <strong>in</strong> use.Page 34 of 223<strong>Booklet</strong> 7 - <strong>Flow</strong> <strong>Measurement</strong> <strong>Methods</strong> <strong>in</strong> <strong>Open</strong> <strong>Channels</strong>
2. DESCRIPTION OF FLUMESThe sections that follow discuss flumes that may be present at permanent or temporary test sites.2.1. Parshall flumeThe Parshall flume was designed <strong>in</strong> the later 1920s to measure the flow of irrigation water. Today, this type offlume is often used to measure the flow of wastewater, for permanent or temporary <strong>in</strong>stallations (2) .2.1.1. DescriptionA Parshall flume consists of a converg<strong>in</strong>g section, a throat section and diverg<strong>in</strong>g section (6) .The crest of the throat section is tilted downstream. In other words, there is a sill between the horizontal crestand converg<strong>in</strong>g section and the crest of the throat section.For channels smaller than 2.44 m (8 ft), the <strong>in</strong>let of the converg<strong>in</strong>g section may be rounded, and largerchannels may have vertical walls at a 45° angle.To prevent erosion due to water fall, the diverg<strong>in</strong>g section is usually extended by means of vertical walls, andthe angle of these walls will be steeper than the angle of the walls of the diverg<strong>in</strong>g section (see Figures 5 and8).These channels have been standardized for 25 mm (1 <strong>in</strong>) to 15.2 m (50 ft) widths. The standardized sizes <strong>in</strong>millimeters and <strong>in</strong>ches are: 25 (1), 51 (2), 76 (3), 152 (6), 229 (9), 305 (12), 457 (18), 610 (24), 914 (36), 1219(48), 1524 (60), 1829 (72), 2134 (84), 2438 (96), 3048 (120), 3658 (144), 4572 (180), 6096 (240), 7620 (300),9144 (360), 12192 (480) et 15240 (600) mm (<strong>in</strong>). This type of flume is illustrated <strong>in</strong> Figure 5.<strong>Booklet</strong> 7 - <strong>Flow</strong> <strong>Measurement</strong> <strong>Methods</strong> <strong>in</strong> <strong>Open</strong> <strong>Channels</strong> Page 35 of 223
FIGURE 5 - PARSHALL FLUME - ILLUSTRATION OF FLUMEPage 36 of 223<strong>Booklet</strong> 7 - <strong>Flow</strong> <strong>Measurement</strong> <strong>Methods</strong> <strong>in</strong> <strong>Open</strong> <strong>Channels</strong>
2.1.2. Operat<strong>in</strong>g pr<strong>in</strong>cipleA Parshall flume operates accord<strong>in</strong>g to the Venturi pr<strong>in</strong>ciple. Due to lateral restrictions, the flume restricts theflow area, caus<strong>in</strong>g the water level upstream from the throat section to rise. A sudden or steep drop <strong>in</strong> waterlevel at the throat section creates an <strong>in</strong>crease <strong>in</strong> flow velocity.The flowrate can be obta<strong>in</strong>ed simply by measur<strong>in</strong>g the water depth, because it has been established that depthvaries proportionally with flow.Although this flume can be used <strong>in</strong> submerged flow conditions, use <strong>in</strong> free flow conditions is recommended. Infree flow conditions, only one measur<strong>in</strong>g po<strong>in</strong>t has to be used to take a measurement, whereas <strong>in</strong> submergedconditions, the depth downstream from the throat section must also be measured.2.1.3. ApplicationsAlthough <strong>in</strong>itially developed to measure flow <strong>in</strong> natural open channels such as rivers, streams, dra<strong>in</strong>ageditches, etc., Parshall flumes are now widely used to measure flow <strong>in</strong> man-made open channels, such as stormand domestic dra<strong>in</strong>age systems, sewage treatment plant <strong>in</strong>lets and outlets, etc.Because of its geometry and operat<strong>in</strong>g pr<strong>in</strong>ciple, a Parshall flume is extremely effective for measur<strong>in</strong>g the flowof water that conta<strong>in</strong>s solids. Because it creates little loss of depth, it can be easily adapted to exist<strong>in</strong>g sewersystems.2.1.4. DimensionsThe dimensions of a Parshall flume are def<strong>in</strong>ed by the width of constriction. Figure 6 shows the physicalcharacteristics of a Parshall flume and Table 5, its standard dimensions.<strong>Booklet</strong> 7 - <strong>Flow</strong> <strong>Measurement</strong> <strong>Methods</strong> <strong>in</strong> <strong>Open</strong> <strong>Channels</strong> Page 37 of 223
FIGURE 6 - PARSHALL FLUME - PHYSICAL AND FLOW CHARACTERISTICSFor standard dimensions, see Table 5.Page 38 of 223<strong>Booklet</strong> 7 - <strong>Flow</strong> <strong>Measurement</strong> <strong>Methods</strong> <strong>in</strong> <strong>Open</strong> <strong>Channels</strong>
TABLE 5 - PARSHALL FLUME – STANDARD DIMENSIONSD I M E N S I O N S <strong>in</strong> mm et (feet an d <strong>in</strong>ches )W A 2/3A B C D E F G H K M N P R X Y25 ± 0,4 363 242 356 93 168 152to 76 203 206 19 29 8 131" ±1/64" 1' 2-9/32" 9-17/32 " 1' 2" 3-21/32" 6-19/32" 229 3" 8" 8-1/8" 3/4" 1-1/8 " 5/16" 1/2"6"to9"51 ± 0,4 414 109 406 135 214 152to 114 254 257 22 43 16 252"±1/64" 1'4-5/16" 10-7/8 1' 4" 5-5/16" 8-13/32" 254 4-1/2" 10" 10-1/8" 7/8" 1-11/16 " 5/8" 1"6"to10"76 ± 0,4 467 311 457 178 259 304,8to 152 305 309 25 57 25 383"±1/64" 1'6-3/8" 1' 1/4" 1' 6" 7" 10-3/16" 457 6" 1' 1' 5/32" 1" 2-1/4 " 1" 1-1/2"1'to1-1/2'152 ± 0,8 621 414 610 394 397 610 305 610 ---- 76 305 114 902 406 51 766"±1/32" 2' 7/16" 1' 4-5/16" 2' 1' 3-1/2" 1' 3-5/8" 2' 1' 2' 3" 1' 4-1/2 " 2' 11-1/2" 1' 4" 2" 3"229 ± 0,8 880 587 864 381 575 762 305 457 ---- 76 305 114 1080 406 51 769"±1/32" 2' 10-5/8" 1' 11-1/8" 2' 10" 1' 3" 1' 10-5/8" 2' 6" 1' 1' 6" 3" 1' 4-1/2 " 3' 6-1/2" 1' 4" 2" 3"305 ± 0,8 1372 914 1343 610 845 914 610 914 ---- 76 381 229 1492 508 51 7612"±1/32" 4' 6" 3’ 4' 4-7/8" 2' 2' 9-1/4" 3 ' 2' 3 ' 3" 1' 3" 9" 4' 10-3/4" 1' 8" 2" 3"457 ± 0,8 1448 965 1419 762 1026 914 610 914 ---- 76 381 229 1676 508 51 7618"±1/32" 4' 9" 3' 2" 4' 7-7/8" 2' 6" 3' 4-3/8" 3 ' 2' 3 ' 3" 1' 3" 9" 5' 6" 1' 8" 2" 3"610 ± 0,8 1524 1016 1495 914 1207 914 610 914 ---- 76 381 229 1854 508 51 762'±1/32" 5' 3' 4" 4' 10-7/8" 3 ' 3' 11-1/2" 3 ' 2' 3 ' 3" 1' 3" 9" 6' 1" 1' 8" 2" 3"914 ± 0,8 1676 1118 1645 1219 1572 914 610 914 ---- 76 381 229 2223 508 51 763'±1/32" 5' 6" 3' 8" 5' 4-3/4" 4' 5' 1-7/8" 3 ' 2' 3 ' 3" 1' 3" 9" 7' 3-1/2" 1' 8" 2" 3"1219 ± 0,8 1829 1219 1794 1524 1937 914 610 914 ---- 76 457 229 2712 610 51 764'±1/32" 6' 4' 5' 10-5/8" 5' 6' 4-1/4" 3 ' 2' 3 ' 3" 1' 6" 9" 8' 10-3/4" 2' 2" 3"1524 ± 0,8 1981 1321 1943 1829 2302 914 610 914 ---- 76 457 229 3080 610 51 765'±1/32" 6' 6" 4' 4" 6' 4-1/2" 6 ' 7' 6-5/8" 3 ' 2' 3 ' 3" 1' 6" 9" 10' 1-1/4" 2' 2" 3"1829 ± 0,8 2134 1422 2092 2134 2667 914 610 914 ---- 76 457 229 3442 610 51 766'±1/32" 7' 4'8" 6' 10-3/8" 7' 8' 9" 3 ' 2' 3 ' 3" 1' 6" 9" 11' 3-1/2" 2' 2" 3"2134 ± 0,8 2286 1524 2242 2438 3032 914 610 914 ---- 76 457 229 3810 610 51 767'±1/32" 7' 6" 5' 7' 4-1/4" 8' 9' 11-3/8" 3 ' 2' 3 ' 3" 1' 6" 9" 12' 6" 2' 2" 3"2438 ± 0,8 2438 1626 2391 2769 3397 914 610 914 ---- 76 457 229 4172 610 51 768'±1/32" 8' 5' 4" 7' 10-1/8" 9' 11' 1-3/4" 3 ' 2' 3 ' 3" 1' 6" 9" 13' 8-1/4" 2' 2" 3"3048 ± 0,8 1829 4267 3658 4756 1219 914 1829 ---- 152 343 51 30510'±1/32" 6' 14' 12' 15' 7-1/4" 4 ' 3 ' 6 ' 6" 1' 1-1/2" 2" 1'3658 ± 0,8 2032 4877 4470 5607 1524 914 2438 ---- 152 343 229 30512'±1/32" 6' 8" 16' 14' 8" 18' 4-3/4" 5' 3 ' 8 ' 6" 1' 1-1/2" 9" 1'4572 ± 0,8 2337 7620 5588 7620 1829 4 ' 3048 ---- 229 457 229 30515'±1/32" 7' 8" 25' 18' 4" 25' 6 ' 1219 10' 9" 1' 6" 9" 1'6096 ± 0,8 2845 7620 7315 9144 2134 1829 3658 ---- 305 686 229 30520'±1/32" 9' 4" 25' 24' 30' 7 ' 6 ' 12 ' 1' 2' 3 " 9" 1'7620 ± 0,8 3353 7620 8941 10668 2134 1829 3962 ---- 305 686 229 30525'±1/32" 11' 25' 29' 4" 35' 7 ' 6 ' 13 ' 1' 2' 3 " 9" 1'9144 ± 0,8 3861 26' 10566 12313 2134 1829 4267 ---- 305 686 229 30530'±1/32" 12' 8" 7925 34' 8" 40' 4-3/4" 7 ' 6 ' 14 ' 1' 2' 3 " 9" 1'12192±0,8 4877 8230 13818 15481 2134 1829 4877 ---- 305 686 229 30540'±1/32" 16' 27' 45' 4" 50' 9-1/2" 7 ' 6 ' 16 ' 1' 2' 3 " 9" 1'15240±0,8 5893 8230 17272 18529 2134 1829 6096 ---- 305 686 229 30550'±1/32" 19' 4" 27' 56' 8" 60' 9-1/2" 7 ' 6 ' 20 ' 1' 2' 3 " 9" 1'<strong>Booklet</strong> 7 - <strong>Flow</strong> <strong>Measurement</strong> <strong>Methods</strong> <strong>in</strong> <strong>Open</strong> <strong>Channels</strong> Page 39 of 223
It is important to respect standard dimensions precisely if you are us<strong>in</strong>g established empirical tables and toobta<strong>in</strong> accurate measurements.2.1.5. Range of measurementsParshall flumes can measure flows vary<strong>in</strong>g from 70.7 m 3 per day, for a 76 mm (3 <strong>in</strong>) channel, to 8,038,656 m 3per day, for a 15.24 m (50 ft) channel. Table 6 lists the recommended m<strong>in</strong>imum and maximum flowrates for afree-flow Parshall flume for different dimensions. For the purposes of this document, only data that apply tochannels with dimensions between 76 mm (3 <strong>in</strong>) and 36.57 m (12 ft), have been <strong>in</strong>cluded.2.1.6. Discharge equation for free flow conditionsThe discharge equation result<strong>in</strong>g from the depth/flow relationship <strong>in</strong> free flow conditions, is expressed asfollows (7) :Q = KH n (9)where:QHKnis the flowrate, the value of which is a function of the unit of measurement selected(Table 7);is the water depth measured at po<strong>in</strong>t h 1, <strong>in</strong> feet or meters;is the constant, which is a function of the dimension of the constriction andmeasurement unit chosen (Table 7);is the constant of the exponent, the value of which is a function of the dimension of theconstriction, (without unit).Table 7 shows discharge equations for free flow Parshall flumes, for values expressed <strong>in</strong> m 3 per second, <strong>in</strong> m 3per day, <strong>in</strong> ft 3 per second and <strong>in</strong> millions of US gallons per day.Page 40 of 223<strong>Booklet</strong> 7 - <strong>Flow</strong> <strong>Measurement</strong> <strong>Methods</strong> <strong>in</strong> <strong>Open</strong> <strong>Channels</strong>
TABLE 6 - PARSHALL FLUME - RECOMMENDED MINIMUM AND MAXIMUM FLOWS INFREE FLOW CONDITIONSThroat widthmm (<strong>in</strong>)251M<strong>in</strong>imum MINIMUM FLOWRATEdepthmm (<strong>in</strong>) l/s m 3 /d190.750.13 11.2 1847.25Maximum MAXIMUM FLOWRATEdepthmm (<strong>in</strong>) l/s m 3 /d4.38 378.25122510.4 34.3 1847.258.75 756.4763311.250.82 70.7 4571852.56 4541.11526311.251.58 136.2 45718110.6 9557.72299311.252.63 227.5 61024251.3 21 714.130512311.253.49 301.9 76230456.8 39 471.245718311.255.05 436.5 76230695.4 60 081.661024441.7511.3 974.5 76230937.4 80 99591436441.7516.4 1417.2 762301426.9 123 286.5121948642.538.6 3334.7 762301923.6 166 199.4152460642.547.6 4110.2 762302424.4 209 47018297276374.16 6407.2 762302930.7 253 21324389676397.2 8401.7 762303950.8 341 3503048120903.5158.4 13 683.6 1067428278.7 715 28036581441014226.1 19 535.9 13725414522.3 1254 725<strong>Booklet</strong> 7 - <strong>Flow</strong> <strong>Measurement</strong> <strong>Methods</strong> <strong>in</strong> <strong>Open</strong> <strong>Channels</strong> Page 41 of 223
TABLE 7 - PARSHALL FLUME - DISCHARGE EQUATIONS IN FREE FLOW CONDITIONSFlumedimensionsDISCHARGE EQUATIONW m 3 /s (**) m 3 /d (**) ft 3 /s (*) Mgal US /d (*)1" 0.0604 H 1.55 5 215 H 1.55 0.338 H 1.55 0.2185H 1.552" 0.1207 H 1.55 10 430 H 1.55 0.676 H 1.55 0.4369H 1.553" 0.1765 H 1.547 15 250 H 1.547 0.992 H 1.547 0.6412H 1.5476" 0.3812 H 1.58 32 937 H 1.58 2.060 H 1.58 1.3314H 1.589" 0.5354 H 1.53 46 258 H 1.53 3.070 H 1.53 1.9842H 1.531' 0.6909 H 1.522 59 696 H 1.522 4.0 H 1.522 2.5853H 1.52218" 1.0563 H 1.538 91 263 H 1.538 6.0 H 1.538 3.8779H 1.5382' 1.4286 H 1.550 123 432 H 1.550 8.0 H 1.550 5.1706H 1.5503' 2.184 H 1.566 188 701 H 1.566 12.0 H 1.566 7.7559H 1.5664' 2.9539 H 1.578 255 214 H 1.578 16.0 H 1.578 10.341H 1.5785' 3.732 H 1.587 322 448 H 1.587 20.0 H 1.587 12.926H 1.5876' 4.5212 H 1.595 390 632 H 1.595 24.0 H 1.595 15.512H 1.5958' 6.1148 H 1.607 528 322 H 1.607 32.0 H 1.607 20.682H 1.60710' 7.4628 H 1.6 644 782 H 1.6 39.38 H 1.6 25.452H 1.612' 8.8594 H 1.6 756 453 H 1.6 46.75 H 1.6 30.216H 1.615' 10.955 H 1.6 946 542 H 1.6 57.81 H 1.6 37.364H 1.620' 14.45 H 1.6 1 248 466 H 1.6 76.25 H 1.6 49.282H 1.625' 17.944 H 1.6 1 550 391 H 1.6 94.69 H 1.6 61.20H 1.630' 21.439 H 1.6 1 852 315 H 1.6 113.13 H 1.6 73.118H 1.640' 28.426 H 1.6 2 456 000 H 1.6 150 H 1.6 96.948H 1.650' 35.415 H 1.6 3 059 848 H 1.6 186.88 H 1.6 120.785H 1.6(*) H expressed <strong>in</strong> feet(**) H expressed <strong>in</strong> metersPage 42 of 223<strong>Booklet</strong> 7 - <strong>Flow</strong> <strong>Measurement</strong> <strong>Methods</strong> <strong>in</strong> <strong>Open</strong> <strong>Channels</strong>
2.1.7. PrecisionThe marg<strong>in</strong> for error with a Parshall flume is approximately ± 3 %. To generate this degree of precision, it isimportant to carefully comply with all of the recommended dimensions when a flume is manufactured and<strong>in</strong>stalled.2.1.8. Sources of errorThe pr<strong>in</strong>cipal sources of error that reduce a flume’s precision are as follows:−changes to standard dimensions that occur when a flume is manufactured or dur<strong>in</strong>g its <strong>in</strong>stallationdistortion: check all sections of the flume to ensure that it has not been compressed or twisteddur<strong>in</strong>g <strong>in</strong>stallation.throat width: for small flumes, a tolerance of 4 mm (1/64 <strong>in</strong>) compared to a standarddimension, is acceptable. For larger flumes, a deviation of 8 mm (1/32 <strong>in</strong>) is acceptable, (seeTable 5).length of converg<strong>in</strong>g section: this section cannot be reduced, but there appears to be norestriction to extend it. The measur<strong>in</strong>g po<strong>in</strong>t, however, must rema<strong>in</strong> <strong>in</strong> a standard position.horizontal position: if the base of the flume is not level transversely, the average depth must beused to determ<strong>in</strong>e the depth/flow relationship, <strong>in</strong> other words, the depth must be measured oneach side of the flume to determ<strong>in</strong>e the average depth.−<strong>in</strong>correct measur<strong>in</strong>g po<strong>in</strong>t positionfor all sizes of flumes, the measur<strong>in</strong>g po<strong>in</strong>t must be located with<strong>in</strong> the 2/3 portion of theconverg<strong>in</strong>g section, the distance of which must be measured along the wall, from the beg<strong>in</strong>n<strong>in</strong>gof the throat.A2/3 A<strong>Booklet</strong> 7 - <strong>Flow</strong> <strong>Measurement</strong> <strong>Methods</strong> <strong>in</strong> <strong>Open</strong> <strong>Channels</strong> Page 43 of 223
−<strong>in</strong>adequate approachthe converg<strong>in</strong>g section of the flume is too short to adequately correct major distortions of theapproach and distribution velocity. The reader can refer to section 2.1.10 which discusses<strong>in</strong>stallation conditions, for an understand<strong>in</strong>g of rules that regulate the approach.−poor measurement technique <strong>in</strong> submerged flow conditionsoften, due to a lack of knowledge, a user is unaware of how to recognize or gauge a channelthat is operat<strong>in</strong>g <strong>in</strong> submerged flow conditions and takes flow measurements at only onelocation, <strong>in</strong>stead of at both measur<strong>in</strong>g po<strong>in</strong>ts, which this situation requires.−obstructions <strong>in</strong> the throat section of the flume2.1.9. Selection criteriait is important to ensure that noth<strong>in</strong>g is block<strong>in</strong>g flow <strong>in</strong> the throat of the flume, particularly <strong>in</strong>the case of small flumes. Where this occurs, liquid is forced to move over the obstacle, which<strong>in</strong>creases the water level at the measur<strong>in</strong>g po<strong>in</strong>t.As <strong>in</strong>dicated <strong>in</strong> section 1.7 of this document, <strong>in</strong>stallation of a Parshall flume is the preferred type of flumewhere the daily flow is 1,800 m 3 and over.Because there are a number of different Parshall flume dimensions available to measure the range ofanticipated flows, other criteria should be considered when select<strong>in</strong>g a flume, such as:−−−−−−discharge: it is important to select the correct size of flume to ensure that free flow conditions are presentat the maximum discharge, and to consider <strong>in</strong>stallation constra<strong>in</strong>ts;loss of head: for any one flow, the degree to which the water level rises, due to <strong>in</strong>troduc<strong>in</strong>g different sizesof flumes;the sensitivity required to detect and measure fluctuations <strong>in</strong> water level, where there are very littlevariations <strong>in</strong> flow;the desired precision;the overall work that is required to <strong>in</strong>stall flumes of different sizes;the costs associated with <strong>in</strong>stallation of flumes of different sizes.2.1.10. Installation detailsThe Parshall flume must be located <strong>in</strong> a straight section of the flow (8) .When <strong>in</strong>stall<strong>in</strong>g a flume, it is important to ensure that none of the flume’s orig<strong>in</strong>al physical features aredamaged (see Table 5).The crest (DR), which is the bottom of the converg<strong>in</strong>g section of the flume, must be higher than the bottom ofthe channel <strong>in</strong> which it is placed. This elevation must be equal to the difference between the water depth <strong>in</strong> thePage 44 of 223<strong>Booklet</strong> 7 - <strong>Flow</strong> <strong>Measurement</strong> <strong>Methods</strong> <strong>in</strong> <strong>Open</strong> <strong>Channels</strong>
channel at maximum flow (H c ), before the flume is <strong>in</strong>stalled, and the anticipated water depth at the measur<strong>in</strong>gpo<strong>in</strong>t h 2 (DR = H c - h 2 ) dur<strong>in</strong>g m<strong>in</strong>imum submerged flow conditions. The crest of the flume that is <strong>in</strong>troducedmust be connected to the crest of the converg<strong>in</strong>g section by an <strong>in</strong>verted slope section that has a 1:4 ratio(vertical:horizontal) (see Figure 6).The length of the approach section must be equivalent to at least twenty times the diameter of the waterdelivery pipe.In the approach section, the slope should be less than 1 %. It is important to ensure that a steep slope does notproduce a hydraulic jump <strong>in</strong> the converg<strong>in</strong>g section of the flume, as shown <strong>in</strong> Figure 7. It should not create toogreat a velocity, which will slow down the rise <strong>in</strong> water depth <strong>in</strong> the converg<strong>in</strong>g section.The m<strong>in</strong>imum width of the approach channel should be consistent with dimension “D” of Table 2 and themaximum width should not exceed dimension “P” <strong>in</strong> the same table (more than 10 m). It is important to avoid<strong>in</strong>troduc<strong>in</strong>g a water delivery pipe <strong>in</strong>to the converg<strong>in</strong>g section of the flume, as shown <strong>in</strong> Figure 8.At the outlet of the flume, there should be enough slope to allow water to discharge quickly. The slope shouldbe approximately 2 %.After the diverg<strong>in</strong>g section, there should be no pronounced curve that can restrict flow and cause a submergedflow.In the converg<strong>in</strong>g section, the still<strong>in</strong>g well conduit should be located with<strong>in</strong> the middle two-thirds (2/3) sectionof the length of the wall and at a right angle with the wall. The crest of these conduits, that is, their bottom,must be below the level of the crest of the converg<strong>in</strong>g section, as shown <strong>in</strong> Figure 6, and level with the flumewall.<strong>Booklet</strong> 7 - <strong>Flow</strong> <strong>Measurement</strong> <strong>Methods</strong> <strong>in</strong> <strong>Open</strong> <strong>Channels</strong> Page 45 of 223
FIGURE 7 - PARSHALL FLUME – SLOPE OF THE APPROACH SECTIONInstallation of a flume that is lowerthan the approach channelA flume <strong>in</strong> which the slope of theapproach channel is too steepInstallation show<strong>in</strong>g an adequate channel slopePage 46 of 223<strong>Booklet</strong> 7 - <strong>Flow</strong> <strong>Measurement</strong> <strong>Methods</strong> <strong>in</strong> <strong>Open</strong> <strong>Channels</strong>
FIGURE 8 - PARSHALL FLUME – JUNCTION OF APPROACH AND CONVERGINGSECTIONS (SETUP THAT SHOULD BE AVOIDED)Insertion of the delivery pipe <strong>in</strong> theconverg<strong>in</strong>g section<strong>Booklet</strong> 7 - <strong>Flow</strong> <strong>Measurement</strong> <strong>Methods</strong> <strong>in</strong> <strong>Open</strong> <strong>Channels</strong> Page 47 of 223
2.1.11. Submerged flowA submerged flow should be expected as soon as water reaches the crest (floor level) of the converg<strong>in</strong>gsection; but this is not the case. The flow does not deteriorate so long as the h 2 /h 1 ratio, expressed as apercentage, rema<strong>in</strong>s with<strong>in</strong> the follow<strong>in</strong>g values (2) :50 % for 25, 51 and 76 mm (1, 2 and 3 <strong>in</strong>) flumes;60 % for 152 and 229 mm (6 and 9 <strong>in</strong>) flumes;70 % for 305 to 2,438 mm (1 to 8 ft) flumes;80 % for 2,438 to 15,240 mm (8 to 50 ft) flumes.If the water depth downstream (h 2 ) is higher than the crest (floor level) of the converg<strong>in</strong>g section,measurements of the upstream depth (h 1 ) and downstream depth (h 2 ) must be taken. If the h 2 /h 1 ratio exceedsthese modular limits, flow is said to be submerged, and the flow measured is a function of the simultaneousmeasurement of both depths h 1 and h 2 . Because there is currently no commercial <strong>in</strong>strument available that cantake upstream and downstream measurements simultaneously and perform the correspond<strong>in</strong>g calculations, asubmerged flow measurement should be avoided if possible.It has been established that the h 2 /h 1 ratio can reach 67 % to 70 % before there is a significant flowdeterioration. For each additional percentage, the flow reduction will also grow exponentially, as shown <strong>in</strong>Figure 9.When the h 2 /h 1 ratio reaches 100 %, there is no more flow. However, 95 % is considered to be the criticalvalue when the Parshall flume becomes <strong>in</strong>operative, because the difference <strong>in</strong> depth between h 1 and h 2 is som<strong>in</strong>ute, the slightest error <strong>in</strong> depth measurement will result <strong>in</strong> extreme <strong>in</strong>accuracies.Use of this type of submerged flow channel is not recommended when the h 2 /h 1 ratio exceeds 0.95 (seeFigure 10).Page 48 of 223<strong>Booklet</strong> 7 - <strong>Flow</strong> <strong>Measurement</strong> <strong>Methods</strong> <strong>in</strong> <strong>Open</strong> <strong>Channels</strong>
FIGURE 9 - PARSHALL FLUME - EFFECTS OF A SUBMERGED FLOW<strong>Booklet</strong> 7 - <strong>Flow</strong> <strong>Measurement</strong> <strong>Methods</strong> <strong>in</strong> <strong>Open</strong> <strong>Channels</strong> Page 49 of 223
FIGURE 10 - PARSHALL FLUME - H 2 /H 1 RATIOPage 50 of 223<strong>Booklet</strong> 7 - <strong>Flow</strong> <strong>Measurement</strong> <strong>Methods</strong> <strong>in</strong> <strong>Open</strong> <strong>Channels</strong>
2.1.12. Discharge equation <strong>in</strong> a submerged flowFor this type of flow regime, the discharge equation result<strong>in</strong>g from the h 1 - h 2 measurement is expressed asfollows (8) :n1C1(h1− h2)Q =(10)n2(- log h2/ h1)where:Qis the flowrate <strong>in</strong> ft 3 /s;C 1is a constant without a unit;h 1 and h 2 are water level depths <strong>in</strong> feet;n 1 and n 2 are constants without a unit.Table 8 shows values for the exponents and coefficients <strong>in</strong> the above formula.2.1.13. Loss of headBefore <strong>in</strong>stall<strong>in</strong>g a flume, it is important to ensure that the rise <strong>in</strong> water level <strong>in</strong> the dra<strong>in</strong>age system does notcause sewers to back up <strong>in</strong> build<strong>in</strong>g basements. To determ<strong>in</strong>e the rise <strong>in</strong> water level, use the follow<strong>in</strong>gformula:whereRHch 1h 2R c − 1= [( Hh2)+ h + L](11)represents the rise <strong>in</strong> water level <strong>in</strong> feet, <strong>in</strong> the section upstream from the flume;represents the water depth <strong>in</strong> the channel <strong>in</strong> feet, prior to <strong>in</strong>stallation of the flume, atmaximum flow;represents the anticipated water depth <strong>in</strong> feet, at the measur<strong>in</strong>g po<strong>in</strong>t upstream from theflume;represents the anticipated water depth <strong>in</strong> feet, at the measur<strong>in</strong>g po<strong>in</strong>t downstream fromthe flume, <strong>in</strong> submerged flow conditions;L loss of head <strong>in</strong> feet, accord<strong>in</strong>g to Figures 11 and 12.<strong>Booklet</strong> 7 - <strong>Flow</strong> <strong>Measurement</strong> <strong>Methods</strong> <strong>in</strong> <strong>Open</strong> <strong>Channels</strong> Page 51 of 223
TABLE 8 - COEFFICIENTS AND EXPONENTS - PARSHALL FLUME IN SUBMERGEDFLOW CONDITIONSW C 1 n 1 n 2(25 mm) 1″(51 mm) 2″(76 mm) 3″0.2990.6120.9151.551.551.551.0001.0001.000(152 mm) 6″(229 mm) 9″(305 mm) 12″(457 mm) 18″(610 mm) 24″(762 mm) 30″1.662.513.114.425.947.221.581.531.521.541.551.5551.0801.0601.0801.1151.1401.150(914 mm) 3′(1219 mm) 4′(1524 mm) 5′(1829 mm) 6′(2134 mm) 7′(2438 mm) 8′8.6011.1013.5515.8518.1520.401.561.571.581.591.601.601.1601.1851.2051.2301.2501.260(3048 mm) 10′(3658 mm) 12′(4572 mm) 15′(6096 mm) 20′(7620 mm) 25′24.7929.3436.1747.5658.951.591.591.591.591.591.2751.2751.2751.2751.275(9144 mm) 30′(12192 mm) 40′(15240 mm) 50′70.3493.11115.891.591.591.591.2751.2751.275Page 52 of 223<strong>Booklet</strong> 7 - <strong>Flow</strong> <strong>Measurement</strong> <strong>Methods</strong> <strong>in</strong> <strong>Open</strong> <strong>Channels</strong>
FIGURE 11 - LOSS OF HEAD - PARSHALL FLUMES: 1 TO 8 FEET<strong>Booklet</strong> 7 - <strong>Flow</strong> <strong>Measurement</strong> <strong>Methods</strong> <strong>in</strong> <strong>Open</strong> <strong>Channels</strong> Page 53 of 223
FIGURE 12 - LOSS OF HEAD - PARSHALL FLUMES: 10 TO 50 FEETIf data related to losses of head are not available, it is still possible to gauge the rise <strong>in</strong> water level us<strong>in</strong>g thefollow<strong>in</strong>g empirical formula:R c − 21=( Hh)+(1,1* h)(12)The terms R, H C , h 2 and h 1 are def<strong>in</strong>ed <strong>in</strong> Equation 11.Page 54 of 223<strong>Booklet</strong> 7 - <strong>Flow</strong> <strong>Measurement</strong> <strong>Methods</strong> <strong>in</strong> <strong>Open</strong> <strong>Channels</strong>
To monitor the total rise, follow these steps:− measure depth <strong>in</strong> the channel when the flow is at its maximum (H c );− gauge the value of the maximum flow as precisely as possible (Q max );− determ<strong>in</strong>e what the water depth downstream from the throat section will be for the anticipated maximumflow (h 1 );− determ<strong>in</strong>e the size of the flume that can measure the anticipated maximum flow and create the leastpossible submerged flow conditions;− def<strong>in</strong>e the ratio between depths, dur<strong>in</strong>g submerged flow (h 2 /h 1 );− determ<strong>in</strong>e how far above channel bottom the converg<strong>in</strong>g section of the flume will be <strong>in</strong>stalled (H c - h 2 ).When this evaluation is complete, <strong>in</strong>verts <strong>in</strong> build<strong>in</strong>gs and basements should be <strong>in</strong>spected to ensure that thesystem selected does not cause a risk of flood<strong>in</strong>g.2.1.14. Modification of the flumeFor specific applications, some users have made modifications to certa<strong>in</strong> parts of a flume. Modifications areusually made to the diverg<strong>in</strong>g section and do not affect the values obta<strong>in</strong>ed. Modified flumes are generallyused <strong>in</strong> free flow conditions.A version of a modified flume, without a diverg<strong>in</strong>g section, is also used for 76 mm (3 <strong>in</strong>) flumes, as a portableflume and as a temporary measur<strong>in</strong>g device. This flume is used only <strong>in</strong> free flow conditions.Because the use of modified flumes is strongly discouraged, it is not relevant to discuss them <strong>in</strong> detail.2.1.15. CalibrationDue to the size of tanks that are available, use of the volumetric method is usually limited to 305 mm (1 ft orless) flumes.Dur<strong>in</strong>g calibration, the water depth <strong>in</strong> the flume at the measur<strong>in</strong>g po<strong>in</strong>t must not vary more than 4 %,regardless of which method is used.2.2. Palmer-Bowlus FlumeA Palmer-Bowlus flume was designed <strong>in</strong> the 1930s for use as a flume that can be <strong>in</strong>serted <strong>in</strong> an exist<strong>in</strong>gchannel with a slope of less than 2 %.2.2.1. DescriptionThis flume is rounded to create a restriction and produce a greater flow velocity <strong>in</strong> the throat of the flume.<strong>Booklet</strong> 7 - <strong>Flow</strong> <strong>Measurement</strong> <strong>Methods</strong> <strong>in</strong> <strong>Open</strong> <strong>Channels</strong> Page 55 of 223
The Palmer-Bowlus is a Venturi type flume with a uniform throat. The length of the throat is equal to thediameter of the correspond<strong>in</strong>g flume. Different types of restrictions have been developed, but the restrictionmost frequently used is trapezoidal <strong>in</strong> shape. This entire section discusses trapezoidal flumes.Palmer-Bowlus flumes are usually made of prefabricated fiberglass that is re<strong>in</strong>forced with plastic. Althoughrare, these types of flumes are also made of sta<strong>in</strong>less steel.A Palmer-Bowlus flume is manufactured <strong>in</strong> sizes rang<strong>in</strong>g from 102 mm (4 <strong>in</strong>) to 1067 mm (42 <strong>in</strong>). Largerflumes, up to 2438 mm (96 <strong>in</strong>), can be manufactured on special order. Standard dimensions are: 102 (4), 152(6), 203 (8), 254 (10), 305 (12), 381 (15), 457 (18), 533 (21), 610 (24), 686 (27), 762 (30), 914 (36), 1067 (42),1219 (48), 1372 (54) et 1524 (60) mm (<strong>in</strong>) (10) .2.2.2. Operat<strong>in</strong>g pr<strong>in</strong>cipleVertical and lateral restrictions on the flume reduce the flow area, caus<strong>in</strong>g the water level upstream from thethroat section to rise, which is followed by a drop <strong>in</strong> water level <strong>in</strong> the throat section, result<strong>in</strong>g also <strong>in</strong> an<strong>in</strong>creased flow velocity.<strong>Flow</strong>rate can be determ<strong>in</strong>ed simply by measur<strong>in</strong>g water depth upstream from the flume, s<strong>in</strong>ce it has beenestablished that variations <strong>in</strong> depth are proportional to flow.Although this type of flume can be used <strong>in</strong> submerged flow conditions, use <strong>in</strong> free flow conditions isrecommended. In free flow conditions, only one measur<strong>in</strong>g po<strong>in</strong>t is necessary to obta<strong>in</strong> flow measurements,but <strong>in</strong> submerged flow conditions, a water depth measurement downstream from the throat section must alsobe taken.2.2.3. ApplicationsAlthough it is designed to measure flow <strong>in</strong> sewer systems and exist<strong>in</strong>g channels, a Palmer-Bowlus flume is nota temporary device. In fact, the difference <strong>in</strong> measurement between a m<strong>in</strong>imum and maximum flow isrelatively small. Often, if a system is expanded, the size of the flume must also be changed.Like all flumes, a Palmer-Bowlus flume is an effective tool for flow measurement of water that conta<strong>in</strong>s solids.It is also relatively easy to <strong>in</strong>stall because it does not require a crest differential upstream or downstream.Because of their relatively small volume, Palmer-Bowlus flumes that are under 381 mm (15 <strong>in</strong>) <strong>in</strong> diameter canbe <strong>in</strong>serted <strong>in</strong>to a standard sewer manhole, without the need to modify access to the manhole.2.2.4. DimensionsDimensions of a Palmer-Bowlus flume depend on the diameter of the channel <strong>in</strong> which it is <strong>in</strong>stalled.Unlike a Parshall flume, standards govern<strong>in</strong>g the dimensions and configuration of Palmer-Bowlus flumes arenot str<strong>in</strong>gent. It is therefore important to use the flow tables supplied by the manufacturer to obta<strong>in</strong> an accurateflow.Page 56 of 223<strong>Booklet</strong> 7 - <strong>Flow</strong> <strong>Measurement</strong> <strong>Methods</strong> <strong>in</strong> <strong>Open</strong> <strong>Channels</strong>
A Palmer-Bowlus flume, as experimented with by Ludwig, should be designed accord<strong>in</strong>g to dimensionsdetailed <strong>in</strong> Table 9, and should have the shape illustrated <strong>in</strong> Figure 13 (10) . Palmer-Bowlus flumes on theQuébec market are usually manufactured accord<strong>in</strong>g to standards of the company Plasti-Fab Inc. Dimensionsand shape are detailed <strong>in</strong> Table 10 and Figure 14 (9) .2.2.5. Ranges of <strong>Measurement</strong>Palmer-Bowlus flumes (Plasti-Fab Inc.) can measure flows vary<strong>in</strong>g between 2.4 m 3 per day, <strong>in</strong> the case of a102 mm (4 <strong>in</strong>) flume, and 49,200 m 3 per day, <strong>in</strong> the case of a 762 mm (30 <strong>in</strong>) flume.Table 11 shows recommended m<strong>in</strong>imum and maximum flowrates for a Palmer-Bowlus flume <strong>in</strong> free flowconditions. This document conta<strong>in</strong>s data that apply only to flumes measur<strong>in</strong>g 102 mm (4 <strong>in</strong>) to 762 mm (30 <strong>in</strong>)<strong>in</strong> size.2.2.6. Discharge equation <strong>in</strong> free flow conditionsThe discharge equation <strong>in</strong> free flow conditions is expressed <strong>in</strong> the follow<strong>in</strong>g manner (10) :DQ5=123g z (1+ 2.4mz )(1+4 8mz)5/2.3(13)whereQ is the flowrate <strong>in</strong> m 3 or <strong>in</strong> ft 3 /s;D is the diameter of the channel <strong>in</strong> meters or feet;g is the gravitational constant <strong>in</strong> m/s 2 or <strong>in</strong> ft/s 2 ;z is the dc/D ratio;m is the slope of the sides of the flume;dc is the depth of the flow <strong>in</strong> the throat of the flume <strong>in</strong> meters or feet.<strong>Booklet</strong> 7 - <strong>Flow</strong> <strong>Measurement</strong> <strong>Methods</strong> <strong>in</strong> <strong>Open</strong> <strong>Channels</strong> Page 57 of 223
TABLE 9 - PALMER-BOWLUS FLUME - STANDARD DIMENSIONS ACCORDING TOLUDWIGDimensions <strong>in</strong> millimeters (and <strong>in</strong>ches)D B H t D/2 p L102 mm (4") 43 (1.6") 102 (4") 8 (0.3") 51 (2") 23 (9") 125 (4.9")152 mm (6") 64 (2.5") 152 (6") 13 (0.5") 76 (3") 38 (1.5") 229 (9")203 mm (8") 85 (3") 203 (8") 17 (0.6") 102 (4") 46 (1.8") 295 11.6")254 mm (10") 106 (4") 254 (10") 22 (0.8") 127 (5") 61 (2.4") 376 (14.8")305 mm (12") 127 (5") 305 (12") 25 (1") 152 (6") 76 (3") 457 (18")381 mm (15") 159 (6.25") 381 (15") 32 (1.25") 191 (7.5") 95 (3.75") 572 (225")457 mm (18") 191 (7.5") 457 (18") 38 (1.5") 229 (9") 114 (4.5") 686 (27")533 mm (21") 223 (8.75") 533 (21") 45 (1.75") 267 (10.5") 133 (5.25") 800(31.5)610 mm (24") 254 (10") 610 (24") 51 (2") 305 (12") 152 (6") 914 (36")686 mm (27") 275 (11.25") 686 (27") 55 (2.25") 343 (13.5") 172 (6.75") 1029 (40.5")762 mm (30") 318 (12.5") 762 (30") 64 (2.5") 381 (15") 191 (7.5") 1143 (45")914 mm (36") 381 (15") 914 (36") 76 (3") 457 (18") 229 (9") 1372 (54")1067 mm (42") 445 (17.5") 1067 (42") 89 (3.5") 533 (21") 267 (10.5") 1600 (63")1219 mm (48") 508 (20") 1219 (48") 102 (4") 610 (24") 305 (12") 1829 (72")1524 mm (60") 635 (25") 1524 (60") 127 (5") 762 (30") 381 (15") 2286 (90")Where:D is the dimension of the flume;B is the width of the base of the flume (5D/12);H is the height of the flume (=D);t is the height difference between the crest of the flume and the channel bottom (D/12);D/2 is the location of the measur<strong>in</strong>g po<strong>in</strong>t;p is the length of the <strong>in</strong>cl<strong>in</strong>ed section of the base (1 vertical: 3 horizontal);L is the total length of the base of the flume {D + 2(p)}.Page 58 of 223<strong>Booklet</strong> 7 - <strong>Flow</strong> <strong>Measurement</strong> <strong>Methods</strong> <strong>in</strong> <strong>Open</strong> <strong>Channels</strong>
FIGURE 13 - SHAPE OF A PALMER-BOWLUS FLUME ACCORDING TO LUDWIGNote: Refer to Table 9 for a description of letters.<strong>Booklet</strong> 7 - <strong>Flow</strong> <strong>Measurement</strong> <strong>Methods</strong> <strong>in</strong> <strong>Open</strong> <strong>Channels</strong> Page 59 of 223
FIGURE 14 - SHAPE OF A PALMER-BOWLUS FLUME - PLASTI-FAB INC.Note: Refer to Table 10 for a description of letters.Page 60 of 223<strong>Booklet</strong> 7 - <strong>Flow</strong> <strong>Measurement</strong> <strong>Methods</strong> <strong>in</strong> <strong>Open</strong> <strong>Channels</strong>
TABLE 10 - PALMER-BOWLUS FLUME - STANDARD DIMENSIONS ACCORDING TOPLASTI-FAB INC.D B H t D/2 p L m1024 "512 "1024 "170.6 "512 "512 "2038 "251 "1526 "763 "1526 "251 "763 "763 "30512 "401.5 "2038 "1024 "2038 "341.3 "1024 "1024 "40616 "512 "25410 "1275 "25410 "421.6 "1275 "1275 "50820 "642.5 "30512 "1526 "30512 "512 "1526 "1526 "61024 "763 "38115 "1917.5 "38115 "642.5 "1917.5 "1917.5 "76230 "963.75"45718 "2299 "45718 "763 "2299 "2299 "91436 "1144.5 "53321 "26710.5 "53321 "893.5 "26710.5 "26710.5 "106742 "1335.25"61024 "30512 "61024 "1024 "30512 "30512 "121948 "1526 "68627 "34313.5 "68627 "1144.5 "34313.5 "34313.5 "137254 "1726.75"76230 "38115 "76230 "1275 "38115 "38115 "152460 "1917.5 "91436 "45718 "91436 "1526 "45718 "45718 "182972 "2299 "106742 "53321 "106742 "1787 "53321 "53321 "213484 "26710.5"121948 "61024 "121948 "2038 "61024 "61024 "243896 "30512 "152460 "76230 "152460 "25410 "76230 "76230 "3048120 "38115 "where:D is the dimension of the flume;B is the width of the base of the flume (D/2);H is the depth of the flume (= D);t is the height difference between the base of the flume and the channel bottom (D/6);D/2 is the location of the measur<strong>in</strong>g po<strong>in</strong>t;p is the length of the <strong>in</strong>cl<strong>in</strong>ed section of the base (D/2);L is the total length of the base of the flume D + 2(p);m is the distance between the base and sides (D/4).<strong>Booklet</strong> 7 - <strong>Flow</strong> <strong>Measurement</strong> <strong>Methods</strong> <strong>in</strong> <strong>Open</strong> <strong>Channels</strong> Page 61 of 223
TABLE 11 - PALMER-BOWLUS FLUME - RECOMMENDED MINIMUM AND MAXIMUMFLOWRATES IN FREE FLOW CONDITIONSFlumediametermm(<strong>in</strong>)Maximumupstreamslope(%)M<strong>in</strong>imumdepth(mm)MINIMUM FLOWRATEMaximumdepth(mm)MAXIMUM FLOWRATEl/s m 3 /d l/s m 3 /d10241526203825410305123811545718533216102468627762302.2 15 0.2 16 60 2.2 1902.2 33.5 0.98 85 110 8.9 7702 45.7 2.1 181.4 149 18.96 1 6381.8 54.8 3.45 298.1 186 32.8 2 8371.6 67 5.6 483.8 223 51.8 4 4771.5 82.3 9.45 816.5 277 90.1 7 7801.4 100.6 15.53 1 341.8 332 141.8 12 2541.4 115.8 22.08 1 907.7 390 210.7 18 2021.4 134.1 31.72 2 740.6 445 294.5 25 4451.4 149.4 40 3 456 500 390.8 33 7681.4 167.6 55.22 4 771 555 509.9 44 050Note: Values <strong>in</strong> this table are valid for flumes manufactured by Plasti-Fab Inc.Page 62 of 223<strong>Booklet</strong> 7 - <strong>Flow</strong> <strong>Measurement</strong> <strong>Methods</strong> <strong>in</strong> <strong>Open</strong> <strong>Channels</strong>
Because some manufacturers do not always follow all of Ludwig’s requirements, there may be occasionswhere use of this formula to determ<strong>in</strong>e flow <strong>in</strong> a particular flume does not yield satisfactory results. Where thisis the case, we recommend that when purchas<strong>in</strong>g a flume, you request that the manufacturer <strong>in</strong>clude thecalculation formula and the result<strong>in</strong>g table.2.2.7. A flume’s measurement capacityThe maximum measurement capacity for this type of flume is determ<strong>in</strong>ed on the basis of the follow<strong>in</strong>gpr<strong>in</strong>ciples (11) :− water depth (h 1 ) upstream from the flume must not exceed 90 % of the diameter (D) of the conduit: (h 1 =0.9 D);− the flume’s work<strong>in</strong>g depth (h u ) is equal to the allowable depth upstream (h 1 ), m<strong>in</strong>us the depth of theflume’s crest (t): (h 1 - t) (see Figure 14);− the maximum depth measurement (h max ) is equal to the ratio between the flume’s work<strong>in</strong>g depth (h u ) andthe size of the conduit (D): (h u /D). This value is approximately 73 % of the flume’s nom<strong>in</strong>al value.Example2.2.8. PrecisionFor a 762 mm (30 <strong>in</strong>) flume;D = 762 mm (30 <strong>in</strong>);t = 127 mm (5 <strong>in</strong>)(accord<strong>in</strong>g to Table 10);h 1 = 0.9 D, <strong>in</strong> this case: 686 mm (27 <strong>in</strong>);h u = h 1 - t, <strong>in</strong> this case: 686 mm - 127 mm = 559 mm (27 <strong>in</strong> - 5 <strong>in</strong> = 22 <strong>in</strong>);h max = h u /D, <strong>in</strong> this case : 559 mm/762 mm (22 <strong>in</strong>/30 <strong>in</strong>) = 0.733 or 73 %.This type of flume is able to produce values that are as precise as values obta<strong>in</strong>ed with a Parshall flume. Theflow measurement marg<strong>in</strong> of error is approximately ± 3 %.To generate this type of precision, particular attention must be taken when <strong>in</strong>stall<strong>in</strong>g the flume, to avoidproduc<strong>in</strong>g a submerged flow and excessive approach velocity.2.2.9. Sources of errorThe pr<strong>in</strong>cipal sources of error that can affect a flume’s precision are as follows:−changes to standard dimensions at the time of <strong>in</strong>stallationthroat width: dur<strong>in</strong>g <strong>in</strong>stallation, it is important to ensure that the flume is not distorted,compressed or twisted <strong>in</strong> any way, and that it ma<strong>in</strong>ta<strong>in</strong>s its orig<strong>in</strong>al dimensions and shape;<strong>Booklet</strong> 7 - <strong>Flow</strong> <strong>Measurement</strong> <strong>Methods</strong> <strong>in</strong> <strong>Open</strong> <strong>Channels</strong> Page 63 of 223
<strong>in</strong>spection of the horizontal position: if a flume is not transversely level (perpendicular to flow),the average depth should be used to determ<strong>in</strong>e the depth/flow relationship. The depth shouldtherefore be measured on each side of the flume to determ<strong>in</strong>e average depth;longitud<strong>in</strong>al position: the flume may have a slight downstream <strong>in</strong>cl<strong>in</strong>e, 6 mm maximum forsmall flumes {610 mm (24 <strong>in</strong>) and less} and 20 mm maximum for large flumes;flume length: if modifications have to be made to length, they should be made <strong>in</strong> thedownstream portion only, after a thorough assessment of how the precision of measurementswill be affected.−improper measur<strong>in</strong>g po<strong>in</strong>t positionfor all flumes of this type, the measur<strong>in</strong>g po<strong>in</strong>t must be located upstream from the flume, at adistance equal to half the diameter of the flume (D/2), the distance of which is measured fromthe beg<strong>in</strong>n<strong>in</strong>g of the rise between the crest (floor) of the flume and the bottom of the channel(see Figures 13 and 14);the water depth must be measured from the crest of the flume and not from the channel bottom.−sensitivity of water depth measurementbecause variations <strong>in</strong> depth related to flow variations are small, an extremely sensitive devicemust be used to detect the level of liquid.−<strong>in</strong>adequate approachthis type of flume does not have a converg<strong>in</strong>g section that compensates for distortions <strong>in</strong>approach velocities and their distribution. The reader can refer to section 2.2.11 for <strong>in</strong>formationabout <strong>in</strong>stallation conditions to determ<strong>in</strong>e rules that govern approach.−<strong>in</strong>correct submerged flow measurement techniqueOften, due to a lack of knowledge, users do not know how to recognize and assess a flume thatis operat<strong>in</strong>g <strong>in</strong> submerged flow conditions, and take a flow measurement <strong>in</strong> only one location,<strong>in</strong>stead of at the two measur<strong>in</strong>g po<strong>in</strong>ts this situation requires.−obstructions <strong>in</strong> the flume throatit is important to ensure that noth<strong>in</strong>g is block<strong>in</strong>g the flume throat, particularly <strong>in</strong> the case ofsmall flumes, s<strong>in</strong>ce liquid will be forced to move over the obstacle, which <strong>in</strong>creases water depthand distorts the measurement.Page 64 of 223<strong>Booklet</strong> 7 - <strong>Flow</strong> <strong>Measurement</strong> <strong>Methods</strong> <strong>in</strong> <strong>Open</strong> <strong>Channels</strong>
−use of the depth/flow table2.2.10. Selection criteriait is important to ensure that the depth/flow conversion table and flowmeter <strong>in</strong>tegration formulaare identical to the table and formula supplied by the flume manufacturer.Different sizes of Palmer-Bowlus flumes can be used to measure a range of anticipated flows. Many otherfactors should be considered when select<strong>in</strong>g a flume. These factors <strong>in</strong>clude:−−−−discharge: it is important to select the correct size of flume to ensure operation <strong>in</strong> free flow conditions,regardless of flow pattern and system constra<strong>in</strong>ts;the m<strong>in</strong>imum and maximum discharge flows;the sensitivity necessary to detect and measure depth fluctuations even where there is very little change <strong>in</strong>flowrate;the desired precision.2.2.11. Installation specificationsA flume is usually placed directly <strong>in</strong> the channel and secured to the channel bottom. In the case of temporarysetups, flumes are often <strong>in</strong>corporated <strong>in</strong> sand bag dams.If the slope of a channel is too steep, the flume can be lifted slightly to reduce the slope, as long as the diameterof the delivery pipe is large enough to ensure that the water depth upstream from the flume does not exceed therecommended depth, that is, 90 % of the channel depth (11) .When the flume is <strong>in</strong>stalled, it is important to ensure that all of the orig<strong>in</strong>al physical components rema<strong>in</strong>undamaged.The system must allow the water level upstream from the flume to rise. A higher water level must occur farenough upstream, more specifically a distance of at least 10 diameters of the conduit.The length of the approach section must be at least 25 times the diameter of the delivery pipe (12) .The slope of the approach section must be less than 2 % for small flumes, and less than 1 % for flumes762 mm (30 <strong>in</strong>) and over.The flow must be uniform, well distributed and calm at the measur<strong>in</strong>g po<strong>in</strong>t. No surface waves must bepresent.If a flume is smaller than the diameter of the conduit, it must be fitted with a transition section, the length ofwhich should be at least four times the diameter of the conduit <strong>in</strong> which it is <strong>in</strong>serted. The transition sectionmust also be connected to the conduit by a reducer section, where the angle of reduction does not exceed 30° (9) .<strong>Booklet</strong> 7 - <strong>Flow</strong> <strong>Measurement</strong> <strong>Methods</strong> <strong>in</strong> <strong>Open</strong> <strong>Channels</strong> Page 65 of 223
A steep slope <strong>in</strong> the conduit downstream will not affect the precision of measurements. This type of slope,however, is not necessary, although it may help ma<strong>in</strong>ta<strong>in</strong> free flow conditions.After the diverg<strong>in</strong>g section, there should be no sharp bends <strong>in</strong> the conduit that could restrict flow and cause asubmerged flow.2.2.12. Submerged flowA flow is said to be submerged as soon as the water level downstream reaches the measurement threshold.<strong>Flow</strong> can be measured as long as the h 2 (water depth downstream)/h 1 (water depth upstream) ratio is less than85 % (11) .Dur<strong>in</strong>g <strong>in</strong>stallation, all precautions must be taken to prevent submerged flow conditions from occurr<strong>in</strong>g, even ifit means rais<strong>in</strong>g the crest of the flume or <strong>in</strong>creas<strong>in</strong>g the slope of the channel downstream.2.2.13. Loss of headThere is no significant loss of head due to <strong>in</strong>stallation of a Palmer-Bowlus flume. At maximum flow, the waterdepth upstream should not exceed 90 % of the nom<strong>in</strong>al depth of the channel.2.2.14. Flume modificationIf there is not enough room to <strong>in</strong>stall a flume, the flume can be modified to allow it to be <strong>in</strong>serted. Thefollow<strong>in</strong>g modifications can be made to a flume:−−reduce the height of the flume’s diverg<strong>in</strong>g and throat sections by cutt<strong>in</strong>g it at an angle. The flume can becut from the top, <strong>in</strong> l<strong>in</strong>e with the threshold, up to the end of the flume, halfway up (9) ;vertically cut the flume, at any location between the end of the threshold and the end of the flume.If the flow velocity is too strong, it can be reduced by <strong>in</strong>creas<strong>in</strong>g the height of the threshold. To do this, theentire flume must be lifted away from the channel bottom.2.2.15. CalibrationSee section 1.12.13 for calibration.Due to the size of tanks available, use of the volumetric method is generally limited to flumes measur<strong>in</strong>g686 mm (27 <strong>in</strong>) and under.Dur<strong>in</strong>g calibration, the water depth <strong>in</strong> the flume, at the measur<strong>in</strong>g po<strong>in</strong>t, must not vary more than 3.5 %,regardless of which method is used.Page 66 of 223<strong>Booklet</strong> 7 - <strong>Flow</strong> <strong>Measurement</strong> <strong>Methods</strong> <strong>in</strong> <strong>Open</strong> <strong>Channels</strong>
For temporary systems, a simple verification of the follow<strong>in</strong>g conditions is all that is required:−−−−−the longitud<strong>in</strong>al and transversal sections of the flume should be level;the flow velocity upstream from the flume should be less than 0.6 m (2 ft)/second;there should be no waves or turbulence upstream from the flume;free flow conditions must be present;there are no leaks <strong>in</strong> the flume structure.2.3. Leopold-Lagco flumeThe Leopold-Lagco flume was developed <strong>in</strong> the early 1960s and <strong>in</strong>troduced on the market <strong>in</strong> 1965 by F.B.Leopold Company Inc. of Pennsylvania (13) .2.3.1. DescriptionThe Leopold-Lagco flume has a round shape. The purpose of its rounded shape is to create a restriction <strong>in</strong> theconduit, which causes a greater flow velocity <strong>in</strong> the throat of the flume.This flume operates accord<strong>in</strong>g to the Venturi pr<strong>in</strong>ciple. The throat is uniform and its length is equal to thediameter of the channel for which it was designed. Similar to a Palmer-Bowlus flume, its throat section has arectangular shape.It consists of three sections: a converg<strong>in</strong>g section, throat section and diverg<strong>in</strong>g section.As <strong>in</strong> the case of Palmer-Bowlus flumes, the size of Leopold-Lagco flumes is def<strong>in</strong>ed by the diameter of thechannel <strong>in</strong> which it is <strong>in</strong>stalled, not by the <strong>in</strong>side width of the throat section.There are three models:permanent <strong>in</strong>stallation model: there is a slight extension of the converg<strong>in</strong>g and diverg<strong>in</strong>g sections;<strong>in</strong>sertion model: outer radius of the flume corresponds to the <strong>in</strong>ner radius of the channel <strong>in</strong> which it isto be <strong>in</strong>stalled;cutthroat model: the diverg<strong>in</strong>g section is not as high. This flume is used on a temporary basis only.The <strong>in</strong>ner surface of the flume must be made of material that is smooth and free of irregular edges. The outersurface is made of a material that facilitates adhesion to a concrete surface.The flume is made of fiberglass <strong>in</strong> standard sizes vary<strong>in</strong>g between 152 mm (6 <strong>in</strong>) and 1219 mm (48 <strong>in</strong>). Largerflumes, up to 1829 mm (72 <strong>in</strong>), can be manufactured on special order. Standard sizes <strong>in</strong> millimeters and <strong>in</strong>chesare as follows: 152 (6), 203 (8), 254 (10), 305 (12), 381 (15), 457 (18), 533 (21), 610 (24), 762 (30), 914 (36),1067 (42), and 1219 mm (48 <strong>in</strong>) (14) .<strong>Booklet</strong> 7 - <strong>Flow</strong> <strong>Measurement</strong> <strong>Methods</strong> <strong>in</strong> <strong>Open</strong> <strong>Channels</strong> Page 67 of 223
2.3.2. Operat<strong>in</strong>g pr<strong>in</strong>cipleDue to vertical and lateral restrictions, a Leopold-Lagco reduces the flow area, caus<strong>in</strong>g the water levelupstream from the throat section to rise, followed by a drop <strong>in</strong> water level and an <strong>in</strong>creased flow velocity.<strong>Flow</strong> can be determ<strong>in</strong>ed by simply measur<strong>in</strong>g the water level upstream from the flume, s<strong>in</strong>ce it has beenestablished that depth varies accord<strong>in</strong>g to flow.Literature provides no <strong>in</strong>formation about use of this flume <strong>in</strong> submerged flow conditions and no correctionformula. Use <strong>in</strong> only free flow conditions is therefore recommended.2.3.3. ApplicationsA Leopold-Lagco flume is used as a ma<strong>in</strong> measur<strong>in</strong>g device on a temporary or permanent basis. Like allflumes, it is an effective tool for measur<strong>in</strong>g the flow of water that conta<strong>in</strong>s solids.Due to their relatively small volume, flumes with a diameter of 381 mm (15 <strong>in</strong>) or less can be <strong>in</strong>serted <strong>in</strong> astandard sewer manhole, without the need to modify access. It is relatively easy to <strong>in</strong>stall because there is noneed for a required distance from the bottom of the channel <strong>in</strong> which it is <strong>in</strong>serted.2.3.4. DimensionsThe dimensions of a Leopold-Lagco flume are a function of the diameter of the conduit <strong>in</strong> which it is <strong>in</strong>stalled.Like a Parshall flume, standards govern<strong>in</strong>g dimensions and configuration of the flume are very strict.Depend<strong>in</strong>g on the manufacturer, a flume should be manufactured accord<strong>in</strong>g to the dimensions and shapeshown <strong>in</strong> Table 12 and Figure 15.2.3.5. Range of measurementsLeopold-Lagco flumes can measure flows vary<strong>in</strong>g between 84.2 m 3 per day, for a 152 mm (6 <strong>in</strong>) flume, and108,445 m 3 per day, for a 1219 mm (48 <strong>in</strong>) flume.Table 13 shows the m<strong>in</strong>imum and maximum measurable flows <strong>in</strong> free flow conditions for this type of flume.For purposes of this document, only data that apply to 152 mm (6 <strong>in</strong>) and 1219 mm (48 <strong>in</strong>) flumes areshown (14) .2.3.6. Discharge equation <strong>in</strong> free flow conditionsThe discharge equation result<strong>in</strong>g from the depth/flow relationship associated with free flow conditions isexpressed as follows:where:nQ = KH(14)Page 68 of 223<strong>Booklet</strong> 7 - <strong>Flow</strong> <strong>Measurement</strong> <strong>Methods</strong> <strong>in</strong> <strong>Open</strong> <strong>Channels</strong>
Q is the flowrate <strong>in</strong> liters or US gallons per second;K is the constant based on flume size;H is the water depth measured at po<strong>in</strong>t h 1 <strong>in</strong> meters or feet;n is the exponent constant (1.547).Table 13 shows the values of the constant “K” for the above formula.<strong>Booklet</strong> 7 - <strong>Flow</strong> <strong>Measurement</strong> <strong>Methods</strong> <strong>in</strong> <strong>Open</strong> <strong>Channels</strong> Page 69 of 223
TABLE 12 - LEOPOLD-LAGCO FLUME - STANDARD DIMENSIONS ACCORDING TO F.B.LEOPOLD COMPANY INC.Note: measurements <strong>in</strong> millimeters and <strong>in</strong>chesD B H t D/2 P L A E152 (6) 102 (4) 152 (6) 25 (1) 76 (3) 76 (3) 305 (12) 51 (2) 406 (16)203 (8) 136 (5.3) 203 (8) 34 (1.3) 102(4) 102(4) 406 (16) 51 (2) 508 (20)254 (10) 169 (6.7) 254 (10) 42 (1.7) 127 (5) 127 (5) 508 (20) 51 (2) 610 (24)305 (12) 203 (8) 305 (12) 51 (2) 152 (6) 152 (6) 610 (24) 51 (2) 711 (28)381 (15) 254 (10 381 (15) 64 (2.5) 191 (7.5) 191 (7.5) 762 (30) 51 (2) 864 (34)457 (18) 305 (12) 457 (18) 76 (3) 229 (9) 229 (9) 914 (36) 51 (2) 1016 (40)533 (21) 356 (14) 533 (21) 89 (3.5) 267 (10.5) 267 (10.5) 1067 (42) 51 (2) 1168 (46)610 (24) 406 (16) 610 (24) 102 (4) 305 (12) 305 (12) 1219 (48) 152 (6) 1524 (60)762 (30) 508 (20) 762 (30) 127 (5) 381 (15) 381 (15) 1524 (60) 152 (6) 2134 (84)914 (36) 610 (24) 914 (36) 152 (6) 457 (18) 457 (18) 1829 (72) 152 (6) 2438 (96)1067 (42) 711 (28) 1067 (42) 178 (7) 533 (21) 533 (21) 2134 (84) 152 (6) 2743 (108)1219 (48) 813 (32) 1219 (48) 203 (8) 610 (24) 610 (24) 2438 (96) 152 (6) 3048 (120)1524 (60) 1016 (40) 1524 (60) 254 (10) 762 (30) 762 (30) 3048 (120) 152 (6) 3353 (132)1676 (66) 1118 (44) 1676 (66) 279 (11) 838 (33) 838 (33) 3353 (132) 152 (6) 3658 (144)1829 (72) 1219 (48) 1829 (72) 305 (12) 914 (36) 914 (36) 3658 (144) 152 (6) 3962 (156)where:D is the dimension of the flume that is equal to the nom<strong>in</strong>al size of the channel;B is the width of the flume throat (2/3D);H is the height of the flume (=D);t is the height difference between the base of the flume and the channel bottom (D/6);D/2 is the position of the measur<strong>in</strong>g po<strong>in</strong>t;P is the length of the <strong>in</strong>cl<strong>in</strong>ed section of the base (D/2);L is the total length of the base of the flume (2D)A is the extension of the structureE is the total length of the structure.Page 70 of 223<strong>Booklet</strong> 7 - <strong>Flow</strong> <strong>Measurement</strong> <strong>Methods</strong> <strong>in</strong> <strong>Open</strong> <strong>Channels</strong>
FIGURE 15 - SHAPE OF LEOPOLD-LAGCO FLUME - F.B. LEOPOLD COMPANY INC.Note: See Table 12 for a description of letters.<strong>Booklet</strong> 7 - <strong>Flow</strong> <strong>Measurement</strong> <strong>Methods</strong> <strong>in</strong> <strong>Open</strong> <strong>Channels</strong> Page 71 of 223
TABLE 13 - LEOPOLD-LAGCO FLUME - RECOMMENDED MINIMUM AND MAXIMUMFLOWRATES IN FREE FLOW CONDITIONSFlumediametermm(<strong>in</strong>)KConstant<strong>Flow</strong>l/sgal US /sM<strong>in</strong>imumdepthmmftl/sgal US /sMINIMUMFLOWRATEm 3 /dMgal US /dMaximumdepthmmftl/sgal US /sMAXIMUMFLOWRATEm 3 /dMgal US /d152(6)221.259.298300.10.9990.26486.330.0231070.356.9391.833599.570.158203(8)291.0212.238400.131.970.521170.40.0451370.4513.463.5581 163.40.307254(10)36015.132500.163.50.889302.10.0771820.625.86.8662 229.20.593305(12)420.00418.005600.25.521.493476.50.1292130.739.2510.373 391.60.896381(15)529.822.269760.259.872.608853.10.2252740.971.618.926 188.81.635457(18)630.3226.46900.315.1904.1141 313.10.3553201.05108.1728.5749 3462.469533(21)730.07430.6921060.3522.676.0491 907.70.5233811.25164.0843.34714 1773.745610(24)829.1534.8591220.4328.4472 762.50.734261.4221.558.66519 1365.069762(30)1 025.6343.1181520.555.85614.7564 825.91.2755331.75387.92102.4833 5168.854914(36)1 220.2451.3011520.566.4517.5575 741.61.5176402.1611.91161.66152 86913.9671067(42)1 413.3559.4181980.65115.50430.5149979.5642.6367462.45898.21237.66277 60520.5341219(48)1 605.1567.4821980.65131.17934.65511 333.82.9948532.81 256.15331.851108 53128.672Note: The values shown <strong>in</strong> this table are valid for flumes manufactured by F.B. Leopold Company Inc.Page 72 of 223<strong>Booklet</strong> 7 - <strong>Flow</strong> <strong>Measurement</strong> <strong>Methods</strong> <strong>in</strong> <strong>Open</strong> <strong>Channels</strong>
2.3.7. <strong>Measurement</strong> capacity of a flumeThe maximum measurement capacity (Q max ) for this type of flume arises from the allowable maximum depth(h max ) measurement, which is approximately 70 % of the nom<strong>in</strong>al size of the flume (D).Therefore, for a flume with a nom<strong>in</strong>al size of 457 mm (18 <strong>in</strong>), the allowable maximum depth is 320 mm(12.6 <strong>in</strong>).2.3.8. PrecisionThe precision of flow measurement is comparable to that obta<strong>in</strong>ed with other types of flumes. Accord<strong>in</strong>g to themanufacturer, this flume creates such a high water level at the measur<strong>in</strong>g po<strong>in</strong>t that the error associated withthe evaluation of flow is approximately 2 %, so long as the flume has been <strong>in</strong>stalled <strong>in</strong> compliance withspecific physical requirements (15) .For practical purposes, flow measurement is performed with a marg<strong>in</strong> of error of ± 5 % of the actual value.2.3.9. Sources of errorThe pr<strong>in</strong>cipal sources of error that can reduce a flume’s precision are as follows:−modifications of standard dimensions dur<strong>in</strong>g <strong>in</strong>stallationthroat width: it is important to ensure that the flume is not distorted, compressed or twisteddur<strong>in</strong>g <strong>in</strong>stallation, and that it ma<strong>in</strong>ta<strong>in</strong>s its orig<strong>in</strong>al dimensions and shape.<strong>in</strong>spection of the horizontal: if a flume is not transversely level (perpendicular to flow), waterdepth should be measured on each side of the flume to determ<strong>in</strong>e the average depth and thedepth/flow relationship.longitud<strong>in</strong>al position: the flume may have a slight downstream <strong>in</strong>cl<strong>in</strong>e, 6 mm maximum for smallflumes {610 mm (24 <strong>in</strong>) and less} and 20 mm maximum for large flumes.flume length: if modifications have to be made <strong>in</strong> the direction of length, they should be made <strong>in</strong>the downstream section only, after a thorough evaluation of effects on the precision ofmeasurement.−<strong>in</strong>correct measur<strong>in</strong>g po<strong>in</strong>t positionfor all flumes of this type, the measur<strong>in</strong>g po<strong>in</strong>t must be located upstream from the flume, at adistance equal to half the diameter of the flume (D/2), the distance of which is measured from thebeg<strong>in</strong>n<strong>in</strong>g of the rise between the crest (floor) of the flume and the channel bottom.water depth must be measured from the crest of the flume and not from the channel bottom.<strong>Booklet</strong> 7 - <strong>Flow</strong> <strong>Measurement</strong> <strong>Methods</strong> <strong>in</strong> <strong>Open</strong> <strong>Channels</strong> Page 73 of 223
−sensitivity of water depth measurementbecause the variations <strong>in</strong> depth related to fluctuations <strong>in</strong> flow are small, an extremely sensitivedevice must be <strong>in</strong>troduced to detect the level of liquid.−<strong>in</strong>adequate approachthis type of flume does not have a converg<strong>in</strong>g section that allows distortions <strong>in</strong> approachvelocities and distribution to be corrected (the reader can refer to section 2.3.11, which discusses<strong>in</strong>stallation conditions to f<strong>in</strong>d out about rules that regulate approach).−<strong>in</strong>correct submerged flow measurement techniqueoften, due to a lack of knowledge, users do not know how to recognize and assess a flume that isoperat<strong>in</strong>g <strong>in</strong> submerged flow conditions, and take a flow measurement without tak<strong>in</strong>g submergedflow conditions <strong>in</strong>to account.−obstructions <strong>in</strong> the flume throatit is important to ensure that noth<strong>in</strong>g is block<strong>in</strong>g the flume throat and causes an <strong>in</strong>correct waterdepth measurement, due to the flow mov<strong>in</strong>g over the obstacle (particularly <strong>in</strong> the case of smallflumes).−use of the depth/flow tableit is important to ensure that the depth/flow conversion table and flowmeter <strong>in</strong>tegration formulaare identical to those provided by the flume supplier. The recommended maximum depthmeasurement should also never be exceeded.2.3.10. Selection criteriaAlthough <strong>in</strong>stallation of a Parshall flume is recommended for a permanent measurement site, use of a Leopold-Lagco flume may be adequate.S<strong>in</strong>ce a number of different models of Leopold-Lagco flumes are often available for measurement of the rangeof flows anticipated, other factors should be considered when select<strong>in</strong>g a flume. These factors <strong>in</strong>clude:−−−−−flow: it is important to select the correct size of flume to ensure operation <strong>in</strong> free flow conditions,regardless of flow pattern and <strong>in</strong>stallation constra<strong>in</strong>ts;the diameter of the conduit;m<strong>in</strong>imum and maximum flows to measure;the sensitivity necessary to detect and measure depth fluctuations even where there is very little variation<strong>in</strong> flow;the desired precision.Page 74 of 223<strong>Booklet</strong> 7 - <strong>Flow</strong> <strong>Measurement</strong> <strong>Methods</strong> <strong>in</strong> <strong>Open</strong> <strong>Channels</strong>
2.3.11. Installation specificationsA Leopold-Lagco flume is <strong>in</strong>stalled directly <strong>in</strong> a sewer channel and secured to the channel bottom, usually <strong>in</strong>the straight flow section, <strong>in</strong> an observation well.It should be <strong>in</strong>stalled <strong>in</strong> a conduit <strong>in</strong> which the slope of the approach section is less than 2 %, <strong>in</strong> the case ofsmall flumes, and less than 1 % for flumes 762 mm (30 <strong>in</strong>) and over. If the slope of the conduit is too steep, theflume can be lifted slightly to reduce the slope.When the flume is <strong>in</strong>stalled, it is important to ensure that all of the orig<strong>in</strong>al physical components rema<strong>in</strong>undamaged.Installation must enable the water level upstream from the flume to <strong>in</strong>crease. This higher water level mustoccur far enough upstream, more specifically at least 10 diameters of the conduit.The length of the approach section must be at least 25 times the diameter of the delivery pipe.The flow must be uniform, well distributed and calm at the measur<strong>in</strong>g po<strong>in</strong>t. No surface waves must bepresent.If a flume is smaller than the diameter of the conduit, it must be fitted with a transition section, the length ofwhich should be at least four times the diameter of the conduit <strong>in</strong> which it is <strong>in</strong>stalled. The transition sectionmust also be connected to the conduit by a reducer section, where the angle of reduction does not exceed 30°.A steep slope <strong>in</strong> the conduit downstream will not affect the precision of measurements. This type of slope,however, is not necessary, although it may help ma<strong>in</strong>ta<strong>in</strong> free flow conditions.After the diverg<strong>in</strong>g section, there should be no sharp bends <strong>in</strong> the conduit that could restrict flow and cause asubmerged flow.2.3.12. Submerged flowA flow is said to be submerged as soon as the water level downstream reaches the measurement threshold.<strong>Measurement</strong> <strong>in</strong> submerged flow conditions must be avoided. Dur<strong>in</strong>g <strong>in</strong>stallation, all precautions must be takento prevent submerged flow conditions from occurr<strong>in</strong>g, even if it means rais<strong>in</strong>g the crest of the flume or<strong>in</strong>creas<strong>in</strong>g the slope of the channel downstream.2.3.13. Loss of headA Leopold-Lagco flume creates very little loss of head. For a flume that has a nom<strong>in</strong>al dimension thatcorresponds to that of the conduit <strong>in</strong> which it is <strong>in</strong>stalled, the water depth upstream must not exceed 90 % ofthe nom<strong>in</strong>al height of the conduit, at maximum flow.<strong>Booklet</strong> 7 - <strong>Flow</strong> <strong>Measurement</strong> <strong>Methods</strong> <strong>in</strong> <strong>Open</strong> <strong>Channels</strong> Page 75 of 223
2.3.14. Flume modificationsIf there is not enough room to <strong>in</strong>stall a flume, the flume can be modified to allow it to be <strong>in</strong>serted. Thefollow<strong>in</strong>g modifications can be made to a flume:−−reduce the height of the flume’s diverg<strong>in</strong>g and throat sections by cutt<strong>in</strong>g it at an angle. The flume can becut from the top, <strong>in</strong> l<strong>in</strong>e with the threshold, up to the end of the flume, halfway up;vertically cut the flume, at any location between the end of the threshold and the end of the flume.2.3.15. CalibrationSee section 1.12.13 for calibration.Due to the size of tanks available, use of the volumetric method is generally limited to flumes measur<strong>in</strong>g762 mm (30 <strong>in</strong>ches) and under.Dur<strong>in</strong>g calibration, the water depth <strong>in</strong> the flume, at the measur<strong>in</strong>g po<strong>in</strong>t, must not vary more than 3.5 %,regardless of which method is used.For temporary systems, a simple verification of the follow<strong>in</strong>g conditions is all that is required:−−−−−the longitud<strong>in</strong>al and transversal sections of the flume should be level;the flow velocity upstream from the flume should be less than 0.6 m (2 ft)/second;there should be no waves or turbulence upstream from the flume;free flow conditions must be present;there are no leaks <strong>in</strong> the flume structure.2.4. Cutthroat flumeA cutthroat flume was developed <strong>in</strong> the mid-1960s by Utah State University Water Resources Laboratory. It isused to measure flow <strong>in</strong> locations where there is no slope or very little slope (4) .2.4.1. DescriptionA cutthroat flume consists of a converg<strong>in</strong>g section and diverg<strong>in</strong>g section. The control section (W) does nothave parallel sides because the flume consists only of a converg<strong>in</strong>g and diverg<strong>in</strong>g section. The bottom of theentire length of the flume is flat (16) .For flumes that are less than 1.37 m (4.5 ft) long (L) and 15.2 cm (0.5 ft) wide <strong>in</strong> the control section (W), the<strong>in</strong>let of the converg<strong>in</strong>g section may be rounded. For larger flumes, the <strong>in</strong>let of the converg<strong>in</strong>g section may havevertical walls at a 30° angle (16) .To prevent erosion due to water fall, the diverg<strong>in</strong>g section is usually extended by means of vertical walls, andthe angle of these walls is steeper than the angle of the walls <strong>in</strong> the diverg<strong>in</strong>g section.Page 76 of 223<strong>Booklet</strong> 7 - <strong>Flow</strong> <strong>Measurement</strong> <strong>Methods</strong> <strong>in</strong> <strong>Open</strong> <strong>Channels</strong>
2.4.2. Operat<strong>in</strong>g pr<strong>in</strong>cipleCutthroat flumes operate accord<strong>in</strong>g to the Venturi pr<strong>in</strong>ciple. Due to the lateral shape of its walls, the flumerestricts the flow area, which causes the water level upstream from the control section to rise, followed by asudden and significant drop of the water level <strong>in</strong> the control section, accompanied by an <strong>in</strong>crease <strong>in</strong> flowvelocity. The flow can be determ<strong>in</strong>ed by simply measur<strong>in</strong>g the water depth, because depth variesproportionally with flow.Although this flume can be used <strong>in</strong> submerged flows, use <strong>in</strong> free flow conditions is strongly recommended. Infree flow, a flow measurement can be obta<strong>in</strong>ed us<strong>in</strong>g only one measur<strong>in</strong>g po<strong>in</strong>t, but <strong>in</strong> submerged flowconditions, the depth downstream from the control section must also be measured (6) (16) .2.4.3. ApplicationsThe cutthroat flume was developed to measure flow <strong>in</strong> open natural channels, such as rivers, streams, dra<strong>in</strong>ageditches, etc. with a small slope. It has been the subject of several studies that demonstrate its effectiveness as ameasur<strong>in</strong>g device <strong>in</strong> sewer systems and water treatment plants (17) .The geometry and operat<strong>in</strong>g pr<strong>in</strong>ciple of a cutthroat flume make it an effective device for measur<strong>in</strong>g flow <strong>in</strong>water that conta<strong>in</strong>s solids. Because this flume causes only a small loss of head and requires no difference <strong>in</strong>height between the bottom of the channel and base of the flume, it is relatively easy to adapt to exist<strong>in</strong>g sewersystems.A cutthroat flume is simple and <strong>in</strong>expensive to manufacture. It is also perfectly suited to a temporarymeasurement system.2.4.4. DimensionsThe dimension of a cutthroat flume is def<strong>in</strong>ed by the total length of the flume (L) and the width of the controlsection (constriction) (W).Figure 16 shows the physical characteristics of a cutthroat flume and Table 14, the exact dimensions this flumeshould have.<strong>Booklet</strong> 7 - <strong>Flow</strong> <strong>Measurement</strong> <strong>Methods</strong> <strong>in</strong> <strong>Open</strong> <strong>Channels</strong> Page 77 of 223
FIGURE 16 - CUTTHROAT FLUME - PHYSICAL CHARACTERISTICSPage 78 of 223<strong>Booklet</strong> 7 - <strong>Flow</strong> <strong>Measurement</strong> <strong>Methods</strong> <strong>in</strong> <strong>Open</strong> <strong>Channels</strong>
TABLE 14 - CUTTHROAT FLUME – STANDARD DIMENSIONSDimensions <strong>in</strong> millimeters and feetL W L 1 L 2 B H h1 h21829 ± 0.86' ± 1/32"24388’27439’13724.5'9143’4571.5’1219 ±0.84'± 1/32"610 ± 0.82'± 1/32"305 ± 0.81' ± 1/32"610 ± 0.82' ± 1/32"305 ± 0.81' ± 1/32"152 ± 0.40.5' ± 1/64"76 ± 0.40.25'± 1/64"406 ±0.81.33' ±1/32"203 ±0.80.67'± 1/32"102 ± 0.40.33' ±1/64"51 ± 0.40.17' ± 1/64"203 ±0.80.67'± 1/32"102 ± 0.40.33'±1/64"51 ± 0.40.17'± 1/64"25 ± 0.40.083'±1/64"9143’4571.5’3051’1520.5’18296’9143’6102’3051’18296’12194’9143’9143’6102’4571.5’3811.25’6102’4061.33’3051’2540.834’3051’2030.667’1520.5’1270.416’9143’4571.5’3051’1520.5’6102’3051’2030.667’1020.33’15245’7622.5’5081.667’2540.83’L: is the total length of the flumeL1: is equal to L/3L2: is equal to 2L/3B: is equal to W +L/4.5H: is equal to L/3h1: is equal to 2L/9h2: is equal to 5L/9<strong>Booklet</strong> 7 - <strong>Flow</strong> <strong>Measurement</strong> <strong>Methods</strong> <strong>in</strong> <strong>Open</strong> <strong>Channels</strong> Page 79 of 223
2.4.5. Range of measurementsCutthroat flumes can measure flows vary<strong>in</strong>g between 32 m 3 per day, for a flume 457 mm (1.5 ft) long with aconstriction of 25 mm (0.083 ft), and 210,555 m 3 per day, for a flume 2,743 mm (9 ft) long with a constrictionof 1,829 mm (6 ft).Table 15 shows recommended m<strong>in</strong>imum and maximum flowrates <strong>in</strong> free flow conditions. The data <strong>in</strong> Table 15applies to flumes with a constriction between 25 mm (0.083 ft) and 1,829 mm (6 ft) and a length vary<strong>in</strong>gbetween 457 mm (1.5 ft) and 2,743 mm (9 ft).2.4.6. Discharge equation <strong>in</strong> free flow conditionsThe discharge equation result<strong>in</strong>g from the depth/flow relationship <strong>in</strong> free flow conditions is expressed asfollows (16) :n1Q= Ch 1(15)where:Q is the flowrate <strong>in</strong> cubic meters or cubic feet per second;C is KW 1.025 ;K is the constant accord<strong>in</strong>g to the length of the flume and unit of measurement;W is the dimension of the constriction <strong>in</strong> meters or feet;h 1 is the water depth measured upstream from the constriction (W) <strong>in</strong> meters or feet;n 1 is the exponent constant accord<strong>in</strong>g to the length of the flume (16) .Page 80 of 223<strong>Booklet</strong> 7 - <strong>Flow</strong> <strong>Measurement</strong> <strong>Methods</strong> <strong>in</strong> <strong>Open</strong> <strong>Channels</strong>
TABLE 15 - CUTTHROAT FLUME - RECOMMENDED MINIMUM AND MAXIMUMFLOWRATES FREE FLOW CONDITIONSFlume dimensions<strong>in</strong> mm and feetL27439'13724.5'9143'4571,5'W18296'12194'6102'3051'6102'3051'1520.5'760.25'4061.33'2030.67'1020.33'510.17'2030.67'1020.33'510.17'250.083'M<strong>in</strong>imumdepthmm (ft)1830.6’910.3'610.2’300.1'MINIMUM FLOWRATEl/s m 3 /dMaximumdepthmm (ft)MAXIMUMFLOWRATEl/s m 3 /d280.13 24 219 2 437 210 555184.99 15 983 732 1 608 138 95490.91 7 855 790 68 2842.4’44.67 3 859388 48 29735.06 9143'305 26 33317.23 610 457 150 12 9412’8.47 45774 6 3591.5' 1.5'4.16 38136 3 1251.25'13.9 1 200 120.8 10 4366.8 590 305 59.4 5 1323.4 289 29.15 2 5191’1.65 14314.4 1 2423.14 271 27.3 2 3601.54 129 152 13.4 1 1580.76 66 6.61 5710.5'0.37 323.23 279<strong>Booklet</strong> 7 - <strong>Flow</strong> <strong>Measurement</strong> <strong>Methods</strong> <strong>in</strong> <strong>Open</strong> <strong>Channels</strong> Page 81 of 223
Table 16 shows the values of coefficients C and K for flow measurement <strong>in</strong> free flow conditions, accord<strong>in</strong>g tothe imperial system and metric system. Table 17 shows discharge equations for cutthroat flumes, <strong>in</strong> free flow,for values expressed <strong>in</strong> ft 3 per second and <strong>in</strong> millions of gallons US per day. Table 18 shows equations forvalues expressed <strong>in</strong> m 3 per second and <strong>in</strong> m 3 per day.2.4.7. PrecisionIn free flow conditions, a cutthroat flume produces a precision of measurements similar to that of other flumes,so long as manufactur<strong>in</strong>g and use criteria have been met. In submerged flow conditions, the standardmeasurement method (measurement at only one po<strong>in</strong>t) cont<strong>in</strong>ues to be accurate until the h 2 /h 1 ratio reaches85 % (17) .2.4.8. Sources of errorThe pr<strong>in</strong>ciple sources of error, which reduce the precision of the flume are as follows:−modification of standard dimensions when the channel is manufactured or dur<strong>in</strong>g <strong>in</strong>stallationthroat width: for small flumes, a difference of only 4 mm (1/64 <strong>in</strong>), compared to the standarddimension, is tolerated. For larger flumes, an acceptable deviation is 8 mm (1/32 <strong>in</strong>) (seeTable 14);length of the converg<strong>in</strong>g section: this section cannot be reduced, but noth<strong>in</strong>g prevents it frombe<strong>in</strong>g extended. The measur<strong>in</strong>g po<strong>in</strong>t, however, must rema<strong>in</strong> <strong>in</strong> the standard position.Page 82 of 223<strong>Booklet</strong> 7 - <strong>Flow</strong> <strong>Measurement</strong> <strong>Methods</strong> <strong>in</strong> <strong>Open</strong> <strong>Channels</strong>
TABLE 16 - CUTTHROAT FLUME - VALUES OF COEFFICIENTS C AND K IN FREE FLOWCONDITIONSFlume dimensions<strong>in</strong> mm and feetImperial systemMetric systemn 1L W C K C K1829 22 3.9666'2743 1219 14.49 2.1644'2.137 1.569'610 7.11 3.52'1.2873051'3.50.631610 8.01 1.4622'1372 305 3.98 0.7171'3.982.431 1.724.5'152 1.96 0.3530.5'760.25'0.960.173406 6.04 1.0911.33'914 203 2.97 0.5360.67'4.52.749 1.843'102 1.459 0.2620.33'510.17'0.7190.128203 4.03 0.7270.67'457 102 1.975 0.3550.33'6.13.725 2.151.5'51 0.974 0.1730.17'250.083'0.4940.085<strong>Booklet</strong> 7 - <strong>Flow</strong> <strong>Measurement</strong> <strong>Methods</strong> <strong>in</strong> <strong>Open</strong> <strong>Channels</strong> Page 83 of 223
TABLE 17 - CUTTHROAT FLUME - DISCHARGE EQUATIONS IN FREE FLOWCONDITIONS (IMPERIAL SYSTEM)FLUME DIMENSION<strong>in</strong> feetDISCHARGE EQUATIONL W H ft 3 /s Mgal US /d6'9'4.5'3'1.5'4'2'1'2'1'0.5'0.25'1.333'0.667'0.333'0.167'0.667'0.333'0.167'0.083'3' 3.5(W) 1.025 (H) 1.56 2.262(W) 1.025 (H) 1.561.5' 3.98(W) 1.025 (H) 1.72 2.572(W) 1.025 (H) 1.721' 4.5(W) 1.025 (H) 1.84 2.908(W) 1.025 (H) 1.840.5' 6.1(W) 1.025 (H) 2.15 3.942(W) 1.025 (H) 2.15Page 84 of 223<strong>Booklet</strong> 7 - <strong>Flow</strong> <strong>Measurement</strong> <strong>Methods</strong> <strong>in</strong> <strong>Open</strong> <strong>Channels</strong>
TABLE 18 - CUTTHROAT FLUME - DISCHARGE EQUATIONS IN FREE FLOWCONDITIONS (METRIC SYSTEM)FLUME DIMENSION<strong>in</strong> metersDISCHARGE EQUATIONL W H m 3 /s M 3 /d1.8282.7431.3710.9140.4571.2190.6090.3040.6090.3040.1520.0760.4060.2030.1010.0500.2030.1010.0500.0250.914 2.137(W) 1.025 (H) 1.56 184637(W) 1.025 (H) 1.560.457 2.431(W) 1.025 (H) 1.72 210038(W) 1.025 (H) 1.720.305 2.749(W) 1.025 (H) 1.84 237514(W) 1.025 (H) 1.840.152 3.725(W) 1.025 (H) 2.15 321840(W) 1.025 (H) 2.15<strong>Booklet</strong> 7 - <strong>Flow</strong> <strong>Measurement</strong> <strong>Methods</strong> <strong>in</strong> <strong>Open</strong> <strong>Channels</strong> Page 85 of 223
transversely: if the base of the flume is not level transversely, the average depth must be used todeterm<strong>in</strong>e the depth/flow relationship. Depth must therefore be measured on each side of theflume to determ<strong>in</strong>e the average depth;longitud<strong>in</strong>ally: if a flume is not level longitud<strong>in</strong>ally, that is, <strong>in</strong> the direction of flow, themeasurement error <strong>in</strong>creases with the length of the flume. Therefore, for a flume 457 mm (1.5 ft)long, a positive slope of 2 % produces a measurement error of approximately 8 % and a positiveslope of roughly 10 % produces a measurement error of approximately 45 %. However, for aflume 1,371 mm (4.5 ft) long, a positive slope of 2 % produces a measurement error ofapproximately 0.5 % and a positive slope of approximately 10 % produces a measurement error ofapproximately 30 % (18) .−<strong>in</strong>correct measur<strong>in</strong>g po<strong>in</strong>t positionfor all dimensions, upstream (h 1 ) and downstream (h 2 ) measur<strong>in</strong>g po<strong>in</strong>ts, must be locatedrespectively at a distance equal to 2 L/9 and 5 L/9 from the constriction (L be<strong>in</strong>g the total lengthof the flume). This distance must be measured parallel to the centre axis of the flume.−<strong>in</strong>adequate approachthe converg<strong>in</strong>g section of the flume is too small to adequately correct all major approach velocityand distribution distortions. (The reader can refer to section 2.4.10, which discusses <strong>in</strong>stallationconditions, for <strong>in</strong>formation about rules that regulate the approach).−poor measurement technique <strong>in</strong> submerged flow conditionsoften, due to a lack of knowledge, a user is unaware of how to recognize or gauge the degree ofsubmerged flow and takes flow measurements at only one location, <strong>in</strong>stead of at both measur<strong>in</strong>gpo<strong>in</strong>ts, which this situation requires.−obstructions <strong>in</strong> the flume throatit is important to ensure that noth<strong>in</strong>g is block<strong>in</strong>g the flume throat and causes an <strong>in</strong>correct read<strong>in</strong>gof water depth due to the flow mov<strong>in</strong>g over the obstacle (ma<strong>in</strong>ly <strong>in</strong> small flumes).−erosion at the outlet of the flumeit is important to ensure that erosion does not cause the flume to move from its orig<strong>in</strong>al position.2.4.9. Selection criteriaAlthough <strong>in</strong>stallation of a Parshall flume is the preferred option for a permanent measurement site, a cutthroatflume is an adequate substitute.Page 86 of 223<strong>Booklet</strong> 7 - <strong>Flow</strong> <strong>Measurement</strong> <strong>Methods</strong> <strong>in</strong> <strong>Open</strong> <strong>Channels</strong>
S<strong>in</strong>ce a number of other cutthroat flumes can often be used to measure the anticipated range of flows, othercriteria should be considered when select<strong>in</strong>g a flume, such as:−−−−−−discharge: it is important to select the correct size of flume to ensure that free flow conditions are presentat maximum discharge, and to consider <strong>in</strong>stallation constra<strong>in</strong>ts;loss of head: for one flow, the degree to which the water level rises, due to <strong>in</strong>troduc<strong>in</strong>g different sizes offlumes;the sensitivity necessary to detect and measure variations <strong>in</strong> water level, even where there is very littlechange <strong>in</strong> the m<strong>in</strong>imum flowrate;the precision desired;the work that is required to <strong>in</strong>stall flumes of different sizes;the costs associated with <strong>in</strong>stallation of flumes of different sizes.2.4.10. Installation specificationsWhen a flume is <strong>in</strong>stalled, it is important to ensure that the physical characteristics of the flume correspond tothose shown <strong>in</strong> Figure 16 and Table 14.The crest of the flume’s converg<strong>in</strong>g section can be at the same level as the bottom of the delivery pipe, so longas this type of system does not cause a submerged flow (h 2 /h 1 ) that is greater than the transient flow value (S t ).The transient value (S t ) is determ<strong>in</strong>ed <strong>in</strong> the follow<strong>in</strong>g manner (16) :Total length of flume (L) Transient flow value (S t )457 mm (1.5 ft) 60 %914 mm (3.0 ft) 65 %1372 mm (4.5 ft) 70 %2743 mm (9.0 ft) 80 %To reduce or elim<strong>in</strong>ate a submerged flow, the flume can be lifted and the base of the delivery pipe can beconnected to the crest of the converg<strong>in</strong>g section by an <strong>in</strong>verted slope section with a 1:4 ratio(vertical : horizontal), as long as the anticipated water depth does not cause an overflow outside of the system.The length of the approach section must have at least twenty times the diameter of the delivery pipe.In the approach section, the slope should be less than 1 %. A steep slope should be avoided because it couldcause a hydraulic jump <strong>in</strong> the converg<strong>in</strong>g section of the flume (see Figure 7) or may cause too much velocity,which will affect the rise <strong>in</strong> water level <strong>in</strong> the converg<strong>in</strong>g section.The m<strong>in</strong>imum width of the approach section should be consistent with dimension “B” of Table 14 and themaximum width should not exceed this dimension by more than 10 meters. It is important to avoid <strong>in</strong>troduc<strong>in</strong>gthe water delivery pipe directly <strong>in</strong> the flume’s converg<strong>in</strong>g section (see Figure 8).At the flume outlet, there should be enough of a slope to allow water to discharge quickly. The <strong>in</strong>cl<strong>in</strong>e shouldbe approximately 2 %.<strong>Booklet</strong> 7 - <strong>Flow</strong> <strong>Measurement</strong> <strong>Methods</strong> <strong>in</strong> <strong>Open</strong> <strong>Channels</strong> Page 87 of 223
After the diverg<strong>in</strong>g section, there should be no pronounced curve that can impede discharge and causebackflow.The conduit for the still<strong>in</strong>g well at measur<strong>in</strong>g po<strong>in</strong>t h 1 , must be located with<strong>in</strong> two-thirds (2/3) of the length ofthe converg<strong>in</strong>g section. This distance is measured parallel with the direction of flow. The conduit is also placedat a right angle to the wall and level with the wall.The conduit for the still<strong>in</strong>g well, at measur<strong>in</strong>g po<strong>in</strong>t h 2 , must be located <strong>in</strong> the flume’s diverg<strong>in</strong>g section, at adistance equal to 5/6 the length of the diverg<strong>in</strong>g section. This distance is measured parallel with the direction offlow. The conduit is placed at a right angle and level with the wall.2.4.11. Submerged flowOne might expect a submerged flow to occur as soon as the water reaches the threshold of the converg<strong>in</strong>gsection; but this is not the case. The flowrate is not reduced as long as the h 2 /h 1 ratio, expressed as apercentage, does not exceed the transient flow values (S t ) def<strong>in</strong>ed <strong>in</strong> section 2.4.10.If the depth downstream (h 2 ) exceeds the threshold of the converg<strong>in</strong>g section, upstream (h 1 ) and downstream(h 2 ) depth measurements must be taken simultaneously. If the h 2 /h 1 ratio is greater than the transient flow value(S t ), flow is said to be submerged, and flow is determ<strong>in</strong>ed on the basis of simultaneous measurements of depthsh 1 and h 2 .S<strong>in</strong>ce there is currently no commercial <strong>in</strong>strument that is able to take simultaneous upstream and downstreammeasurements and perform calculations, measurements <strong>in</strong> submerged flow conditions should be avoided.The h 2 /h 1 ratio can reach the transient flow value (S t ) before there is a significant flow deterioration. Beyondthis transient value, however, flow reduction grows exponentially.If the h 2 /h 1 ratio reaches 100 %, there is no more flow. However, 95 % is considered to be the limit at which acutthroat flume can be used. Because the difference between h 1 and h 2 is so small, the slightest error <strong>in</strong> depthmeasurement will result <strong>in</strong> extreme <strong>in</strong>accuracies. This type of flume should therefore not be used <strong>in</strong> submergedflow conditions if the h 2 /h 1 ratio exceeds 0.95.Flumes under 914 mm (3 feet) <strong>in</strong> length should never be used <strong>in</strong> submerged flow conditions.2.4.12. Discharge equation <strong>in</strong> submerged flow conditionsFor this type of flow regime, the discharge equation result<strong>in</strong>g from the h 1 and h 2 measurement is expressed asfollows (18) :Q =C1( h1− h2)n2( −log S )n1(16)Page 88 of 223<strong>Booklet</strong> 7 - <strong>Flow</strong> <strong>Measurement</strong> <strong>Methods</strong> <strong>in</strong> <strong>Open</strong> <strong>Channels</strong>
where:Q is the flowrate <strong>in</strong> cubic meters or cubic feet per second;C 1 is KW 1.025 ;h 1 is the depth upstream, <strong>in</strong> meters or feet;h 2 is the depth downstream, <strong>in</strong> meters or feet;n 1 is the exponent constant based on the length of the flume (18) ;S is the ratio between h 1 (upstream depth) and h 2 (downstream depth): h 2 /h 1 ;n 2 is the exponent <strong>in</strong> submerged flow conditions, accord<strong>in</strong>g to the length of the flume (n 2 =1);K is the constant based on the length of the flume and unit of measurement;W is the size of the constriction <strong>in</strong> meters or feet.Table 19 shows the values for K and C <strong>in</strong> submerged flow conditions.2.4.13. Loss of headBefore <strong>in</strong>stall<strong>in</strong>g a flume, ensure that the rise <strong>in</strong> water level <strong>in</strong> the dra<strong>in</strong>age system will not cause sewers toback up <strong>in</strong> build<strong>in</strong>g basements. Use the follow<strong>in</strong>g formula to gauge this <strong>in</strong>crease (R) (19) :R = h+ r+ r1 c i −Hc(17)where:RH ch 1r ir crepresents the rise of water <strong>in</strong> the section upstream from the flume;represents the water depth <strong>in</strong> the channel, prior to <strong>in</strong>stall<strong>in</strong>g the flume, at maximumdischarge;represents the anticipated water depth at the measur<strong>in</strong>g po<strong>in</strong>t upstream from the throatsection;represents the height of the channel bottom;represents the height of the crest of the flume.The units are meters or feet.<strong>Booklet</strong> 7 - <strong>Flow</strong> <strong>Measurement</strong> <strong>Methods</strong> <strong>in</strong> <strong>Open</strong> <strong>Channels</strong> Page 89 of 223
TABLE 19 - CUTTHROAT FLUME - VALUES OF COEFFICIENTS C AND K IN SUBMERGEDFLOW CONDITIONSFlume dimensions<strong>in</strong> mm and feetImperial system Metric systemn 1L W C K C K1829 10.6 1.956'1219 6.97 1.2862743 4'610 3.43 1.688 0.633 1.05 1.392'9' 3051'6102'3051372 1’1520.5’4.5' 760.25'9144061.33'2030.67'1020.33'3' 510.17'2030.67’102457 0.33'510.17'1.5' 250.083'1.6880.3114.575 0.9942.275 0.4891.12 2.275 0.2390.5480.1182.465 0.8431.705 0.4150.837 2.58 0.2050.4130.1012.14 0.7711.048 0.3810.516 3.25 0.1870.2610.091.65 1.412.125 1.483.95 1.741Page 90 of 223<strong>Booklet</strong> 7 - <strong>Flow</strong> <strong>Measurement</strong> <strong>Methods</strong> <strong>in</strong> <strong>Open</strong> <strong>Channels</strong>
Example: To measure a 0.6 m 3 (21 CFS) flow, a flume 27 m (9 ft) long with a throat 610 mm (2 ft) wide is<strong>in</strong>stalled. Water depth (H c ), prior to <strong>in</strong>stallation of the flume is 0.53 m (1.75 ft). The estimated water depth (h 1 )<strong>in</strong> the flume to allow this type of flow to move through is 0.61 m (2 ft). When the base of the flume is placed0.22 m (0.75 ft) away from the bottom of the conduit, the h 2 /h 1 ratio {0.53/0.83 (1.75/2.75)} is 0.64. The flumeis therefore operat<strong>in</strong>g <strong>in</strong> free flow conditions, because the transient flow value (S t ) has not been reached. Therise (R) <strong>in</strong> water level, or loss of head, is 0.3 m, more specifically: (0.61 - 0.53) + 0.22 {1 ft, more specifically:(2 - 1.75 + 0.75)}.If this rise is too extreme for the network <strong>in</strong> question, the flume can be lowered to 0.08 m (0.25 ft) away fromthe bottom of the conduit, as long as free flow conditions cont<strong>in</strong>ue to be ma<strong>in</strong>ta<strong>in</strong>ed. The loss of head istherefore 0.16 m (0.5 ft).If a flume is placed directly on the bottom of a conduit, the h 2 /h 1 ratio {0.53/0.61 (1.75/2)} is 0.87, and theflume is operat<strong>in</strong>g <strong>in</strong> submerged flow conditions. The rise (R), or loss of head, however, is only 0.08 m(0.25 ft).3 ft 6 ftHch10.25 ftR= 1 ft141.75 ftr ir c0.75 ft.Hc1.75 ftThe steps to determ<strong>in</strong>e the total rise are as follows:− measure depth <strong>in</strong> the conduit at maximum discharge (H c );− gauge the maximum flowrate as accurately as possible (Q max );− determ<strong>in</strong>e what the water depth will be downstream from the throat section dur<strong>in</strong>g the anticipatedmaximum discharge (h 1 );− determ<strong>in</strong>e the size of the flume that can be used to measure the anticipated maximum discharge, andcreate the least possible submerged conditions;− determ<strong>in</strong>e the ratio between depths, <strong>in</strong> submerged flow conditions (h 2 /h 1 );− determ<strong>in</strong>e how far the crest (r c ) of the flume (r c - r i ) will be <strong>in</strong>stalled away from the channel bottom (r i ).Once this evaluation of the rise <strong>in</strong> water level is complete, basement <strong>in</strong>verts <strong>in</strong> build<strong>in</strong>gs should be <strong>in</strong>spected toensure that <strong>in</strong>stallation will not cause a backup risk.<strong>Booklet</strong> 7 - <strong>Flow</strong> <strong>Measurement</strong> <strong>Methods</strong> <strong>in</strong> <strong>Open</strong> <strong>Channels</strong> Page 91 of 223
2.4.14. Flume modificationsIt is important to use a flume that has the exact dimensions of a calibrated flume, because the depth/flowrelationship for this type of flume can only be obta<strong>in</strong>ed through direct calibration of the flume. The depth/flowrelationship for a larger flume cannot be based on the calibration of a small flume (20) .For specific applications, a flume with another throat width than those shown <strong>in</strong> Table 14 may have to bemanufactured. The value of C can be obta<strong>in</strong>ed us<strong>in</strong>g the follow<strong>in</strong>g equation (20) :1 . 025C = KW(18)2.4.15. CalibrationSection 1.12.13 discusses calibration.Due to the large size of tanks available, use of the volumetric method is usually limited to flumes less than1372 mm (4.5 feet) <strong>in</strong> length and that have 610 mm (2 feet) of constriction.Dur<strong>in</strong>g calibration, water depth <strong>in</strong> the flume, at the measur<strong>in</strong>g po<strong>in</strong>t, must not vary more than 4 %, regardlessof which method is used.2.5. H flumeH flumes were designed <strong>in</strong> the mid-1930s by the USDA Agricultural Research Service (20) . There are threecategories of H flumes: Hs, H and HL, all of which have the same shape, but differ <strong>in</strong> size and angles.2.5.1. DescriptionAn H flume is the result of a comb<strong>in</strong>ation of the physical and mechanical characteristics of a weir and flume.Because of its shape, it resembles a triangular weir more than a flume. From a mechanical perspective, likeflumes, it enables solids to be discharged (4) .Page 92 of 223<strong>Booklet</strong> 7 - <strong>Flow</strong> <strong>Measurement</strong> <strong>Methods</strong> <strong>in</strong> <strong>Open</strong> <strong>Channels</strong>
It consists of two sections: approach and control (20) .Flume HSFlume HFlume HLThe approach section is shaped by converg<strong>in</strong>g sides, and the control section consists of an open<strong>in</strong>g that is theresult of the shape of the converg<strong>in</strong>g sides.Converg<strong>in</strong>g sides are cut at a 28° vertical angle for Hs flumes, 42° for H flumes and 55° for HL flumes (seeFigures 17, 18 and 19). The edges form a trapezoidal open<strong>in</strong>g that is narrow at the bottom and wider at the top.The angle of the open<strong>in</strong>g formed by the sides, <strong>in</strong> comparison with the flow l<strong>in</strong>e, is 27° for Hs flumes, 37° for Hflumes and 45° for HL flumes.The entire underside of the flume is usually flat. An H flume may have an <strong>in</strong>cl<strong>in</strong>ed bottom to help dischargesolids when the flow is weak. There is an approximately 7° transversal slope (21) (see Figure 18).Flumes are named accord<strong>in</strong>g to the dimension of the device <strong>in</strong> use. A small flume is therefore an Hs type, aregular flume is an H type, and a large flume is an HL type. The ratio between width and height of the flume atthe <strong>in</strong>let of the converg<strong>in</strong>g section can be used to tell them apart. The W/H ratio should be 1.05 for Hs flumes,1.9 for H flumes and 3.2 for HL flumes (see Tables 20, 21 and 22).2.5.2. Operat<strong>in</strong>g pr<strong>in</strong>cipleAn H flume operates accord<strong>in</strong>g to the Venturi pr<strong>in</strong>ciple. Due to lateral restrictions, the flume restricts the flowarea, caus<strong>in</strong>g the water level upstream from the throat to rise. The flow can be obta<strong>in</strong>ed by simply measur<strong>in</strong>gthe water depth, because this depth varies proportionally with flow.<strong>Booklet</strong> 7 - <strong>Flow</strong> <strong>Measurement</strong> <strong>Methods</strong> <strong>in</strong> <strong>Open</strong> <strong>Channels</strong> Page 93 of 223
FIGURE 17 - HS FLUME - PHYSICAL CHARACTERISTICSNote: See Table 20 for a description of letters.Page 94 of 223<strong>Booklet</strong> 7 - <strong>Flow</strong> <strong>Measurement</strong> <strong>Methods</strong> <strong>in</strong> <strong>Open</strong> <strong>Channels</strong>
FIGURE 18 - H FLUME - PHYSICAL CHARACTERISTICSNote: See Table 21 for a description of letters.<strong>Booklet</strong> 7 - <strong>Flow</strong> <strong>Measurement</strong> <strong>Methods</strong> <strong>in</strong> <strong>Open</strong> <strong>Channels</strong> Page 95 of 223
FIGURE 19 - HL FLUME - PHYSICAL CHARACTERISTICSNote: See Table 22 for a description of letters.Page 96 of 223<strong>Booklet</strong> 7 - <strong>Flow</strong> <strong>Measurement</strong> <strong>Methods</strong> <strong>in</strong> <strong>Open</strong> <strong>Channels</strong>
Although this type of flume can be used <strong>in</strong> submerged flow conditions, use <strong>in</strong> free flow conditions is stronglyrecommended. In a free flow situation, a flow measurement can be obta<strong>in</strong>ed us<strong>in</strong>g only one measur<strong>in</strong>g po<strong>in</strong>t,but <strong>in</strong> submerged flow conditions, the depth downstream from the throat section must also be measured.2.5.3. ApplicationsAn H flume was developed to measure the flow of irrigation water from small catchment areas and surfacewater. Today, it is generally used to measure the flow of irrigation water, slow-flow<strong>in</strong>g watercourses and water<strong>in</strong> sewer systems (7) .The geometry and operat<strong>in</strong>g pr<strong>in</strong>ciple of an H flume make it a very useful tool for measur<strong>in</strong>g the flow of waterthat conta<strong>in</strong>s solids. This type of flume can measure a variety of different flows and provides good precision.This type of flume is also easy to manufacture, is relatively <strong>in</strong>expensive and is suitable for temporarymeasurement systems.2.5.4. DimensionsIn order for an H flume to produce exact flow measurements, standard dimensions must be carefully respectedwhen the flume is manufactured.Figures 17, 18 and 19 show the physical characteristics of an H flume and Tables 20, 21 and 22, <strong>in</strong>dicate theexact dimensions that each part of the flume is required to have (21) .<strong>Booklet</strong> 7 - <strong>Flow</strong> <strong>Measurement</strong> <strong>Methods</strong> <strong>in</strong> <strong>Open</strong> <strong>Channels</strong> Page 97 of 223
TABLE 20 - HS FLUME – STANDARD DIMENSIONSD mm ft mm ft mm ft mm ft mm ft122 0.4 152 0.5 183 0.6 244 0.8 305 1W1.05 DB1.5 DE0.05 DM1 DP0.7167DN1.05 DV0.383 DC1.5811DL1.054 DF1.054 D128 0.42 160 0.0525 192 0.63 256 0.84 320 1.05183 0.6 228 0.75 275 0.9 366 1.2 458 1.56 0.02 8 0.025 9 0.03 12 0.04 15 0.05122 0.4 152 0.5 183 0.6 244 0.8 305 187 0.28668 109 0.35832 131 0.43002 175 0.57336 219 0.7167128 0.42 160 0.0525 192 0.63 256 0.84 320 1.0547 0.1532 58 0.1915 70 0.2298 93 0.3064 117 0.383193 0.63244 241 0.79055 289 0.94866 386 1.26488 482 1.5811129 0.4216 160 0.527 193 0.6324 257 0.8432 321 1.054129 0.4216 160 0.527 193 0.6324 257 0.8432 321 1.054where:D: total depth of the flume;W: width of the approach section;B: length of the flume base;E: width of the throat section at its base;M: measur<strong>in</strong>g po<strong>in</strong>t;P: width of the base at the measur<strong>in</strong>g po<strong>in</strong>t;N: total width of the flume;V: width of throat section at top;C: length of the bottom of sides;L: length of the top of sides;F: measur<strong>in</strong>g po<strong>in</strong>t on the side.Page 98 of 223<strong>Booklet</strong> 7 - <strong>Flow</strong> <strong>Measurement</strong> <strong>Methods</strong> <strong>in</strong> <strong>Open</strong> <strong>Channels</strong>
TABLE 21 - H FLUME – STANDARD DIMENSIONSDW1.9 DB1.35 DE0.1 DM1.05 DP1.5 DN1.9 DV1.1 DC1.6225 DL0.721 DF1.2619 Dt0.2 DY0.3 D1522892051516022828916724711019230460.5’0.950.6750.050.5250.750.950.550.811250.36050.630960.10.152290.75'4351.4253091.0125230.0752400.78753441.1254351.4252520.8253721.216881650.54082880.94643460.15690.2253055804123132045858033649522038561911’1.91.350.11.051.51.91.11.62250.7211.26190.20.345786861746480686868503741330577911371.5’2.852.0250.151.5752.852.851.652.433751.08151.892850.30.4561011598246164191511596719904407691221832’3.82.70.22.133.82.23.2451.4422.52380.40.676214481029768001143144883812365499621522292.5’4.753.3750.252.6253.754.752.754.056251.80253.154750.50.759141737123491960137117371005148365911541832743’5.74.050.33.154.55.73.34.86752.1633.78570.60.9Where:D: total depth of the flume;W: width of the approach section;B: length of the base of the flume;E: width of the throat section at its base;V: width of the throat section at the top;P: width of the base at the measur<strong>in</strong>g po<strong>in</strong>t;N: total width of the flume;L: length of the top of sides;C: length of the base of sides;M: measur<strong>in</strong>g po<strong>in</strong>t;F: measur<strong>in</strong>g po<strong>in</strong>t on the side;t: height of the bottom slope;Y: distance between the beg<strong>in</strong>n<strong>in</strong>g of the sloped bottom and side of the flume.<strong>Booklet</strong> 7 - <strong>Flow</strong> <strong>Measurement</strong> <strong>Methods</strong> <strong>in</strong> <strong>Open</strong> <strong>Channels</strong> Page 99 of 223
TABLE 22 - HL FLUME – STANDARD DIMENSIONSD mm ft mm ft mm ft mm ft mm ft610 2 762 2.5 914 3 1067 3.5 1219 4W3.2 DB1.5 DE0.2 DM1.25 DP2.7 DN3.2 DV2.2 DC2.1213DL0.707 DF1.7678D1952 6.4 2438 8 2925 9.6 3414 11.2 3901 12.8915 3 1143 3.75 1371 4.5 1600 5.25 1829 6122 0.4 152 0.5 183 0.6 213 0.7 244 0.8763 2.5 953 3.125 1143 3.75 1334 4.375 1524 51647 5.4 2057 6.75 2468 8.1 2881 9.45 3291 10.81952 6.4 2438 8 2925 9.6 3414 11.2 3901 12.81342 4.4 1676 5.5 2011 6.6 2347 7.7 2682 8.81293 4.2426 1616 5.30325 1940 6.3639 2263 7.42455 2586 8.4852431 1.414 539 1.7675 646 2.121 754 2.4745 862 2.8281078 3.5356 1347 4.4195 1616 5.3034 1886 6.1873 2155 7.0712Where:D: total depth of flume;W: width of the approach section;B: length of the flume base;E: width of throat section at bottom;V: width of throat section at top;F: measur<strong>in</strong>g po<strong>in</strong>t on the side;P: width of base at the measur<strong>in</strong>g po<strong>in</strong>t;N: total width of the flume;L: length of the top of sides;C: length of the base of sides;M: measur<strong>in</strong>g po<strong>in</strong>t.Page 100 of 223<strong>Booklet</strong> 7 - <strong>Flow</strong> <strong>Measurement</strong> <strong>Methods</strong> <strong>in</strong> <strong>Open</strong> <strong>Channels</strong>
TABLE 23 - H FLUME - RECOMMENDED MINIMUM AND MAXIMUM FLOWRATES INFREE FLOW CONDITIONSFlume dimensions mmand feetHsHH LM<strong>in</strong>imumdepthmm (ft)MINIMUM FLOWRATEMaximumdepthmm (ft)MAXIMUMFLOWRATED l/s m 3 /d l/s m 3 /d1220.4'1520.5'1830.6'2440.8'3051'1520.5'2290.75'3051'4571.5'6102v7622.5'9143'6102'7622.5'9143'10673.5'12194'60.0260.0260.0260.0260.0260.0260.0260.0260.0260.0260.0260.0260.0260.0260.0260.0260.020.0046 0.3981 1220.4'0.0056 0.4834 1520.5'0.0066 0.5687 1830.6'0.0086 0.7393 2440.8'0.0105 0.9099 3051'0.0113 0.976 1520.5'0.0169 1.46 2290.75'0.0198 1.953 3051'0.0311 2.687 4571.5'0.0396 3.425 6102'0.051 4.404 7622.5'0.0595 5.138 9143'0.077 6.63 6102’0.095 8.208 7622.5'0.113 9.787 9143’0.132 11.366 10673.5'0.15 12.944 12194'2.407 2083.964 342.56.513 562.713.31 1 15023.22 2 0069.91 856.327.47 2 37356.4 4 869155.5 13 432320 27 646558 48 198881 76 08950.6 50 64488.6 88 567139.5 139 456205 205 269286 286 251<strong>Booklet</strong> 7 - <strong>Flow</strong> <strong>Measurement</strong> <strong>Methods</strong> <strong>in</strong> <strong>Open</strong> <strong>Channels</strong> Page 101 of 223
2.5.5. Ranges of measurementH flumes can be used to measure flowrates between 0.3981 m 3 per day, for an Hs flume 122 mm (0.4 ft) high,and 286,251 m 3 per day, for an HL flume 1219 mm (4 ft) high.Table 23 shows recommended m<strong>in</strong>imum and maximum flowrates for each type of H flume (21) .2.5.6. Discharge equation <strong>in</strong> free flow conditionsDischarge equations result<strong>in</strong>g from the depth/flow relationship <strong>in</strong> free flow conditions, are extremely complex.For this reason, work<strong>in</strong>g with depth/flow tables supplied by manufacturers is recommended. Equations can,however, be very useful to determ<strong>in</strong>e the flowrate of flumes with dimensions that are slightly different fromstandard dimensions. The total flow measured by an H flume is the result of the sum of amounts of watermeasured at different depths <strong>in</strong> the throat section. <strong>Flow</strong> measurements <strong>in</strong> an H flume require the use of threeequations (20) .One equation is used to determ<strong>in</strong>e the flow for one depth of water <strong>in</strong> the flume, below 0.03 m (0.1 ft). A secondequation is used to determ<strong>in</strong>e the flow at a water depth said to be <strong>in</strong> transition, that is, between 0.03 and 0.06 m(0.1 and 0.2 ft). The third equation is required for water depths <strong>in</strong> excess of 0.06 m (0.2 ft).For water depths below 0.03 m (0.1 ft) (low flows), the equation is:− for Hs, H and H L flumes (20) :Q=A ( 2Boo+ B h )( h )( h − 0,01)iA i(19 )For depths between 0.03 and 0.06 m (0.1 and 0.2 ft) (transitional flows), the equation is:− for Hs, H and H L flumes (20) :3/2Q o= ( KBo+ K i Bih) 2g h(20)For depths greater than 0.06 m (0.2 ft), (ma<strong>in</strong> flows), the discharge equation is:− Hs and H flumes (20) :− for H L flumes (20) :Q = [( Eo+VEiD)Bo+(F o+ F i D)B i(h+)]2g22 3/22g(h+V)2g(21)Q = ( KoBo+ K i Bih)2 gh3/2(22)The values of coefficients and exponents used <strong>in</strong> the above formulas are shown <strong>in</strong> Table 24.Page 102 of 223<strong>Booklet</strong> 7 - <strong>Flow</strong> <strong>Measurement</strong> <strong>Methods</strong> <strong>in</strong> <strong>Open</strong> <strong>Channels</strong>
CoefficientsandexponentsTABLE 24 - H FLUME - COEFFICIENT AND EXPONENT VALUESDmmftmcsA o 2.238A i 0.526B o1220.41520.51830.62440.8305134568Hs DH DHLcfsmmmmmcs cfsftftmcscfs1.705 3.142.023 3.57393s 1.822 s 3.300.486 0.4860.522 0.5220.526s 0.5 s 0.5152 8 0.025 610 62 0.20.01 0.52229 11 0.0375 762 76 0.250.0125 0.752.5305 15 0.05 914 91 0.30.015 13457 23 0.075 1 067 107 0.350.02 1.53.5610 31 0.1 1 219 122 0.40.025 24762 38 0.1252.5914 46 0.153B i 51 0.1667 152 0.5 305 1E o 0.861 0.861 0.612s 0.6300.612s 0.630E i 0.367 0.112 0.686s 0.5710.209s 0.174F o 0.4790.20.4792.70.409s 0.40.409s 0.4F i -0.11561-0.035824-0.079s -0.059-0.024s -0.018122 0.707152 0.738 0.378 6100.40.707 0.5 s 0.799 s 0.799 2152 0.738229 0.736 0.736 7620.50.738 0.752.5183 0.752305 0.705 0.705 9140.60.752 1 s 0.755 s 0.755 3K o244 0.76457 0.71 0.71 1 0670.8 0.76 0.76 1.5 s 0.751 s 0.751 3.5305 0.755610 0.711 0.711 1 219 0.7804 0.780410.755 2 s 0.748 s 0.748 47622.50.712s 07450.712s 0.74591430.713s 07440.713s 0.744122 0.537152 0.399 0.399 6100.40.537 0.5 s 0.381 s 0.381 2152 0.538229 0.409 0.409 7620.50.538 0.752.5183 0.545305 0.448 0.448 9140.60.545 1 s.0416 s 0.416 3K i244 0.572457 0.472 0.472 1 0670.80.572 1.5 s 0.435 s 0.435 3.5305 0.614610 0.498 0.498 1 219 0.3788 0.378810.614 2 s.0456 s 0.456 47622.50.525s 0.4790.525s 0.47991430.551s 0.5020.551s 0.502<strong>Booklet</strong> 7 - <strong>Flow</strong> <strong>Measurement</strong> <strong>Methods</strong> <strong>in</strong> <strong>Open</strong> <strong>Channels</strong> Page 103 of 223
2.5.7. PrecisionIn free flow conditions, the precision of an H flume is comparable to that of other flumes. Hs flumes thatare used to measure small flows, are the most accurate. To obta<strong>in</strong> this type of precision, flumes must bemanufactured with extreme attention to detail and <strong>in</strong>stallation, <strong>in</strong> compliance with standard dimensions.2.5.8. Sources of errorThe pr<strong>in</strong>cipal sources of error that <strong>in</strong>terfere with the precision of a flume are as follows:−changes to standard dimensions, made when the flume is manufactured or dur<strong>in</strong>g <strong>in</strong>stallationtransversely: the flume must be level transversely, notwithstand<strong>in</strong>g remarks <strong>in</strong> section 2.5.1.longitud<strong>in</strong>ally: <strong>in</strong> the direction of flow, a positive slope of 2 % will generate a measurementerror of approximately 1 %.−<strong>in</strong>correct measur<strong>in</strong>g po<strong>in</strong>t positionthe measur<strong>in</strong>g po<strong>in</strong>t upstream must be located at a distance equal to D for Hs flumes; at 1.05 Dfor H flumes; and 1.25 D, for H L (4)(6)(20)(21) flumes. D is the dimension for the total height of theflume.Note: Distance D must be measured parallel to the flume’s central axis, from the discharge po<strong>in</strong>t andupstream.−<strong>in</strong>adequate approachthe converg<strong>in</strong>g section of the flume is too small to adequately correct all major approachvelocity and distribution distortions (The reader can refer to section 2.5.10 which discusses<strong>in</strong>stallation conditions, for <strong>in</strong>formation about rules that regulate the approach.).−poor measurement technique <strong>in</strong> submerged flowoften, the user, due to a lack of knowledge, does not know how to recognize and gauge thedegree of submerged flow and takes a flow measurement <strong>in</strong> one location only, <strong>in</strong>stead of thetwo measur<strong>in</strong>g po<strong>in</strong>ts this situation requires.−obstructions <strong>in</strong> the flume throatit is important to ensure that noth<strong>in</strong>g is block<strong>in</strong>g the flume throat and causes an <strong>in</strong>correctread<strong>in</strong>g of water depth due to the flow mov<strong>in</strong>g over the obstacle, ma<strong>in</strong>ly <strong>in</strong> small flumes.Page 104 of 223<strong>Booklet</strong> 7 - <strong>Flow</strong> <strong>Measurement</strong> <strong>Methods</strong> <strong>in</strong> <strong>Open</strong> <strong>Channels</strong>
−erosion at the outlet of the flumeit is important to ensure that erosion does not cause the flume to move and that its orig<strong>in</strong>allongitud<strong>in</strong>al position rema<strong>in</strong>s horizontal.2.5.9. Selection criteriaAlthough <strong>in</strong>stallation of a Parshall flume is the preferred option at a permanent measurement site, an Hflume may be adequate.S<strong>in</strong>ce a number of other flumes can often be used to measure the anticipated range of flows, other criteriashould be considered when select<strong>in</strong>g a flume, such as:−−−−−−discharge: it is important to select the correct size of flume to ensure that free flow conditions arepresent at maximum discharge, and to consider <strong>in</strong>stallation constra<strong>in</strong>ts;loss of head: for one flow, the degree to which the water level rises, due to <strong>in</strong>troduc<strong>in</strong>g different sizesof flumes;the sensitivity necessary to detect and measure variations <strong>in</strong> water level, even where there is very littlechange <strong>in</strong> the m<strong>in</strong>imum flowrate;the desired precision;the overall work that is required to <strong>in</strong>stall flumes of different sizes;the costs associated with <strong>in</strong>stallation of flumes of different sizes.2.5.10. Installation specificationsWhen a flume is <strong>in</strong>stalled, it is important to ensure that the flume’s physical characteristics correspond tothose shown <strong>in</strong> Figures 17, 18 and 19 and Tables 20, 21 and 22.The crest of the flume’s converg<strong>in</strong>g section must be at the same level as the base of the delivery pipe (12) .The length of the flume’s approach section must be equal to at least five times the flume’s total height (12) .The slope should be less than 1 % <strong>in</strong> the approach section. Care should be taken to ensure that a steep slopedoes not cause a hydraulic jump <strong>in</strong> the flume’s converg<strong>in</strong>g section (see Figure 7), or that it does not createtoo great a velocity, which could result <strong>in</strong> a lower water depth <strong>in</strong> the converg<strong>in</strong>g section.The width of the approach channel should be equal to dimension “W” <strong>in</strong> Tables 20, 21 and 22. It isimportant ensure that the water delivery pipe does not discharge directly <strong>in</strong>to the flume’s converg<strong>in</strong>gsection (see Figure 8).Ideally, there should be a drop at the outlet of the flume (12) . The discharge channel should have enoughslope to allow water to flow immediately. This slope should be at least 2 %.At the flume outlet, there should be no pronounced curve that can restrict flow and cause a submerged flow.<strong>Booklet</strong> 7 - <strong>Flow</strong> <strong>Measurement</strong> <strong>Methods</strong> <strong>in</strong> <strong>Open</strong> <strong>Channels</strong> Page 105 of 223
2.5.11. Submerged flowThe upstream depth measurement becomes distorted, as soon as the downstream depth reaches 10 % of theupstream depth. Where this is the case, the upstream depth is 0.3 % greater than its normal depth. If thedownstream depth is at 50 % of the depth upstream, the upstream depth is 2.6 % greater than its normaldepth (20) .If the downstream depth (h 2 ) is greater at the threshold of the converg<strong>in</strong>g section, simultaneousmeasurements must be taken of the upstream (h 1 ) and downstream (h 2 ) depths. If the h 2 /h 1 ratio is greaterthan 30 %, the flow is said to be submerged, and the flow measurement arises from the simultaneousmeasurement of both depths h 1 and h 2 . S<strong>in</strong>ce there is currently no commercial <strong>in</strong>strument that is able tosimultaneously take upstream and downstream measurements and perform calculations, measurementsshould not be taken <strong>in</strong> submerged flow conditions.The h 2 /h 1 ratio may reach 40 % before there is a significant flow measurement error. For each additionalpercentage, the flow reduction will <strong>in</strong>crease exponentially.If the h 2 /h 1 ratio reaches 100 %, there is no more flow. However, 95 % is considered to be the thresholdvalue where the H flume is no longer effective, because the difference <strong>in</strong> depth between h 1 and h 2 is sosmall, the slightest depth measurement error will result <strong>in</strong> extreme <strong>in</strong>accuracies. This type of flume shouldtherefore not be used <strong>in</strong> submerged flow conditions if the h 2 /h 1 ratio is greater than 0.95.2.5.12. Discharge equation <strong>in</strong> submerged flow conditionsThe follow<strong>in</strong>g equation (20) can be used to determ<strong>in</strong>e the depth/flow relationship, if the flume was operat<strong>in</strong>g<strong>in</strong> free flow conditions.hh 44h / h 5.2= 1+0,000175( e ) (23)11modwhere:h 1h 2is the depth upstream from the throat section, <strong>in</strong> meters or feet;is the depth downstream from the throat section, <strong>in</strong> meters or feet;e is 2.71828;h mod is the depth upstream, <strong>in</strong> meters or feet, if the flume was operat<strong>in</strong>g <strong>in</strong> free flowconditions.If the depth <strong>in</strong> free flow conditions is calculated, the applicable equations shown <strong>in</strong> section 2.5.6, are usedto determ<strong>in</strong>e flow.Page 106 of 223<strong>Booklet</strong> 7 - <strong>Flow</strong> <strong>Measurement</strong> <strong>Methods</strong> <strong>in</strong> <strong>Open</strong> <strong>Channels</strong>
2.5.13. Flume modificationTo obta<strong>in</strong> accurate measurements, the dimensions shown <strong>in</strong> Tables 20, 21 and 22 must be used correctly.The slightest modification to flume dimensions will require the flume to be calibrated.2.5.14. CalibrationSection 1.12.13 discusses calibration.Due to the size of the tanks available, use of the volumetric method is usually limited to H flumes smallerthan 610 mm (2 ft).Dur<strong>in</strong>g calibration, water depth <strong>in</strong> the flume, at the measur<strong>in</strong>g po<strong>in</strong>t, must not vary more than 2 %.3. DESCRIPTION OF THIN-PLATED WEIRSThe sections that follow discuss th<strong>in</strong>-plate weirs that may be <strong>in</strong> use at temporary or permanent test sites.3.1. GeneralWeirs are generally used to measure the flow of effluents that conta<strong>in</strong> very small amounts of suspendedsolids. When these weirs are built and <strong>in</strong>stalled accord<strong>in</strong>g to standards and used under well-controlledconditions, they yield accurate flow measurements.3.1.1. Operat<strong>in</strong>g pr<strong>in</strong>ciple<strong>Flow</strong> measurement <strong>in</strong> th<strong>in</strong>-plate weirs depends on water depth <strong>in</strong> the weir, size and shape of the weir and anexperimentally determ<strong>in</strong>ed coefficient that also takes <strong>in</strong>to account the unit of measurement, the geometricdimensions of the approach channel and water dynamics.3.1.2. General applicationsDue to the variety of its geometric shape and dimensions, this type of measur<strong>in</strong>g device can measure a widerange of flows (0.25 l/s to 10,619 l/s). To obta<strong>in</strong> as accurate a measurement as possible, triangular weirsshould be used for small flows and trapezoidal and rectangular weirs should be used for larger flows (22) .These primary measur<strong>in</strong>g devices are generally used on a temporary rather than permanent basis. They canbe used <strong>in</strong> sewer pipes, but require constant monitor<strong>in</strong>g, to ensure that conduits do not become blocked bydeposited solids upstream from the weir.The specific application to each type of weir will be discussed further <strong>in</strong> the sections that follow.<strong>Booklet</strong> 7 - <strong>Flow</strong> <strong>Measurement</strong> <strong>Methods</strong> <strong>in</strong> <strong>Open</strong> <strong>Channels</strong> Page 107 of 223
3.1.3. Installation specificationsManufactur<strong>in</strong>g a code <strong>in</strong>stallation is recommended, rather than try<strong>in</strong>g to estimate the effects of nonstandardconditions and try<strong>in</strong>g to correct the values obta<strong>in</strong>ed.Weirs must be <strong>in</strong>stalled <strong>in</strong> a straight flow section.A weir must be <strong>in</strong>stalled <strong>in</strong> rectangular-shape flow channels or <strong>in</strong> measur<strong>in</strong>g chambers that simulaterectangular-shape channels (22) .The weir must be vertical and perpendicular to the sides of the flow channel (22) and level on all axes.Seams that jo<strong>in</strong> the weir, sides and bottom of the channel must be water-tight and resilient.The geometric shape of the weir must be cut as precisely as possible.The weir must be clean and held <strong>in</strong> place securely. It must be able to resist the strongest flows withoutdistortion or damage (22) .The length of the approach section (L a ) must be at least 10 times the length of the nappe (L n ) (22) or 20 timesthe maximum water depth (h max ) measured <strong>in</strong> the weir. Usually, the length of the wall is equal to twice themaximum height.Measur<strong>in</strong>gpo<strong>in</strong>t4 XhhmaxDistanceDISTANCE FROM THE MEASURING POINT UPSTREAM THE OVERFLOWL a = length of the approach sectionL n = length of the nappeh = depth at the measur<strong>in</strong>g po<strong>in</strong>th max = maximum depth at the measur<strong>in</strong>g po<strong>in</strong>tPage 108 of 223<strong>Booklet</strong> 7 - <strong>Flow</strong> <strong>Measurement</strong> <strong>Methods</strong> <strong>in</strong> <strong>Open</strong> <strong>Channels</strong>
Example:For a rectangular weir where the nappe is 0.60 m (2 ft) long and the maximum water depthis 0.3 m (1 ft), the length of the approach section should be 6 m (20 ft).If a weir is located <strong>in</strong> a measur<strong>in</strong>g chamber, the chamber should be large enough to accommodate therecommended approach length (22) .There should be no curve, no fall and no connection <strong>in</strong> the channel (4) .The slope of the approach section should be less than 2 %. It is important to ensure that a steep slope doesnot cause a hydraulic jump <strong>in</strong> the converg<strong>in</strong>g section of the weir, or that it does not cause too great avelocity, which will distort the flow measurement.<strong>Flow</strong> <strong>in</strong> the approach section must be uniform, must have no turbulence and must be well distributed, sothat the average approach velocity, measured at a po<strong>in</strong>t upstream, is less than 0.09 m/s or 0.3 ft/s (2) (23) .A system of baffles can be <strong>in</strong>stalled to enable a better flow distribution. Baffles, however, must be locatedupstream from the approach section (22) .The measur<strong>in</strong>g po<strong>in</strong>t must be located far enough upstream to ensure that it is not affected by the weir’sdrawdown effect. The recommended distance is 4 to 5 times the maximum depth (22) .Measur<strong>in</strong>gpo<strong>in</strong>thhoverflowTRANSFER OF THE ZERO POINT MEASUREMENTThe zero po<strong>in</strong>t measurement must correspond exactly to the weir’s zero po<strong>in</strong>t. To determ<strong>in</strong>e the zero po<strong>in</strong>t,a water depth measurement taken directly on the weir crest will not be reliable due to the drawdown effect.The zero po<strong>in</strong>t of the weir must be transferred precisely to the measur<strong>in</strong>g po<strong>in</strong>t, with the help of a level (22) .A permanent staff gauge must be <strong>in</strong>stalled at the measur<strong>in</strong>g po<strong>in</strong>t. The zero on the gauge mustcorrespond to the level of the weir crest. The staff gauge is considered the true measurement of depth.<strong>Booklet</strong> 7 - <strong>Flow</strong> <strong>Measurement</strong> <strong>Methods</strong> <strong>in</strong> <strong>Open</strong> <strong>Channels</strong> Page 109 of 223
<strong>Flow</strong> measurements can be taken directly <strong>in</strong> the approach section, as long as the measur<strong>in</strong>g device does notcause too much turbulence. If a device causes turbulence, flow measurements must be taken <strong>in</strong> a still<strong>in</strong>gwell connected to the approach section (22) . Still<strong>in</strong>g wells must be <strong>in</strong>stalled accord<strong>in</strong>g to standards prescribed<strong>in</strong> Table 7 of this document.The wells must be large enough to enable <strong>in</strong>stallation and operation of the flowmeter level detector without<strong>in</strong>terference, or the need to clean the still<strong>in</strong>g well.To avoid tak<strong>in</strong>g a measurement <strong>in</strong> a submerged flow, due to backwater, the discharge channel must be largeenough to allow water to be discharged immediately dur<strong>in</strong>g maximum flow.The water level downstream from the weir must always be lower than the height of the weir crest. Anacceptable m<strong>in</strong>imum distance between the water level downstream and the crest is 61 mm (0.2 ft) (2) .3.1.4. Loss of headWeirs are measurement devices that produce the greatest loss of head. Before <strong>in</strong>stall<strong>in</strong>g a weir, it isimportant to check that the rise <strong>in</strong> water level <strong>in</strong> the dra<strong>in</strong>age system will not cause sewers to back up <strong>in</strong>build<strong>in</strong>gs and basements.The follow<strong>in</strong>g formula is used to gauge the rise <strong>in</strong> water level:where:Rh ph 1R p 11= ( h+ h)+(0,2 h)(24)represents the rise of water <strong>in</strong> the section upstream from the weir;represents the crest height of the weir;represents the anticipated maximum water depth at the measur<strong>in</strong>g po<strong>in</strong>t, upstream fromthe weir.The units of measurement generally used are meters or feet.3.1.5. Submerged flowWeirs are designed to operate only <strong>in</strong> free flow conditions. In submerged flow conditions, they will onlyproduce an approximate flow measurement (3) . Weirs should not be used <strong>in</strong> submerged flow conditions.3.1.6. Discharge equation <strong>in</strong> submerged flow conditionsIt is useful to discuss the relevance of this equation because use of this type of measur<strong>in</strong>g device, <strong>in</strong>submerged flow conditions, provides only an approximate <strong>in</strong>dication of the absolute flow and themeasurements that are obta<strong>in</strong>ed are not acceptable.3.1.7. Selection criteriaThe follow<strong>in</strong>g criteria must be considered when select<strong>in</strong>g weirs:Page 110 of 223<strong>Booklet</strong> 7 - <strong>Flow</strong> <strong>Measurement</strong> <strong>Methods</strong> <strong>in</strong> <strong>Open</strong> <strong>Channels</strong>
−−−−−−−the presence of suspended solids <strong>in</strong> effluent;the difference <strong>in</strong> water levels upstream and downstream;the desired precision of measurements;the dimensions and shape of the flow channel;the range of flowrates;<strong>in</strong>stallation difficulties;the tolerated rise <strong>in</strong> water level upstream from the weir.3.1.8. Sources of errorThe follow<strong>in</strong>g sources of error can affect the precision of a weir (22) :− the estimate of coefficient C e (def<strong>in</strong>ed <strong>in</strong> section 3.2.4);− measurement of the length or angle of the weir b e (def<strong>in</strong>ed <strong>in</strong> section 3.2.4);− measurement of water depth (h) <strong>in</strong> the weir;− flow velocity <strong>in</strong> the approach section;− presence of sediment <strong>in</strong> the approach section;− scal<strong>in</strong>g and obstruction of the weir caused by debris;− damage, wear and roughness of the weir;− the water tightness of the weir;− backflow and submerged flow;− <strong>in</strong>sufficient ventilation under the nappe;− round<strong>in</strong>g of the weir crest.3.1.9. Ma<strong>in</strong>tenanceBecause weirs cause solids to deposit, the weir and approach section require regular ma<strong>in</strong>tenance to ensureprecise measurement.The approach section must be free of deposits or plant material that can affect flow.The section downstream from the weir must be free of obstacles that cause backwater and submerged flowconditions.The weir crest must be cleaned of all deposits. Particular care must be taken to thoroughly clean the “V”notch <strong>in</strong> triangular weirs, but to avoid any damage.The frequency of clean<strong>in</strong>g will be largely <strong>in</strong>fluenced by the shape of the weir and the type of effluent.Example: A triangular weir will require more frequent clean<strong>in</strong>g than a rectangular weir. Atriangular weir <strong>in</strong>stalled <strong>in</strong> an effluent that conta<strong>in</strong>s large amounts of solids will require morefrequent clean<strong>in</strong>g than the same type of weir placed <strong>in</strong> an effluent that conta<strong>in</strong>s very few solids.The weir must be checked for leaks (22) .<strong>Booklet</strong> 7 - <strong>Flow</strong> <strong>Measurement</strong> <strong>Methods</strong> <strong>in</strong> <strong>Open</strong> <strong>Channels</strong> Page 111 of 223
The transverse of a weir crest must be checked and adjusted where necessary.The still<strong>in</strong>g well must be cleaned regularly and the calibration of the flowmeter, checked and adjusted ifnecessary.3.1.10. CalibrationTo ensure that a weir produces accurate measurements, it must be calibrated immediately after <strong>in</strong>stallation,and when a deterioration of read<strong>in</strong>gs is suspected or noted (see section 1.12.13).The volumetric method is used only when the follow<strong>in</strong>g conditions are present (5) :− there is a regular-shaped tank, the capacity of which, at different levels, can be measured with 99 %precision;− for each test, the water depth <strong>in</strong> the weir is stable at the measur<strong>in</strong>g po<strong>in</strong>t, that is, it does not vary morethan 3 %.Due to the size of tanks available, this method is generally limited to the size of weirs listed <strong>in</strong> Table 25.The dilution method, us<strong>in</strong>g a salt or tracer chemical, is used when:−−−the measur<strong>in</strong>g weir is too large for use of the volumetric method;the water depth <strong>in</strong> the weir is stable, at the measur<strong>in</strong>g po<strong>in</strong>t, for each test, <strong>in</strong> other words, it does notvary more than 3 %;there is no regular-shape tank, the capacity of which at different levels, can be calibrated precisely.Dur<strong>in</strong>g calibration of the weir, all of the <strong>in</strong>formation relevant to <strong>in</strong>stallation and the weir’s condition mustbe recorded. The calibration procedures and method of measur<strong>in</strong>g water depth <strong>in</strong> the weir and flow fromthe weir must be described <strong>in</strong> detail. All of this <strong>in</strong>formation must be kept as a reference document dur<strong>in</strong>gthe entire period the weir is <strong>in</strong> use.3.1.11. ClassificationA weir is classified as a th<strong>in</strong>-plate weir if the thickness of the crest is 3 mm (1/8 <strong>in</strong>). The name of the weir isderived from its geometric shape.The sections that follow describe the most common types of weirs <strong>in</strong> use.Page 112 of 223<strong>Booklet</strong> 7 - <strong>Flow</strong> <strong>Measurement</strong> <strong>Methods</strong> <strong>in</strong> <strong>Open</strong> <strong>Channels</strong>
TABLE 25 - WEIR CALIBRATION - VOLUMETRIC METHOD - LIMITED DIMENSIONSType of weirMaximum water depthMillimetersFeetTriangular 60° 893 2.93Triangular 90° 716 2.35Rectangular with contractions 0.61 (2’) 811 2.66Rectangular avec contractions 0.762 (2.5’) 643 2.11Rectangular with contractions 0.914 (3’) 549 1.8Rectangular with contractions 1.219 (4’) 436 1.43Rectangular with contractions 1.524 (5’) 369 1.21Rectangular with contractions 1.829 (6’) 323 1.06Rectangular with contractions 2.438 (8’) 265 0.87Rectangular with contractions 3.048 (10’) 229 0.75Rectangular with contractions 0.152 (1.5’) 799 2.62Rectangular with contractions 0.61 (2’) 661 2.17Rectangular with contractions 0.762 (2.5’) 558 1.83Rectangular with contractions 0.914 (3’) 503 1.65Rectangular with contractions 1.219 (4’) 415 1.36Rectangular with contractions 1.524 (5’) 357 1.17Rectangular with contractions 1.829 (6’) 317 1.04Rectangular with contractions 2.438 (8’) 262 0.86Rectangular with contractions 3.048 (10’) 226 0.74Cipolletti 0.152 (1.5’) 796 2.61Cipolletti 0.61 (2’) 655 2.15Cipolletti 0.762 (2.5’) 564 1.85Cipolletti 0.914 (3’) 500 1.64Cipolletti 1.219 (4’) 411 1.35Cipolletti 1.524 (5’) 357 1.17Cipolletti 1.829 (6’) 317 1.04Cipolletti 2.438 (8’) 259 0.85Cipolletti 3.048 (10’) 226 0.74<strong>Booklet</strong> 7 - <strong>Flow</strong> <strong>Measurement</strong> <strong>Methods</strong> <strong>in</strong> <strong>Open</strong> <strong>Channels</strong> Page 113 of 223
3.2. Rectangular weir without contractions3.2.1. DescriptionA weir is said to be without contraction when its sides are shaped by the sides of the canal and when flowcovers the entire width of the channel.It consists of a straight-edge plate, that is placed perpendicular to the flow and that is level horizontally andvertically.3.2.2. DimensionsTo ensure that this type of weir produces accurate flow measurements, standard dimensions must berespected dur<strong>in</strong>g manufactur<strong>in</strong>g and <strong>in</strong>stallation.Figure 20 shows the physical characteristics of a rectangular weir without contraction and the standarddimensions of each one of its parts.In addition to the <strong>in</strong>formation provided <strong>in</strong> Figure 20, it is important to take <strong>in</strong>to account the follow<strong>in</strong>gconsiderations when a weir is manufactured:LengthThe m<strong>in</strong>imum length (b) for this type of weir is 305 mm (1 ft). However, the length of the weirmust be at least twice the maximum measurement height (4) .The standard length of weirs <strong>in</strong>creases <strong>in</strong> <strong>in</strong>crements of 152 mm (0.5 ft) sections for weirssmaller than 914 mm (3 ft), and 305 mm (1 ft) sections for weirs larger than 914 mm (3 ft).Page 114 of 223<strong>Booklet</strong> 7 - <strong>Flow</strong> <strong>Measurement</strong> <strong>Methods</strong> <strong>in</strong> <strong>Open</strong> <strong>Channels</strong>
FIGURE 20 - RECTANGULAR WEIR WITHOUT CONTRACTIONS - PHYSICALCHARACTERISTICSB: width of approach channel – m<strong>in</strong>imum width of 305 mm (1 ft);B: length of weir – length equal to the width of the approach channel;P: crest height – distance between the base of the canal and the weir crest; it is equal to at least twicethe maximum water depth (h max ) <strong>in</strong> the weir;h: water depth <strong>in</strong> the weir, at the measur<strong>in</strong>g po<strong>in</strong>t;Pm:location of the measur<strong>in</strong>g po<strong>in</strong>t – located upstream from the weir, at a distance equal to 4 times themaximum water depth (h max ) <strong>in</strong> the weir.<strong>Booklet</strong> 7 - <strong>Flow</strong> <strong>Measurement</strong> <strong>Methods</strong> <strong>in</strong> <strong>Open</strong> <strong>Channels</strong> Page 115 of 223
For cost reasons, the maximum length for this type of weir generally does not exceed 2.4 m(8 ft).HeightThe m<strong>in</strong>imum and maximum height should be kept respectively at 61 mm (0.2 ft) and 610 mm(2 ft) (4) .The height between the weir crest and bottom of the channel must be at least 305 mm (1 ft).The crest height is an extremely important factor because it is this element that contributes toreduc<strong>in</strong>g the approach velocity.3.2.3. Range of measurementsRectangular weirs without contraction can measure flows between 8.4 l/s (1.9 gal UK /s), for a weir 305 mm(1 ft) long and 61 mm (0.2 ft) high and 10,534 l/s (2,317 gal UK /s) for a weir 3 m (10 ft) long and 1,524 mm(5 ft) high.Table 26 shows the range of recommended flows <strong>in</strong> free flow conditions, for weirs of vary<strong>in</strong>g dimensions.3.2.4. Discharge equation <strong>in</strong> free flow conditionsWater flow <strong>in</strong> a weir is significantly <strong>in</strong>fluenced by the physical characteristics of the weir and the approachchannel. Ideally, the equation should reflect these factors of <strong>in</strong>fluence. In the case of weirs, there is nouniversal equation that can accommodate all factors that control flow or that can apply to all types ofsystems (24) .Page 116 of 223<strong>Booklet</strong> 7 - <strong>Flow</strong> <strong>Measurement</strong> <strong>Methods</strong> <strong>in</strong> <strong>Open</strong> <strong>Channels</strong>
TABLE 26 - RECTANGULAR WEIR WITHOUT CONTRACTION - RECOMMENDEDMINIMUM AND MAXIMUM FLOWRATES IN FREE FLOW CONDITIONSWidth of thenappeM<strong>in</strong>imumdepthM<strong>in</strong>imumflowrateMaximumdepthMaximumflowratem ft mm ft l/s gal UK /s mm ft l/s gal UK /s0.3 1 61 0.2 8.44 1.86 152 0.5 33.41 7.350.5 1.5 61 0.2 12.66 2.78 229 0.75 91.75 20.180.6 2 61 0.2 16.88 3.71 305 1.0 188.6 41.490.8 2.5 61 0.2 21.10 4.64 381 1.25 328.5 72.260.9 3 61 0.2 25.32 5.57 457 1.5 521 114.611.2 4 61 0.2 33.76 7.41 610 2.0 1068 234.831.5 5 61 0.2 42.20 9.28 762 2.5 1863 409.871.8 6 61 0.2 50.64 11.15 1829 3.0 2945 647.822.4 8 61 0.2 67.52 14.82 1219 4.0 6032 1326.83 10 61 0.2 84.40 18.56 1524 5.0 10534 2317.2The Francis equation is a simple equation, that yields an adequate flow measurement with a marg<strong>in</strong> of errorof ± 1 %, where the depth of the water <strong>in</strong> the weir is less than 1/3 the length of the crest. Precision decl<strong>in</strong>esif the ratio between water depth and length of the crest <strong>in</strong>creases {± 1 % marg<strong>in</strong> of error (ratio 1:3) of± 30 % (ratio 1:1)} (2) .The discharge equation, which is the result of the depth/flow relationship associated with free flowconditions, is as follows:3/2Q = Cb h (25)where:QCbhis the flowrate <strong>in</strong> cubic meters or feet per second;is the coefficient (1.8384 for m 3 /s and 3.33 for ft 3 /s);is the length of the weir crest <strong>in</strong> meters or feet;is the water depth measured <strong>in</strong> the weir, <strong>in</strong> meters or feet.<strong>Booklet</strong> 7 - <strong>Flow</strong> <strong>Measurement</strong> <strong>Methods</strong> <strong>in</strong> <strong>Open</strong> <strong>Channels</strong> Page 117 of 223
Use of the K<strong>in</strong>dsvater-Carter equation, which is considered more accurate than the Francis equation, isbeg<strong>in</strong>n<strong>in</strong>g to become more common, particularly if the water depth <strong>in</strong> the weir is greater than 1/3 the lengthof the crest (20) . The equation is as follows:Q = 2/32g(0.602+0.075h/P )(b − 0.001)(h+0.001 )3/2(26)The equation can be reduced to the follow<strong>in</strong>g form (6) :3/2Q e e e= Cbh(27)Where:Q is flowrate <strong>in</strong> cubic meters and cubic feet per second;C e is the coefficient (1.8876 + 0.4 h/P for m 3 /s and 3.4186 + 0.4 h/P for ft 3 /s;b is the length of the weir crest <strong>in</strong> meters or feet;b e is the effective length of the weir crest <strong>in</strong> meters (b – 0.001) (20) or <strong>in</strong> feet (b - 0.003) (6) ;h is the water depth measured <strong>in</strong> the weir, <strong>in</strong> meters or feet, at the measur<strong>in</strong>g po<strong>in</strong>t;h e is the effective water depth <strong>in</strong> meters (h + 0.001) or <strong>in</strong> feet (h + 0.003);P is the crest height <strong>in</strong> meters or feet.This equation is more advantageous because it <strong>in</strong>cludes the flow velocity <strong>in</strong> the approach section. Thisfactor therefore does not have to be taken <strong>in</strong>to account when results are compiled.3.2.5. PrecisionIn free flow conditions, the precision of measurements us<strong>in</strong>g a rectangular weir with no contraction issimilar to that of flumes. In laboratory conditions, the marg<strong>in</strong> of error for this type of weir is between ± 1.5and ± 2 % (3) .In the field, this type of weir can produce, under ideal <strong>in</strong>stallation conditions, measurements with a 5 %error (23) . Effective control of the approach velocity is extremely important, however, because an approachvelocity that is too strong can <strong>in</strong>crease the measurement error to over 20 % (6) .3.2.6. CorrectionsSubmerged flowIf a weir is operat<strong>in</strong>g <strong>in</strong> submerged flow conditions, the only way to remedy the situation is tomodify measurement systems or simply change the type of measur<strong>in</strong>g device, to create freeflow conditions.Page 118 of 223<strong>Booklet</strong> 7 - <strong>Flow</strong> <strong>Measurement</strong> <strong>Methods</strong> <strong>in</strong> <strong>Open</strong> <strong>Channels</strong>
Inadequate approach velocityThe approach velocity can be corrected simply by <strong>in</strong>creas<strong>in</strong>g the weir’s crest height. If thischange cannot be made due to the systems present, use of the K<strong>in</strong>dsvater-Carter equation isrecommended, because it takes the approach velocity <strong>in</strong>to account.If the Francis equation is used, the approach velocity can be corrected by replac<strong>in</strong>g h 3/2 <strong>in</strong> theequation, with equation 25 (6) :3/2(h c3/2+hc ) − h(28)The equation therefore becomes as follows (6) :3/2Qc = Cb[(h+ hc) − h3/2c](29)where:Q c is the corrected flowrate <strong>in</strong> m 3 /s or ft 3 /s;C is the coefficient (1.8384 for m 3 /s and 3.33 for ft 3 /s);b is the length of the weir crest <strong>in</strong> meters or feet;h is the water depth measured <strong>in</strong> meters or feet;h c is V 2 /2g;V is the velocity measured <strong>in</strong> m/s or <strong>in</strong> ft/s;g is the gravitational constant <strong>in</strong> m/s 2 or ft/s 2 .<strong>Booklet</strong> 7 - <strong>Flow</strong> <strong>Measurement</strong> <strong>Methods</strong> <strong>in</strong> <strong>Open</strong> <strong>Channels</strong> Page 119 of 223
3.3. Rectangular weir with contractionsA rectangular weir with contractions is a weir where the open<strong>in</strong>g is smaller than the channel <strong>in</strong> which is itplaced.3.3.1. DescriptionThis type of weir is built with a rectangular open<strong>in</strong>g and is placed <strong>in</strong> the centre of the channel. It is a sharpcrestedweir, placed perpendicular to the direction of flow and is horizontally and vertically level.3.3.2. DimensionsTo ensure that this type of weir produces accurate flow measurements, standard dimensions must berespected when it is manufactured and dur<strong>in</strong>g <strong>in</strong>stallation.Figure 21 shows the physical characteristics of a rectangular weir with contractions and the standarddimensions of each part.In addition to the <strong>in</strong>formation provided <strong>in</strong> Figure 21, it is important to take the follow<strong>in</strong>g <strong>in</strong>to account whena weir is manufactured:lengthThe m<strong>in</strong>imum length (b) for this type of weir is 305 mm (1 ft), however, the length of the weirmust be at least twice the maximum measurement height (h max ) (4) .The length of weirs (b) <strong>in</strong>creases <strong>in</strong> <strong>in</strong>crements of 152 mm (0.5 ft) sections, for weirs under914 mm (3 ft), and by 305 mm (1 ft) sections, for weirs over 914 mm (3 ft).Page 120 of 223<strong>Booklet</strong> 7 - <strong>Flow</strong> <strong>Measurement</strong> <strong>Methods</strong> <strong>in</strong> <strong>Open</strong> <strong>Channels</strong>
FIGURE 21 - RECTANGULAR WEIR WITH CONTRACTIONS - PHYSICALCHARACTERISTICSB: width of approach channel – m<strong>in</strong>imum width of 305 mm (1 ft);b: length of weir – m<strong>in</strong>imum length of 305 mm (1 ft);P: crest height – distance between the bottom of the canal and the weir crest; is equal to at least twicethe maximum water depth (h max ) <strong>in</strong> the weir;h: water depth <strong>in</strong> the weir, at the measur<strong>in</strong>g po<strong>in</strong>t;Pm: location of the measur<strong>in</strong>g po<strong>in</strong>t - located upstream from the weir, at a distance equal to at least 4times the maximum water depth (h max ) <strong>in</strong> the weir;c: side contractions – equal to at least twice the maximum water depth (h max ) <strong>in</strong> the weir, 305 mm(1 ft) m<strong>in</strong>imum.<strong>Booklet</strong> 7 - <strong>Flow</strong> <strong>Measurement</strong> <strong>Methods</strong> <strong>in</strong> <strong>Open</strong> <strong>Channels</strong> Page 121 of 223
For cost reasons, the maximum length for this type of weir usually does not exceed 2.4 m(8 ft).The length of side contractions (c) should never be less than 305 mm (1 ft).heightThe m<strong>in</strong>imum and maximum height measurement should preferably be ma<strong>in</strong>ta<strong>in</strong>edrespectively at 61 mm (0.2 ft) and 610 mm (2 ft) (4) .The height between the weir crest and bottom of the channel (P) must be at least 305 mm(1 ft). The crest height is an extremely important factor because it is this element thatcontributes to reduc<strong>in</strong>g the approach velocity.3.3.3. Range of measurementsRectangular weirs with contractions can measure flows between 8.1 l/s (1.8 gal UK /s) for a weir 305 mm(1 ft) <strong>in</strong> length and 61 mm (0.2 ft) height, and 9,486 l/s (2,087 gal UK /s) for a weir 3 m (10 ft) long and1,524 mm (5 ft) high.Table 27 shows the recommended range of measurements <strong>in</strong> free flow conditions, for weirs of vary<strong>in</strong>gdimensions.3.3.4. Discharge equation <strong>in</strong> free flow conditionsWater flow <strong>in</strong> a weir is significantly <strong>in</strong>fluenced by the physical characteristics of the weir and the approachchannel. Ideally, the equation should reflect these factors of <strong>in</strong>fluence. In the case of weirs, there is nouniversal equation that can accommodate all factors that control flow or that can apply to all types ofsystems (24) .The Francis equation is the discharge equation that is generally used for the depth/flow relationshipassociated with free flow conditions. The equation is expressed as follows:Q3/2= C(b − 0. 1nh)h (30)where:QCbnhis the flowrate <strong>in</strong> cubic meters or cubic feet per second;is the coefficient (1.8384 for m 3 /s and 3.33 for ft 3 /s);is the length of the weir crest <strong>in</strong> meters or feet;is the number of contractions;is the water depth measured <strong>in</strong> the weir <strong>in</strong> meters or feet.Page 122 of 223<strong>Booklet</strong> 7 - <strong>Flow</strong> <strong>Measurement</strong> <strong>Methods</strong> <strong>in</strong> <strong>Open</strong> <strong>Channels</strong>
The K<strong>in</strong>dsvater-Carter equation takes <strong>in</strong>to account the properties of the liquid. Because the weir hascontractions, a different coefficient is used to <strong>in</strong>clude the effect of the width of the weir compared to thewidth of the canal. The value of the effective length of the crest (b e ) is also different (20) . This equation is asfollows:Q= Cg(1−0.0035hP)(b+0.0025)(h+0.001 )3/2(31)where:Q is the flowrate <strong>in</strong> m 3 or ft 3 /s;C is the coefficient (0.554 for m 3 /s and 0.560 for ft 3 /s);g is gravity <strong>in</strong> m/s 2 or ft/s 2 ;b is the length of the weir crest <strong>in</strong> meters or feet;h is the water depth measured <strong>in</strong> the weir <strong>in</strong> meters or feet;P is the crest height <strong>in</strong> meters or feet.<strong>Booklet</strong> 7 - <strong>Flow</strong> <strong>Measurement</strong> <strong>Methods</strong> <strong>in</strong> <strong>Open</strong> <strong>Channels</strong> Page 123 of 223
TABLE 27 - RECTANGULAR WEIR WITH CONTRACTIONS - RECOMMENDEDMINIMUM AND MAXIMUM FLOWRATES IN FREE FLOW CONDITIONSWidth of thenappeM<strong>in</strong>imumdepthM<strong>in</strong>imumflowrateMaximumdepthMaximumflowratem ft mm ft l/s gal UK /s mm ft l/s gal UK /s0.3 1 61 0.2 8.1 1.78 152 0.5 30 6.60.5 1.5 61 0.2 12.32 2.71 229 0.75 82.7 18.190.6 2 61 0.2 16.54 3.64 305 1.0 169.6 37.30.8 2.5 61 0.2 20.76 4.57 381 1.25 297.3 65.40.9 3 61 0.2 24.98 5.49 457 1.5 467.2 102.781.2 4 61 0.2 33.41 7.35 610 2.0 960 211.161.5 5 61 0.2 41.91 9.22 762 2.5 1676 368.721.8 6 61 0.2 50.12 11.03 1829 3.0 2645 581.82.4 8 61 0.2 67.11 14.76 1219 4.0 5437 11963 10 61 0.2 84.10 18.5 1524 5.0 9486 2086.7Page 124 of 223<strong>Booklet</strong> 7 - <strong>Flow</strong> <strong>Measurement</strong> <strong>Methods</strong> <strong>in</strong> <strong>Open</strong> <strong>Channels</strong>
3.3.5. PrecisionIn free flow conditions, a rectangular weir with contractions produces a precision similar to that of flumes.Laboratory tests with this type of weir show a marg<strong>in</strong> for error of approximately ± 1.5 to 2 % (3) .In the field, under ideal <strong>in</strong>stallation conditions, this weir can produce measurements with a marg<strong>in</strong> of errorof ± 5 % (22) . Proper control of the approach velocity is very important, however, because an approachvelocity that is too fast can <strong>in</strong>crease the error for measurement above 20 % (6) .3.3.6. CorrectionsSubmerged flowIf a weir is operat<strong>in</strong>g <strong>in</strong> submerged flow conditions, the only way to remedy the situation is tochange the measurement systems or simply change the type of device, to create free flowconditions.Inadequate approach velocityThe approach velocity can be corrected by <strong>in</strong>creas<strong>in</strong>g only the crest height of the weir. If thecrest height cannot be <strong>in</strong>creased due to the type of <strong>in</strong>stallation present, use of the K<strong>in</strong>dsvater-Carter equation is recommended.If the Francis equation is used, it is possible to correct for the approach velocity by replac<strong>in</strong>gh 3/2 <strong>in</strong> the equation with:3/2 3/2(h c ) c+ h− h(32)The equation therefore becomes (6) :3/2 3/2Q = C(b − 0. 1nh)[(h+ hc) − hc] (33)cwhere:Q c is the corrected flowrate <strong>in</strong> m 3 /s or ft 3 /s;C is the coefficient (0.554 for m 3 /s and 0.560 for ft 3 /s);b is the length of the weir crest <strong>in</strong> meters or feet;h is the water depth measured <strong>in</strong> meters or feet;h c is V 2 /2g;V is the velocity measured <strong>in</strong> m/s or ft/s;g is the gravity constant <strong>in</strong> m/s 2 or ft/s 2 .<strong>Booklet</strong> 7 - <strong>Flow</strong> <strong>Measurement</strong> <strong>Methods</strong> <strong>in</strong> <strong>Open</strong> <strong>Channels</strong> Page 125 of 223
Length of contractionsIf side contractions do not comply with standard manufactur<strong>in</strong>g dimensions, an error results <strong>in</strong> the flowmeasurement, which can be corrected by chang<strong>in</strong>g a few parameters <strong>in</strong> the K<strong>in</strong>dsvater-Carter equation.The equation is therefore as follows (20) :Q = Cg(1+ ah/P )(b+ k)(h+0.001 )3/2(34)where:Q is the flowrate <strong>in</strong> m 3 /s or ft 3 /s;C is the variable coefficient as a function of the b/B ratio; where b and B are respectively thewidths of the weir and approach channel;b is the length of the weir crest <strong>in</strong> meters or feet;h is the water depth measured <strong>in</strong> meters or feet;g is gravity <strong>in</strong> m/s 2 or ft/s 2 ;a is the variable coefficient as a function of the b/B ratio; where b and B are respectively thewidths of the weir and the approach channel;k is the variable coefficient as a function of the b/B ratio; that is, the ratio between the widthof the weir (b) and width of the approach channel (B);P is the crest height <strong>in</strong> meters or feet.The values of coefficients “a”, “C” and “k” are shown <strong>in</strong> Table 28.Page 126 of 223<strong>Booklet</strong> 7 - <strong>Flow</strong> <strong>Measurement</strong> <strong>Methods</strong> <strong>in</strong> <strong>Open</strong> <strong>Channels</strong>
TABLE 28 - RECTANGULAR WEIR WITH CONTRACTIONS - COEFFICIENTS “a”, “C”AND “k”b/B ratioa C kmeters feet meters feet meters feet0.9 0.107 0.351 0.564 0.507 0.0038 0.01250.8 0.076 0.249 0.562 0.520 0.0042 0.01380.7 0.050 0.164 0.560 0.532 0.0040 0.01310.6 0.030 0.098 0.559 0.543 0.0035 0.01150.5 0.022 0.072 0.558 0.546 0.0030 0.00980.4 0.020 0.066 0.557 0.552 0.0027 0.00890.3 0.003 0.010 0.556 0.556 0.0025 0.00820.2 - 0.0 -0.003 -0.010 0.555 0.559 0.0025 0.0082b/B = ratio between the width of the weir (b) and the width of the approach channel (B).<strong>Booklet</strong> 7 - <strong>Flow</strong> <strong>Measurement</strong> <strong>Methods</strong> <strong>in</strong> <strong>Open</strong> <strong>Channels</strong> Page 127 of 223
3.4. Trapezoidal weir (Cipolletti)A trapezoidal weir (Cipolletti) is similar <strong>in</strong> all respects to a rectangular weir with contractions, except thatthe side edges are sloped (1:4).3.4.1. DescriptionA trapezoidal weir consists of a converg<strong>in</strong>g open<strong>in</strong>g that slopes downward. The weir is placed <strong>in</strong> the centreof the channel, allow<strong>in</strong>g water to move through and enabl<strong>in</strong>g measurements of the amount of water mov<strong>in</strong>gthrough. It is a sharp-crested weir, with sloped sides that is placed perpendicular to the direction of flow andis horizontally and vertically level (4) .3.4.2. DimensionsTo ensure that this type of weir produces accurate flow measurements, standard dimensions must berespected dur<strong>in</strong>g manufactur<strong>in</strong>g and <strong>in</strong>stallation.Figure 22 shows the physical characteristics of a trapezoidal weir and the dimensions of each of its parts.In addition to the <strong>in</strong>formation provided <strong>in</strong> Figure 22, the follow<strong>in</strong>g considerations must be exam<strong>in</strong>ed:The length of the weir crest (b) must be at least twice the maximum water depth <strong>in</strong> the weir(h max ).The m<strong>in</strong>imum and maximum depth, at the measur<strong>in</strong>g po<strong>in</strong>t, should ideally be ma<strong>in</strong>ta<strong>in</strong>ed at61 mm (0.2 ft) and 610 mm (2 ft) respectively (4) .The length of side contractions must never be less than 305 mm (1 ft) and the slope angle ofcrests is 14.04° (ratio of the length of sides 1:4).Page 128 of 223<strong>Booklet</strong> 7 - <strong>Flow</strong> <strong>Measurement</strong> <strong>Methods</strong> <strong>in</strong> <strong>Open</strong> <strong>Channels</strong>
FIGURE 22 - TRAPEZOIDAL WEIR (CIPOLLETTI) - PHYSICAL CHARACTERISTICSB: width of approach channel – m<strong>in</strong>imum width of 305 mm (1 ft);b: length of weir – m<strong>in</strong>imum length of 305 mm (1 ft);P: crest height – distance between the channel bottom and the weir crest; it is also at least twice themaximum water depth (h max ) <strong>in</strong> the weir;h: water depth <strong>in</strong> the weir, at the measur<strong>in</strong>g po<strong>in</strong>t;Pm: location of the measur<strong>in</strong>g po<strong>in</strong>t - located upstream from the weir, at a distance equal to at least 4times the maximum water depth (h max ) that may be measured <strong>in</strong> the weir;c: side contractions – equal to at least twice the maximum water depth (h max ) <strong>in</strong> the weir, 305 mm(1 ft) m<strong>in</strong>imum.<strong>Booklet</strong> 7 - <strong>Flow</strong> <strong>Measurement</strong> <strong>Methods</strong> <strong>in</strong> <strong>Open</strong> <strong>Channels</strong> Page 129 of 223
3.4.3. Range of measurementsTrapezoidal weirs (Cipolletti) can measure flowrates between 8.5 l/s (1.9 gal UK /s) for a weir 305 mm (1 ft)<strong>in</strong> length and 61 mm (0.2 ft) high, and 10 619 l/s (2,336 gal UK /s) for a weir 3 m (10 ft) long and 1,524 mm(5 ft) high.Table 29 shows the recommended measur<strong>in</strong>g range <strong>in</strong> free flow conditions, for different sizes of trapezoidalweirs.3.4.4. Discharge equation <strong>in</strong> free flow conditionsThe physical characteristics of a weir and the approach channel significantly affect water flow <strong>in</strong> the weir.Ideally, the discharge equation should accommodate all of these factors. For this type of weir, there is nouniversal equation that accommodates all of the factors that govern flow and that can apply to all types ofsystems.The discharge equation result<strong>in</strong>g from the depth/flow relationship <strong>in</strong> free flow conditions is as follows:3/2Q = Cbh(35)where:QCbhis the flowrate <strong>in</strong> cubic meters or cubic feet per second;is the coefficient (1.859 for m 3 /s and 3.367 for ft 3 /s);is the length of the weir crest <strong>in</strong> meters or feet;is the water depth <strong>in</strong> meters or feet, at the measur<strong>in</strong>g po<strong>in</strong>t.Page 130 of 223<strong>Booklet</strong> 7 - <strong>Flow</strong> <strong>Measurement</strong> <strong>Methods</strong> <strong>in</strong> <strong>Open</strong> <strong>Channels</strong>
TABLE 29 - TRAPEZOIDAL WEIR (CIPOLLETTI) - RECOMMENDED MINIMUM ANDMAXIMUM FLOWRATES IN FREE FLOW CONDITIONSWidth of nappeM<strong>in</strong>imumdepthM<strong>in</strong>imumflowMaximumdepthMaximumflowm ft mm ft l/s gal UK /s mm ft l/s gal UK /s0.3 1 61 0.2 8.52 1.87 152 0.5 33.7 7.410.5 1.5 61 0.2 12.8 2.82 229 0.75 92.88 20.430.6 2 61 0.2 17.05 3.75 305 1.0 190.6 41.920.8 2.5 61 0.2 21.32 4.69 381 1.25 334.1 73.50.9 3 61 0.2 25.57 5.62 457 1.5 526.7 115.91.2 4 61 0.2 33.98 7.47 610 2.0 1079 237.31.5 5 61 0.2 42.76 9.41 762 2.5 1883 414.21.8 6 61 0.2 51.25 11.27 1829 3.0 2973 6542.4 8 61 0.2 68.24 15.01 1219 4.0 6060 13333 10 61 0.2 85.23 18.75 1524 5.0 10619 2335.9<strong>Booklet</strong> 7 - <strong>Flow</strong> <strong>Measurement</strong> <strong>Methods</strong> <strong>in</strong> <strong>Open</strong> <strong>Channels</strong> Page 131 of 223
3.4.5. PrecisionIn free flow conditions, measurements made with a trapezoidal weir are less accurate than other types ofmeasurement weirs (2) .In the field, this type of weir can produce, under ideal <strong>in</strong>stallation conditions, measurements with a marg<strong>in</strong>of error of ± 5 to ± 7 % (22) . Proper control of the approach velocity is very important however, because toogreat a velocity of approach can raise the marg<strong>in</strong> for error to over 30 % (6) .3.4.6. CorrectionsSubmerged flowWhen a weir is operat<strong>in</strong>g <strong>in</strong> submerged flow conditions, the only way to correct the situation isto change the setup, or simply change the type of measur<strong>in</strong>g device, to produce free flowconditions.Inadequate approach velocityThe approach velocity can be corrected simply by vary<strong>in</strong>g the crest height of the weir. If thecrest height cannot be <strong>in</strong>creased due to the manner <strong>in</strong> which the weir has been <strong>in</strong>stalled, theapproach velocity can be corrected by replac<strong>in</strong>g “h 3/2 ” <strong>in</strong> equation 35 with (2) :(h+1.5hc)3/2(36)The equation therefore becomes:Q = Cb(h+1.5 hc)c3/2(37)where:Q cis the corrected flowrate <strong>in</strong> m 3 /s or ft 3 /s;C is the coefficient (1.8384 for m 3 /s and 3.33 for ft 3 /s);b is the length of the weir crest <strong>in</strong> meters or feet, at the measur<strong>in</strong>g po<strong>in</strong>t;h is the water depth measured <strong>in</strong> meters or feet;h c is V 2 /2g;V is the velocity measured <strong>in</strong> m/s or ft/s;g is the gravity <strong>in</strong> m/s 2 or ft/s 2 .Page 132 of 223<strong>Booklet</strong> 7 - <strong>Flow</strong> <strong>Measurement</strong> <strong>Methods</strong> <strong>in</strong> <strong>Open</strong> <strong>Channels</strong>
Length of contractionsIf side contractions do not comply with manufactur<strong>in</strong>g dimensions, this will cause a flowmeasurement error. None of the documents cited provides a method that takes this factor <strong>in</strong>toaccount.To obta<strong>in</strong> an accurate flow measurement, it is important to ensure that the weir complies withstandards. If the weir cannot be modified, it should be calibrated accord<strong>in</strong>g to the volumetricmethod or dilution method.3.5. Triangular weirA triangular weir is the most simple and most common type of weir.3.5.1. DescriptionA triangular weir has a vertical V-notch <strong>in</strong> a th<strong>in</strong> plate and is placed <strong>in</strong> the centre of the flow channel. It is asharp-crested weir that is placed perpendicular to flow.The most common weirs are 90° weirs, for larger flow measurements, and 45° weirs for medium-rangeflow measurements. In certa<strong>in</strong> situations, 60° weirs are used for <strong>in</strong>termediate to larger flows, and 30° or22.5° weirs are used for very small flows.3.5.2. DimensionsIn order for a triangular weir to produce accurate flow measurements, standard dimensions must berespected dur<strong>in</strong>g manufactur<strong>in</strong>g and <strong>in</strong>stallation.Figure 23 shows the physical characteristics of a triangular weir and the dimensions of each of its parts.<strong>Booklet</strong> 7 - <strong>Flow</strong> <strong>Measurement</strong> <strong>Methods</strong> <strong>in</strong> <strong>Open</strong> <strong>Channels</strong> Page 133 of 223
FIGURE 23 - TRIANGULAR WEIR - PHYSICAL CHARACTERISTICSB: width of approach channel – m<strong>in</strong>imum width of 305 mm (1 ft);α: weir angle;P: crest height - distance between the channel bottom and the weir crest; it is equal to at least twice themaximum water depth (h max ) <strong>in</strong> the weir;h: water depth <strong>in</strong> the reservoir, at the measur<strong>in</strong>g po<strong>in</strong>t;Pm: location of the measur<strong>in</strong>g po<strong>in</strong>t – located upstream from the weir, at a distance equal to at least 4times the maximum water depth (h max ) <strong>in</strong> the weir;C: side contractions – equal to at least twice the maximum water depth (h max ) <strong>in</strong> the weir, 305 mm(1 ft) m<strong>in</strong>imum.Page 134 of 223<strong>Booklet</strong> 7 - <strong>Flow</strong> <strong>Measurement</strong> <strong>Methods</strong> <strong>in</strong> <strong>Open</strong> <strong>Channels</strong>
In addition to the <strong>in</strong>formation provided <strong>in</strong> Figure 23, the follow<strong>in</strong>g considerations must be exam<strong>in</strong>ed.The m<strong>in</strong>imum and maximum depth at the measur<strong>in</strong>g po<strong>in</strong>t should be ma<strong>in</strong>ta<strong>in</strong>ed at 61 mm (0.2 ft)and 610 mm (2 ft) respectively (4) .The length of side contractions (c) should never be less than 305 mm (1 ft).The bisect<strong>in</strong>g l<strong>in</strong>e of the angle of the notch must be vertical and at an equal distance from the sidesof the flow channel (25) .3.5.3. Range of measurementsTriangular weirs can measure flowrates between 0.252 l/s (0.055 gal UK /s), for a 22.5° weir that is 61 mm(0.2 ft) high, and 400.4 l/s (88.1 gal UK /s), for a 90° weir that is 610 mm (2 ft) high. This type of weir is anexcellent <strong>in</strong>strument for measur<strong>in</strong>g small flows (6) .Table 30 shows the recommended range of measurements <strong>in</strong> free flow conditions, for different sizes oftriangular weirs.3.5.4. Discharge equation <strong>in</strong> free flow conditionsThe physical characteristics of a weir and the approach channel significantly affect water flow <strong>in</strong> the weir.Ideally, the discharge equation should take all of these factors <strong>in</strong>to account. For this type of weir, there is nouniversal equation that accommodates all of the factors that govern flow or that can apply to all types ofsystems (24) .<strong>Booklet</strong> 7 - <strong>Flow</strong> <strong>Measurement</strong> <strong>Methods</strong> <strong>in</strong> <strong>Open</strong> <strong>Channels</strong> Page 135 of 223
TABLE 30 - TRIANGULAR WEIR - RECOMMENDED MINIMUM AND MAXIMUMFLOWRATES IN FREE FLOW CONDITIONSAngle of weirM<strong>in</strong>imumdepthM<strong>in</strong>imumflowrateMaximumdepthMaximumflowrateDegrees mm ft l/s gal UK /s mm ft l/s gal UK /s22.5 61 0.2 0.252 0.055 610 2.0 79.6 17.5130 61 0.2 0.343 0.075 610 2.0 108.3 23.8245 61 0.2 0.524 0.115 610 2.0 165.8 36.4760 61 0.2 0.731 0.161 610 2.0 231.2 50.8590 61 0.2 1.266 0.278 610 2.0 400.4 88.08Page 136 of 223<strong>Booklet</strong> 7 - <strong>Flow</strong> <strong>Measurement</strong> <strong>Methods</strong> <strong>in</strong> <strong>Open</strong> <strong>Channels</strong>
The discharge equation result<strong>in</strong>g from the depth/flow relationship <strong>in</strong> free flow conditions is as follows (23) :5/2Q = C(8/15) 2g( tan θ /2 )h(38)where:Q is the flowrate <strong>in</strong> m 3 /s or ft 3 /s;C is the coefficient f (h/P,P/B,θ);h is water depth <strong>in</strong> meters or feet;P is the crest height <strong>in</strong> meters or feet;B is the width of the approach channel <strong>in</strong> meters or feet;θ is the angle of the weir;g is the gravitational constant <strong>in</strong> m/s 2 or ft/s 2 .If the weir angle is accurate, the equation can be solved by comb<strong>in</strong><strong>in</strong>g all of the constants <strong>in</strong>to onecoefficient “C”. The formula is as follows (4) :1 5/2Q= Ch(39)where:QC 1his the flowrate <strong>in</strong> m 3 /s or ft 3 /s;is the coefficient, the value of which varies accord<strong>in</strong>g to the angle of the weir andunit of measurement;is the water depth <strong>in</strong> the weir <strong>in</strong> meters or feet.Table 31 shows the values of coefficient “C 1 ”, accord<strong>in</strong>g to the angle of the weir and the system ofmeasurement <strong>in</strong> use.<strong>Booklet</strong> 7 - <strong>Flow</strong> <strong>Measurement</strong> <strong>Methods</strong> <strong>in</strong> <strong>Open</strong> <strong>Channels</strong> Page 137 of 223
TABLE 31 - TRIANGULAR WEIR - VALUE OF COEFFICIENT “C 1 ”Angle of the weirMetric systemValue of coefficient “C 1 ”Imperial systemDegree m 3 /d l/s ft 3 /s gal UK /s22.5 23,668 273.94 0.497 3.09630 32,192 372.6 0.676 4.21145 49,289 570.5 1.035 6.44760 68,719 795.4 1.443 8.98890 119,052 1377.9 2.5 15.5723.5.5. PrecisionIn free flow conditions, a triangular weir is more precise then other types of weirs (2) . In the laboratory, theerror for flow measure is between 1 and 2 % (3) . In the field, measurements with this type of weir produce a± 2 to ± 5 % marg<strong>in</strong> of error, under optimum <strong>in</strong>stallation conditions (22) . Proper control of the approachvelocity is very important however, because too great a velocity of approach can raise the marg<strong>in</strong> for errorto over 30 (6) .3.5.6. CorrectionsSubmerged flowWhen a weir is operat<strong>in</strong>g <strong>in</strong> submerged flow conditions, the only way to correct the situation isto change the setup, or simply change the type of measur<strong>in</strong>g device, to produce free flowconditions.Inadequate approach velocityThe approach velocity can be corrected simply by vary<strong>in</strong>g the crest height of the weir.If a weir is <strong>in</strong>stalled with standard side contractions (C ≥ 2 h max ), the approach speed is usuallyslow and adequate.Length of contractionsIf side contractions do not comply with manufactur<strong>in</strong>g dimensions, this will cause a flowmeasurement error. None of the reference documents consulted <strong>in</strong>cludes a method that takesthis factor <strong>in</strong>to account.Page 138 of 223<strong>Booklet</strong> 7 - <strong>Flow</strong> <strong>Measurement</strong> <strong>Methods</strong> <strong>in</strong> <strong>Open</strong> <strong>Channels</strong>
3.6. Comb<strong>in</strong>ed weirTo obta<strong>in</strong> a precise flow measurement, it is important to construct a weir accord<strong>in</strong>g tostandards. If a weir cannot be modified, it must be calibrated accord<strong>in</strong>g to the volumetric ordilution method.A comb<strong>in</strong>ed weir is used <strong>in</strong> special situations, where another measur<strong>in</strong>g device is not suitable for measur<strong>in</strong>ganticipated flows. Although it may consist of a variety of geometric shapes, it is usually the comb<strong>in</strong>ation ofa rectangular weir and a V-notch weir.The paragraphs that follow discuss the comb<strong>in</strong>ation of a 90° V-notch weir and rectangular weir withcontractions. The result<strong>in</strong>g device is considered to be a standard comb<strong>in</strong>ed weir.3.6.1. DescriptionA comb<strong>in</strong>ed weir is a rectangular weir with a 90° V-notch, that is symmetrical and has a V-notch <strong>in</strong> thecentre of the crest. It consists of a th<strong>in</strong> plate, that is placed vertically <strong>in</strong> the centre of a flow channel. It is asharp-crested weir, that is placed perpendicular to flow.3.6.2. DimensionsThere are no clearly def<strong>in</strong>ed manufactur<strong>in</strong>g standards for this type of weir. Each component, however,should be constructed accord<strong>in</strong>g to conventional manufactur<strong>in</strong>g standards for rectangular weirs withcontractions and 90° triangular weirs. The depth of a triangular weir and rectangular weir may varyaccord<strong>in</strong>g to contractions, based on measur<strong>in</strong>g needs. Figure 24 shows the physical characteristics of acomb<strong>in</strong>ed weir (rectangular-triangular) and the dimensions of each of its parts.<strong>Booklet</strong> 7 - <strong>Flow</strong> <strong>Measurement</strong> <strong>Methods</strong> <strong>in</strong> <strong>Open</strong> <strong>Channels</strong> Page 139 of 223
FIGURE 24 - COMBINED WEIR - PHYSICAL CHARACTERISTICSB: width of approach channel – m<strong>in</strong>imum width of 610 mm (2 ft);b: length of the weir – m<strong>in</strong>imum length of 305 mm (1 ft);θ: angle of the weir;P: crest height – equal to at least twice the maximum water depth (h max ) <strong>in</strong> the weir;h: water depth <strong>in</strong> the weir – depth of measurement;Pm:location of the measur<strong>in</strong>g po<strong>in</strong>t – located upstream from the weir, at a distance equal to at least4 times the maximum water depth (h max ) <strong>in</strong> the weir;C: side contractions of a rectangular weir – equal to twice the maximum water depth (h max ) <strong>in</strong> the weir;C1: side contractions of a triangular weir – equal to twice the maximum water depth (h max ), suppos<strong>in</strong>gthat this weir operates alone.Page 140 of 223<strong>Booklet</strong> 7 - <strong>Flow</strong> <strong>Measurement</strong> <strong>Methods</strong> <strong>in</strong> <strong>Open</strong> <strong>Channels</strong>
In addition to the <strong>in</strong>formation provided <strong>in</strong> Figure 24, the follow<strong>in</strong>g considerations must be exam<strong>in</strong>ed.Side contractions (C and C 1 ) should never be less than 305 mm (1 ft) <strong>in</strong> length.The bisect<strong>in</strong>g l<strong>in</strong>e of the angle of the notch must be vertical and at an equal distance from thesides of the rectangular weir and flow channel.3.6.3. Range of measurementsComb<strong>in</strong>ed weirs can be used to measure a wide range of flows. However, only two flow ranges arerecommended: a range between 0.2 and 0.8 the height of the triangular weir and a range between 0.2 and0.8 the height of the rectangular weir. The zone between 0.8 the height of the triangular weir and 0.2 theheight of the rectangular weir should therefore be considered the transition zone, and flows <strong>in</strong> this areashould be ignored and deemed <strong>in</strong>accurate.The follow<strong>in</strong>g figure shows the transition zone deemed to be <strong>in</strong>accurate:<strong>Booklet</strong> 7 - <strong>Flow</strong> <strong>Measurement</strong> <strong>Methods</strong> <strong>in</strong> <strong>Open</strong> <strong>Channels</strong> Page 141 of 223
Example: Suppose that a comb<strong>in</strong>ed weir with a triangular section 457 mm (1.5 ft) high and a rectangularsection, 914 mm (3 ft), is used. The sections that can be used for measurement are therefore those between91 mm (0.3 ft) and 366 mm (1.2 ft), <strong>in</strong> the case of the triangular weir, and between 183 mm (0.6 ft) and732 mm (2.4 ft), <strong>in</strong> the case of the rectangular weir.If this type of weir is used, it is important to ensure first that the measurement period <strong>in</strong> the transition zonewill be very brief, to ensure as accurate a measurement as possible.S<strong>in</strong>ce this weir is a comb<strong>in</strong>ation of two weirs that can vary significantly <strong>in</strong> size, it is difficult to draft a tableof recommended m<strong>in</strong>imum and maximum flowrates <strong>in</strong> free flow conditions. The reader should refer totables shown <strong>in</strong> the sections that apply to the type of weir selected.3.6.4. Discharge equation <strong>in</strong> free flow conditionsUse of a comb<strong>in</strong>ed weir as a method of flow measurement has been the subject of very little laboratory andfield research. The discharge equation that is shown was therefore formulated on the basis of a limitednumber of tests (2) .The result<strong>in</strong>g discharge equation for the depth/flow relationship <strong>in</strong> free flow conditions, is as follows (2) :.1. 5Q 1 72− t r= Chd + ebh(40)where:QCh tdh rebis the flowrate <strong>in</strong> m 3 /s or ft 3 /s;constant (5.2 <strong>in</strong> metric measurements, or 3.9 <strong>in</strong> imperial measurements);is the water depth <strong>in</strong> meters or feet <strong>in</strong> the triangular section;constant (0.04 <strong>in</strong> metric measurements, or 1.5 <strong>in</strong> imperial measurements);is the water depth <strong>in</strong> meters or feet <strong>in</strong> the rectangular section;constant (1.82 <strong>in</strong> metric measurements or 3.3 <strong>in</strong> imperial measurements);is the width <strong>in</strong> meters or feet <strong>in</strong> the rectangular section.Calculations must be performed as though the two weirs operated <strong>in</strong>dependently of one another. In practice,depth at the measur<strong>in</strong>g po<strong>in</strong>t (h m ) is the only measurement obta<strong>in</strong>ed. Water depth measurements <strong>in</strong> thetriangular and rectangular sections (h t and h r ) are obta<strong>in</strong>ed <strong>in</strong> the follow<strong>in</strong>g manner:0 ≤ h t ≤ height of the triangleIf h m = h tmax (height of the triangle) h r = 0If h m > h tmax ⇒ h r = h m - h tIf h m < h tmax ⇒ h t = h m and h r = 0Page 142 of 223<strong>Booklet</strong> 7 - <strong>Flow</strong> <strong>Measurement</strong> <strong>Methods</strong> <strong>in</strong> <strong>Open</strong> <strong>Channels</strong>
3.6.5. PrecisionIn free flow conditions, a comb<strong>in</strong>ed weir will be less precise other measurement weirs (2) . In the laboratory,the marg<strong>in</strong> of error for this type of weir is approximately ± 3 to 5 % (3) .In the field, under ideal <strong>in</strong>stallation conditions, this weir can provide measurements with a marg<strong>in</strong> of errorof approximately 5 to 10 % (22) . Proper control of the approach speed, however, is extremely importantbecause an approach velocity that is too fast can <strong>in</strong>crease the marg<strong>in</strong> of error to over 30 % (6) .3.6.6. CorrectionsSubmerged flowIf a weir is operat<strong>in</strong>g <strong>in</strong> submerged flow conditions, the only way to remedy the situation is tochange the measurement setup or simply change the type of device, to create free flowconditions.Inadequate approach velocityThe approach velocity can be corrected by simply vary<strong>in</strong>g the crest height of the weir.If a weir is <strong>in</strong>stalled with complete side contractions, the approach velocity is usually slow andacceptable.Length of contractionsIf side contractions do not comply with manufactur<strong>in</strong>g dimensions, this will produce a flowmeasurement error. None of the reference documents consulted <strong>in</strong>cludes a method that takesthis factor <strong>in</strong>to account.To obta<strong>in</strong> an accurate flow measurement, it is therefore important to use a weir that complieswith standards. If a weir cannot be modified, calibration will have to be performed us<strong>in</strong>g thevolumetric or dilution method.3.7. Compound weirA compound weir is often designed by “THEL-MAR”, the name of a manufacturer. There are two types ofcompound weirs: triangular and comb<strong>in</strong>ed. The measurement capability of comb<strong>in</strong>ed compound weirs isbetter than triangular compound weirs, but they are not as accurate.<strong>Booklet</strong> 7 - <strong>Flow</strong> <strong>Measurement</strong> <strong>Methods</strong> <strong>in</strong> <strong>Open</strong> <strong>Channels</strong> Page 143 of 223
3.7.1. DescriptionA comb<strong>in</strong>ed compound weir is more commonly used. It consists of a rectangular weir and triangular weir.It is a rectangular weir with a symmetrical 90° V-notch <strong>in</strong> the centre of the crest. This is a sharp-crestedweir, that is placed perpendicular to the flow.A comb<strong>in</strong>ed weir is manufactured us<strong>in</strong>g a th<strong>in</strong>, vertical transparent slab of plastic, placed <strong>in</strong> the centre of ametal frame that is used as a mount<strong>in</strong>g bracket <strong>in</strong> the flow channel. The weir is secured <strong>in</strong> the metal framewith a rubber airtight seal that provides slight flexibility. The calibration l<strong>in</strong>es are <strong>in</strong> 2 mm <strong>in</strong>crements, andthe unit of measurement is US gallons per day (26) .Figure 25 shows a compound weir.3.7.2. DimensionsManufactur<strong>in</strong>g standards for this type of weir are determ<strong>in</strong>ed by the manufacturer. There is little concernabout the size of components, because the weir is not manufactured or modified at the <strong>in</strong>stallation site.When repair<strong>in</strong>g this type of weir, it is important to ensure that each component ma<strong>in</strong>ta<strong>in</strong>s its <strong>in</strong>itialdimensions.The dimension of compound weirs usually corresponds to the diameter of the support r<strong>in</strong>g. Standarddimensions are 152, 203, 254, 305, 356, 381 and 406 mm (6, 8, 10, 12, 14, 15, and 16 <strong>in</strong>ches) (26) .Page 144 of 223<strong>Booklet</strong> 7 - <strong>Flow</strong> <strong>Measurement</strong> <strong>Methods</strong> <strong>in</strong> <strong>Open</strong> <strong>Channels</strong>
FIGURE 25 -COMPOUND WEIR - PHYSICAL CHARACTERISTICS<strong>Booklet</strong> 7 - <strong>Flow</strong> <strong>Measurement</strong> <strong>Methods</strong> <strong>in</strong> <strong>Open</strong> <strong>Channels</strong> Page 145 of 223
3.7.3. Range of measurementsCompound weirs can be used for a flow range between 174,128 liters (46,000 US gallons) per day to2,309,094 liters (610,000 US gallons) per day. Table 32 shows the measurement capability of differentweirs (26) .3.7.4. UsesA compound weir is used to obta<strong>in</strong> an <strong>in</strong>stant flow measurement. It is designed to be <strong>in</strong>stalled at the channeldischarge and the flow measurement is taken <strong>in</strong> the upstream section.This type of weir must never be used for cont<strong>in</strong>uous measurements, for the follow<strong>in</strong>g reasons:−−−−It significantly restricts a channel’s nom<strong>in</strong>al capacity. Its upper measurement capacity is limited to35 % of a pipe’s nom<strong>in</strong>al capacity (26) .Because the crest height is low, the approach velocity cannot be controlled. It is also easy to cause asubmerged flow without be<strong>in</strong>g aware that this has occurred.Solids such as paper, foul this type of weir easily and cause obstruction. This results <strong>in</strong> measurementerrors.Fluctuations <strong>in</strong> flowrate cause a lot of turbulence and impair precision.It is important to ensure that the flow reaches a permanent pattern before tak<strong>in</strong>g a flow read<strong>in</strong>g, to m<strong>in</strong>imizeerrors. The wait<strong>in</strong>g time is 15 m<strong>in</strong>utes, but a wait<strong>in</strong>g time of one hour can sometimes be required before aread<strong>in</strong>g can be taken.This type of weir should only be used <strong>in</strong> situations where the water’s approach velocity is less than 0.5 m/s(1.5 ft/s), because the greater the velocity, the less accurate the measurement.Page 146 of 223<strong>Booklet</strong> 7 - <strong>Flow</strong> <strong>Measurement</strong> <strong>Methods</strong> <strong>in</strong> <strong>Open</strong> <strong>Channels</strong>
TABLE 32 - COMPOUND WEIR - MEASUREMENT CAPACITYSize of weirMaximum flowratel/d gal US /d152 mm (6 <strong>in</strong>) 174,128 46,000203 mm (8 <strong>in</strong>) 469,390 124,000254 mm (10 <strong>in</strong>) 885,784 234,000305 mm (12 <strong>in</strong>) 1,366,530 361,000356 mm (14 <strong>in</strong>) 1,366,530 361,000381 mm (15 <strong>in</strong>) 2,309,094 610,000406 mm (16 <strong>in</strong>) 2,309,094 610,0003.7.5. Discharge equation <strong>in</strong> free flow conditionsCompound weirs are calibrated <strong>in</strong> the laboratory by the manufacturer. Installation conditions <strong>in</strong> a manholeare therefore simulated (26) . No flow formula is supplied with this type of weir.3.7.6. Submerged flowThis type of weir is designed to operate <strong>in</strong> free flow conditions. In submerged flow situations, it willproduce an approximate flow value. Use <strong>in</strong> submerged flows is therefore not recommended.3.7.7. PrecisionIn the laboratory, the marg<strong>in</strong> of error is ± 2 to 3 %. In the field, under optimum <strong>in</strong>stallation conditions, themarg<strong>in</strong> of error for this type of weir is approximately ± 10 to 15 %. Effective control of the approachvelocity and the flow stability are extremely important.<strong>Booklet</strong> 7 - <strong>Flow</strong> <strong>Measurement</strong> <strong>Methods</strong> <strong>in</strong> <strong>Open</strong> <strong>Channels</strong> Page 147 of 223
4. OTHER METHODS OF MEASUREMENTThe methods of measurement discussed <strong>in</strong> the sections that follow do not require <strong>in</strong>stallation of a primarymeasur<strong>in</strong>g device and usually allow <strong>in</strong>stant flow measurements to be taken.These methods are used when primary measur<strong>in</strong>g devices cannot be <strong>in</strong>stalled for physical or cost reasons.When carried out precisely, these methods yield flow measurements with a marg<strong>in</strong> of error of less than10 %.4.1. Use of tracersTwo techniques are generally used to measure flow with the use of tracers, namely (15) :− travel time technique (section 4.1.2);− tracer dilution technique (section 4.1.3).Each of these methods can be used to measure flowrates <strong>in</strong> closed or open conduits. Use <strong>in</strong> open conduitswill be discussed <strong>in</strong> this section.4.1.1. GeneralGenerally, anyth<strong>in</strong>g that is water soluble, detectable and that can be measured at different concentrations,can be used as a tracer.4.1.1.1 Types of tracersThree categories of tracers are generally used:Chemical tracers:the salts that are generally used <strong>in</strong>clude: sodium chloride (NaCl), potassium chloride (KCl),lithium chloride (LiCl), manganese sulfate (MnSO 4 ) and a few others (27) .Dyes:the compounds generally use are fluoresce<strong>in</strong>, potassium permanganate, methylene blue,rhodam<strong>in</strong>e WT (27) .Radioactive tracers:the follow<strong>in</strong>g isotopes are commonly used: sodium 24, brom<strong>in</strong>e 82, iod<strong>in</strong>e 132 (27) (28) .Page 148 of 223<strong>Booklet</strong> 7 - <strong>Flow</strong> <strong>Measurement</strong> <strong>Methods</strong> <strong>in</strong> <strong>Open</strong> <strong>Channels</strong>
4.1.1.2 Characteristics of tracersThe pr<strong>in</strong>cipal characteristics of tracers are as follows:−−water solubility;ability to be detected at different levels.4.1.1.3 Choos<strong>in</strong>g a tracerCerta<strong>in</strong> criteria must be considered before select<strong>in</strong>g a tracer. These <strong>in</strong>clude:−−−−−−−−−−−−−−ease of use and preparation (solid/liquid);effect of chemical <strong>in</strong>terference;sensitivity to chemical breakdown;sensitivity to photochemical breakdown;absence of or a small concentration of tracer <strong>in</strong> discharge;stability of the tracer;absorption of the tracer;water solubility;effect of tracer on the environment and human health;simple and accurate analysis;m<strong>in</strong>imum detectable limit of the tracer <strong>in</strong> water;availability of the tracer;comparative amounts that are required for work;cost.4.1.1.4 Preparation of tracersUsually before any amount of tracer is removed from a conta<strong>in</strong>er, the contents should be shaken well toelim<strong>in</strong>ate deposits and to produce a homogeneous solution.The method of prepar<strong>in</strong>g a concentrated solution of lithium chloride, described <strong>in</strong> section 4.1.1.4.1 of thischapter, applies to preparation of any chemical tracer.The method of prepar<strong>in</strong>g a concentrated rhodam<strong>in</strong>e WT solution, described <strong>in</strong> section 4.1.1.4.2 of thischapter, applies to preparation of a colored tracer.<strong>Booklet</strong> 7 - <strong>Flow</strong> <strong>Measurement</strong> <strong>Methods</strong> <strong>in</strong> <strong>Open</strong> <strong>Channels</strong> Page 149 of 223
4.1.1.4.1 Preparation of a concentrated lithium chloride solutionThe follow<strong>in</strong>g equation is used to prepare a lithium chloride solution that has a specific concentration oftracer:Ps= CtVxPMPMst(41)where:P sC tVPM sPM tis the weight of salt <strong>in</strong> mg;is the concentration of tracer <strong>in</strong> mg/l;is the volume of solution required <strong>in</strong> liters;is the molecular weight of salt <strong>in</strong> grams;is the molecular weight of the tracer <strong>in</strong> grams.Therefore, to prepare 10 liters of a 10,000 mg/l solution of lithium and know<strong>in</strong>g that:− the density of water is 1.0 g/cm 3− the density of LiCl is 2.068 g/cm 3− the molecular weight of LiCl is 42.392 g− the molecular weight of Li is 6.939 gTo determ<strong>in</strong>e the amount of LiCl necessary to prepare the solution, established values are placed <strong>in</strong> theabove equation, which appears as follows:10,000 mgPs = × 10 l ×442.392 g= 610.9 g6.939 g(42)4.1.1.4.2 Preparation of a concentrated rhodam<strong>in</strong>e WT solutionRhodam<strong>in</strong>e WT is available <strong>in</strong> an aqueous solution at a concentration of 20 %. Because this dye isrelatively viscous and adheres to walls, it should be diluted with enough distilled or dem<strong>in</strong>eralized water tobe able to <strong>in</strong>ject a precise amount. From the orig<strong>in</strong>al solution, a specific amount of tracer, at an establishedconcentration, can be prepared us<strong>in</strong>g the follow<strong>in</strong>g equation (29) :where:C nC iCn= CiSgV[Vdf] (43)is the new desired concentration;is the <strong>in</strong>itial concentration of the tracer;Page 150 of 223<strong>Booklet</strong> 7 - <strong>Flow</strong> <strong>Measurement</strong> <strong>Methods</strong> <strong>in</strong> <strong>Open</strong> <strong>Channels</strong>
S gis the specific weight of the tracer at the <strong>in</strong>itial concentration;V f is the f<strong>in</strong>al volume of the new solution (V d + V w );V d is the volume of the tracer at the <strong>in</strong>itial concentration added;is the volume of purified water added.V wTo prepare 10 liters of a 50 000 ppb solution de rhodam<strong>in</strong>e WT from a 20 % solution, know<strong>in</strong>g that thespecific weight of rhodam<strong>in</strong>e WT 20 % is 1.19, simply substitute the known values <strong>in</strong> the above solutionand solve the equation as follows:V dCn= CiS g(V f)(44)50 , 000ppb= 200,000ppm(1.19)(a10 l)(45)a =(50,000 ppb.)(10200,000 ppm.* 1,0001l)( )1.19(46)a =(14001 l)( )1.19(47)a =1l4761,000 mla =476a = 2.1ml(48)If the device is calibrated by the manufacturer or if the user has the necessary calibrators, the concentrationof the stock solution can be determ<strong>in</strong>ed. The solution is diluted at a concentration that can be read by afluorometer and the <strong>in</strong>itial concentration (C i ) is calculated us<strong>in</strong>g the above equation. For greater precision,the density of the stock solution should be verified with a hydrometer to reduce the chance of error whenthe orig<strong>in</strong>al concentration is measured.Use of laboratory equipment (pipette, volumetric flask, fluorometer) requires prior tra<strong>in</strong><strong>in</strong>g, and alaboratory should be consulted before work beg<strong>in</strong>s. The high viscosity of rhodam<strong>in</strong>e WT complicates theuse of pipettes.4.1.2. Travel time methodThe flow measurement method based on determ<strong>in</strong><strong>in</strong>g the travel time of a tracer was developed <strong>in</strong> 1927 (30) .<strong>Booklet</strong> 7 - <strong>Flow</strong> <strong>Measurement</strong> <strong>Methods</strong> <strong>in</strong> <strong>Open</strong> <strong>Channels</strong> Page 151 of 223
4.1.2.1 GeneralUse of this method requires extremely accurate measurements <strong>in</strong> the flow area of the distance and timetraveled, between the <strong>in</strong>jection po<strong>in</strong>t and test po<strong>in</strong>t.4.1.2.1.1 Pr<strong>in</strong>ciple of the methodThe method consists of quickly <strong>in</strong>ject<strong>in</strong>g a large volume of tracer <strong>in</strong>to a stream of water and determ<strong>in</strong><strong>in</strong>gthe average velocity at which the tracer moves. On the basis of this pr<strong>in</strong>ciple, flow can be determ<strong>in</strong>ed us<strong>in</strong>gthe follow<strong>in</strong>g formula (30) :where:QVALt cVQ =tc(49)flowrate <strong>in</strong> cubic meters or cubic feet per time unit;volume of the conduit or flow section (AL), <strong>in</strong> meters or cubic feet;cross section of the measur<strong>in</strong>g section <strong>in</strong> square meters or feet;distance <strong>in</strong> meters or feet between the detectors;the time that has elapsed between the time of <strong>in</strong>jection and movement of the centreportion of the cloud to the test po<strong>in</strong>t.4.1.2.1.2 General applicationsThis method is used for the follow<strong>in</strong>g applications:− flow measurement <strong>in</strong> open and closed conduits, where the discharge cross section is uniform;− calibration of pumps, turb<strong>in</strong>es, open or closed conduits and the primary measur<strong>in</strong>g device (31) .4.1.2.1.3 Advantages of the method−−−−−−−−Loss of part of the tracer does not affect results;results do not depend on the tracer’s long-term storage life;does not require a sophisticated <strong>in</strong>strument for <strong>in</strong>jection <strong>in</strong> open channels;enables flow measurements where other methods cannot be implemented;enables flow measurements <strong>in</strong> sections of the system where observation wells have small diameters;enables measurement of large flows;does not require precise laboratory measurements of the concentration of a tracer;requires a small amount of tracer.Page 152 of 223<strong>Booklet</strong> 7 - <strong>Flow</strong> <strong>Measurement</strong> <strong>Methods</strong> <strong>in</strong> <strong>Open</strong> <strong>Channels</strong>
4.1.2.1.4 Disadvantages of the method− provides only a po<strong>in</strong>t-specific flow measurement;− requires the discharge to have a uniform flow (30) ;− requires a precise measurement of time between the <strong>in</strong>jection po<strong>in</strong>t and test po<strong>in</strong>t (30) ;− requires a few development tests before actual tests can be performed (31) ;− requires an accurate measurement of the area of the discharge section (30) ;− the procedure requires tra<strong>in</strong>ed personnel and must be performed with attention to detail;− requires a uniform cross section of discharge and a straight section of conduit (31) .4.1.2.1.5 Injection equipmentThe type of <strong>in</strong>jection equipment required will vary accord<strong>in</strong>g to the type of discharge system present. Thetracer that is used also has no bear<strong>in</strong>g or very little bear<strong>in</strong>g on the type of <strong>in</strong>jection equipment used.The follow<strong>in</strong>g equipment is required:−−−−−−automatic control valves;an <strong>in</strong>jection pump;a deflection device to create turbulence <strong>in</strong> the flow;a mix<strong>in</strong>g tank for the solution;gasket seals;hose and coupl<strong>in</strong>gs.4.1.2.1.6 Detection and measur<strong>in</strong>g equipmentThe type of detection and measur<strong>in</strong>g equipment that is used will depend on the discharge system that ispresent and the type of tracer used.4.1.2.1.7 Injection procedureThe trac<strong>in</strong>g solution is <strong>in</strong>jected quickly <strong>in</strong>to the water current. The period of <strong>in</strong>jection may vary accord<strong>in</strong>gto the situation, but usually lasts less than one second. The <strong>in</strong>jection system consists of a cyl<strong>in</strong>dricalchamber that conta<strong>in</strong>s a solution and pneumatic piston, which forces a sudden discharge of the tracer out ofthe chamber.A few feet upstream from the <strong>in</strong>jection po<strong>in</strong>t, a mechanism capable of caus<strong>in</strong>g turbulence must be <strong>in</strong>stalled<strong>in</strong> the discharge, to enable the <strong>in</strong>jected solution to mix quickly and thoroughly.<strong>Booklet</strong> 7 - <strong>Flow</strong> <strong>Measurement</strong> <strong>Methods</strong> <strong>in</strong> <strong>Open</strong> <strong>Channels</strong> Page 153 of 223
4.1.2.1.8 PersonnelThis procedure requires skilled personnel who have the necessary field experience. At least three personswill be required for the procedure.4.1.2.1.9 <strong>Measurement</strong> of flow areaThe flow area is determ<strong>in</strong>ed <strong>in</strong> the follow<strong>in</strong>g manner (31) :−−The <strong>in</strong>side dimension of the conduit is measured us<strong>in</strong>g an <strong>in</strong>side caliper that takes measurements towith<strong>in</strong> one thousandths of a meter (thousandths of a foot). The diameter is measured on at least threeproportional angles, to ensure that the conduit is perfectly round. The number of read<strong>in</strong>gs variesaccord<strong>in</strong>g to the difference between the read<strong>in</strong>gs obta<strong>in</strong>ed and the nom<strong>in</strong>al dimension of the conduit.<strong>Flow</strong> depth <strong>in</strong> the conduit is measured from the bottom of the conduit. The width of the flow area ismeasured and the centre po<strong>in</strong>t corresponds to the centre of the conduit, unless the conduit is not round.4.1.2.1.10 Calculation of flowrateThe flowrate corresponds to the product of the average velocity measured and the area of the flow section.The unit of measurement is cubic meters per second or cubic feet per second.4.1.2.1.11 Segment of measurementWhen choos<strong>in</strong>g a segment of measurement, it is important to look for the follow<strong>in</strong>g conditions:− a straight segment <strong>in</strong> the system;− no obstruction and no serious deposits <strong>in</strong> any portion of the segment of measurement (31) ;− no <strong>in</strong>flow or loss of liquid between the <strong>in</strong>jection and sampl<strong>in</strong>g po<strong>in</strong>ts (1) ;− access necessary to perform all measurements with precision;− a stable and constant flow.4.1.2.1.11.1 Injection po<strong>in</strong>tWhen choos<strong>in</strong>g an <strong>in</strong>jection po<strong>in</strong>t, it is important to check the follow<strong>in</strong>g conditions:− access for personnel and equipment;− the presence of or circumstances that can create a turbulent flow to allow the tracer to mix;− a location that does not <strong>in</strong>terfere with vehicular traffic.4.1.2.1.11.2 Sampl<strong>in</strong>g po<strong>in</strong>tPage 154 of 223<strong>Booklet</strong> 7 - <strong>Flow</strong> <strong>Measurement</strong> <strong>Methods</strong> <strong>in</strong> <strong>Open</strong> <strong>Channels</strong>
When select<strong>in</strong>g a sampl<strong>in</strong>g po<strong>in</strong>t, it is important to check for the follow<strong>in</strong>g conditions:− access for personnel and equipment;− flow must be stable, constant and smooth to enable accurate measurement of the flow area;− a location that does not <strong>in</strong>terfere with vehicular traffic.4.1.2.2 Use of a chemical tracerA chemical tracer is one of the three types of tracers that can be used to perform flow measurements us<strong>in</strong>gthe time travel method.4.1.2.2.1 Pr<strong>in</strong>ciple of useThe method <strong>in</strong>volv<strong>in</strong>g use of a chemical tracer (br<strong>in</strong>e) is based on the fact that the presence of a salt<strong>in</strong>creases the electrical conductivity of water (2) . Enough salt must be added to allow conductivity to<strong>in</strong>crease (27) (31) . The change <strong>in</strong> conductivity is detected and the time for a given volume of liquid to travelbetween two observation po<strong>in</strong>ts is measured.4.1.2.2.2 Applications of chemical tracersChemical tracers can be used <strong>in</strong> almost any situation. They are particularly well suited for measurement ofwaters that conta<strong>in</strong> large amounts of organic matter. They are highly soluble and stable.It is important, however, to verify the environmental impact use of a tracer may have on the receiv<strong>in</strong>gwater.4.1.2.2.3 Preparation of chemical tracersA sal<strong>in</strong>e solution (NaCl) with a density between 1.01 and 1.04 is usually prepared. Use of another tracerrequires a similar concentration. A few tests should normally be performed to determ<strong>in</strong>e what concentrationwill be required for an optimum read<strong>in</strong>g.Enough solution should be prepared to allow five tests to be performed, <strong>in</strong> addition to development tests. Itis important to take the estimated flowrate <strong>in</strong>to account, to determ<strong>in</strong>e exactly how much solution will berequired.<strong>Booklet</strong> 7 - <strong>Flow</strong> <strong>Measurement</strong> <strong>Methods</strong> <strong>in</strong> <strong>Open</strong> <strong>Channels</strong> Page 155 of 223
4.1.2.2.4 Advantages of chemical tracers−−−−−the tracer is stable;the tracer is soluble;the tracer is not affected by the water’s pH level;the tracer is detectable, even if there are large amounts of suspended matter;the tracer rema<strong>in</strong>s stable, even <strong>in</strong> the presence of oxidiz<strong>in</strong>g agents such as chlor<strong>in</strong>e.4.1.2.2.5 Disadvantages of chemical tracers−chemical tracers can be expensive.4.1.2.2.6 Detection and measurement equipmentThe follow<strong>in</strong>g equipment is required:− detect<strong>in</strong>g electrodes;− a galvanometer;− a chronometer;− a record<strong>in</strong>g <strong>in</strong>strument.4.1.2.2.7 Position of electrodesA pair of electrodes is placed <strong>in</strong> two locations <strong>in</strong> the flow section, far enough away from one another toallow an accurate measurement of how long it takes for the br<strong>in</strong>e to reach each po<strong>in</strong>t. The first electrodemust be positioned at a distance equal to at least four times the diameter of the conduit downstream fromthe <strong>in</strong>jection po<strong>in</strong>t (31) . The distance of the second electrode will vary accord<strong>in</strong>g to conditions at the site.However, the electrodes must be far enough away from one another so that when the tracer can no longerbe detected at the first test po<strong>in</strong>t, it beg<strong>in</strong>s to be detected at the second po<strong>in</strong>t.Page 156 of 223<strong>Booklet</strong> 7 - <strong>Flow</strong> <strong>Measurement</strong> <strong>Methods</strong> <strong>in</strong> <strong>Open</strong> <strong>Channels</strong>
4.1.2.2.8 Detection and measurement procedureElectrodes are connected to a record<strong>in</strong>g <strong>in</strong>strument. When movement of a tracer to each po<strong>in</strong>t is detected,the <strong>in</strong>strument plots a curve on the chart to represent the stream’s electrical conductivity. The amount oftime that has elapsed between the centre po<strong>in</strong>t of both chart curves is measured <strong>in</strong> seconds (2) .The average velocity is calculated on the basis of at least five tests.The deviation between the lowest and highest velocity measured dur<strong>in</strong>g the five tests must be less than 5 %.A larger deviation requires a complete review of the procedure and repeat<strong>in</strong>g the tests.4.1.2.2.9 Prelim<strong>in</strong>ary testsBefore conduct<strong>in</strong>g calibration tests, it is important to perform a few prelim<strong>in</strong>ary tests to determ<strong>in</strong>e thefollow<strong>in</strong>g:−−−the liquid’s natural conductivity, which will be used as the basis for measurements (po<strong>in</strong>t zero);the concentration of the br<strong>in</strong>e necessary to create an adequate difference <strong>in</strong> conductivity;the correct location of detection electrodes.<strong>Booklet</strong> 7 - <strong>Flow</strong> <strong>Measurement</strong> <strong>Methods</strong> <strong>in</strong> <strong>Open</strong> <strong>Channels</strong> Page 157 of 223
4.1.2.2.10 PrecisionWhen performed by skilled personnel, this method of measurement yields a value that deviates no morethan ± 1 % from the actual value.4.1.2.2.11 Causes of errorThe pr<strong>in</strong>cipal causes of error <strong>in</strong>clude:− speed of <strong>in</strong>jection if the <strong>in</strong>jection time is too long, movement of the br<strong>in</strong>eto the observation po<strong>in</strong>ts may be difficult to detect due todilution <strong>in</strong> the flow;−volume measurement <strong>in</strong> theflow sectionthe measurement must be extremely accurate, andparticular care must be taken to correctly locate the flowsection. Because the distance between the <strong>in</strong>jection po<strong>in</strong>tand observation po<strong>in</strong>t is very short, a flow measurementmust also be performed with extreme precision;− travel time to m<strong>in</strong>imize errors, the plott<strong>in</strong>g of curves should betimed and the time <strong>in</strong>terval between each peak should becalculated us<strong>in</strong>g a chronometer that is separate from therecord<strong>in</strong>g <strong>in</strong>strument.4.1.2.3 Use of a dye tracerUse of a dye tracer is becom<strong>in</strong>g <strong>in</strong>creas<strong>in</strong>gly more common to perform a flow measurement us<strong>in</strong>g the timetravel method.4.1.2.3.1 Pr<strong>in</strong>ciple of useThis method is based on a visual observation of a change <strong>in</strong> color of flow. It is therefore important todeterm<strong>in</strong>e the time necessary for a colored cloud to travel the distance between the <strong>in</strong>jection po<strong>in</strong>t and testpo<strong>in</strong>t.4.1.2.3.2 Applications of dye tracersThe use of dyes may appear limited due to the <strong>in</strong>terferences that are often present dur<strong>in</strong>g sample analysis.Each case must be assessed on the basis of prelim<strong>in</strong>ary tests before authoriz<strong>in</strong>g use.Page 158 of 223<strong>Booklet</strong> 7 - <strong>Flow</strong> <strong>Measurement</strong> <strong>Methods</strong> <strong>in</strong> <strong>Open</strong> <strong>Channels</strong>
Dyes are well suited to flow measurements <strong>in</strong> water that conta<strong>in</strong>s only very small amounts of suspendedmatter, very little organic matter, no oxidiz<strong>in</strong>g agents and where the pH is relatively neutral. Experienceshows, however, that dye tracers can be used even if water pH is acid or alkal<strong>in</strong>e, if the sample isneutralized before analysis. The presence of organic matter or suspended matter can also be blocked if thesample undergoes centrifugation before analysis.It is also important to verify the toxicity of dyes before use to ensure that there are no contra<strong>in</strong>dicationsrelated to potential use <strong>in</strong> water.4.1.2.3.3 Preparation of dye tracersPrepare dye tracers by dilut<strong>in</strong>g the concentrated product with distilled water. The concentration of thesolution will depends on an estimate of the flowrate. The f<strong>in</strong>al concentration, after mixture with the flow,which is easily visible to the eye, should be approximately 25 to 50 µg/l (ppb) (32) .The amount of tracer necessary to carry out work can be determ<strong>in</strong>ed on the basis of the follow<strong>in</strong>g equation:where:C pKLQV svKCpQL=10 vV s 5(50)is the desired maximum concentration at the test po<strong>in</strong>t, <strong>in</strong> μg/l (ppb);is the constant (133.84 for metric units and 3.79 for imperial units);is the length of the measurement segment, <strong>in</strong> meters or feet;is the flowrate of the discharge gauged <strong>in</strong> cubic meters/second or cubic feet/second;is the volume of the tracer (rhodam<strong>in</strong>e WT 20 %) that is required, <strong>in</strong> milliliters;is the average flow velocity, <strong>in</strong> meters/second or feet/second.A few tests are usually required to determ<strong>in</strong>e the concentration that is necessary to obta<strong>in</strong> optimum results.There should be enough tracer dye to allow five tests to be performed, <strong>in</strong> addition to development tests. It isimportant to take the estimated flowrate <strong>in</strong>to account, to determ<strong>in</strong>e the exact amount of tracer that isrequired.4.1.2.3.4 Advantages of tracer dyes−−−−−tracer dyes are extremely water soluble;they are <strong>in</strong>expensive;the visibility of the tracer simplifies the task;tracers can be prepared quickly and easily;very little detection and measur<strong>in</strong>g equipment is required.<strong>Booklet</strong> 7 - <strong>Flow</strong> <strong>Measurement</strong> <strong>Methods</strong> <strong>in</strong> <strong>Open</strong> <strong>Channels</strong> Page 159 of 223
4.1.2.3.5 Disadvantages of dye tracersSome experience and good judgment are required to f<strong>in</strong>d the centre of the cloud. Use of a fluorometer cansignificantly reduce uncerta<strong>in</strong>ty and improve precision. The follow<strong>in</strong>g factors should also be considered.− It is difficult to determ<strong>in</strong>e if the cloud observed is the average cloud or simply a surface cloud (1) ;− A tracer cannot be used where certa<strong>in</strong> oxidiz<strong>in</strong>g agents such as chlor<strong>in</strong>e are present;− A tracer may be destroyed <strong>in</strong> the presence of extreme pH levels;− The presence of solids or organic matter can cause <strong>in</strong>terference;− Glass equipment must absolutely be used.4.1.2.3.6 Detection and measurement equipmentThe follow<strong>in</strong>g <strong>in</strong>struments are required:−−−a chronometer;a sampl<strong>in</strong>g device;a colorimeter or fluorometer.4.1.2.3.7 Position of test po<strong>in</strong>tThe test po<strong>in</strong>t should be located far enough away from the <strong>in</strong>jection po<strong>in</strong>t to allow the tracer to mix withwater. Enough distance should also be allowed to enable an accurate measurement of the amount of timethat elapses between the moment of <strong>in</strong>jection and movement of the dye to the test po<strong>in</strong>t.The distance required between the <strong>in</strong>jection po<strong>in</strong>t and test po<strong>in</strong>t will vary accord<strong>in</strong>g to flow conditions anddepend<strong>in</strong>g on how fast the mixture occurs. The more turbulent the flow at the <strong>in</strong>jection po<strong>in</strong>t, the shorter thedistance. Nonetheless, the distance between the <strong>in</strong>jection po<strong>in</strong>t and test po<strong>in</strong>t should be no more thantwenty diameters of the conduit.Page 160 of 223<strong>Booklet</strong> 7 - <strong>Flow</strong> <strong>Measurement</strong> <strong>Methods</strong> <strong>in</strong> <strong>Open</strong> <strong>Channels</strong>
4.1.2.3.8 Detection and measurement procedureThe detection procedure can consist of a visual detection of dye at the test po<strong>in</strong>t, without the need for aconcentration measurement over time. This method of detection, however, is not enough to guarantee anaccurate measurement, because p<strong>in</strong>po<strong>in</strong>t<strong>in</strong>g the actual centre of the cloud of dye is subjective. The cloudthat appears at the surface is also not necessarily representative of an average cloud.The recommended method of detection therefore consists of us<strong>in</strong>g a colorimeter or fluorometer to measurethe concentration of dye at the test po<strong>in</strong>t and plott<strong>in</strong>g the curve of concentrations as a function of time todeterm<strong>in</strong>e the centre of the cloud. This method requires sampl<strong>in</strong>g at very rapid <strong>in</strong>tervals (with<strong>in</strong> thirtyseconds of one another).The centre po<strong>in</strong>t of the curve co<strong>in</strong>cides with movement of the cloud to the test po<strong>in</strong>t. The amount of timethat elapses between the moment of <strong>in</strong>jection and the centre po<strong>in</strong>t of the curve is measured <strong>in</strong> seconds (2) .Velocity is the average velocity calculated on the basis of results obta<strong>in</strong>ed for each test.The deviation <strong>in</strong> values between the lowest and highest velocity measured dur<strong>in</strong>g the five tests must be lessthen 5 %. A higher deviation requires a complete review of the procedure and repeat<strong>in</strong>g tests.4.1.2.3.9 Prelim<strong>in</strong>ary testsBefore perform<strong>in</strong>g calibration tests, a few preparatory tests must be performed to determ<strong>in</strong>e the follow<strong>in</strong>g:−−−the effluent’s natural color and the concentration of dye necessary to obta<strong>in</strong> adequate color<strong>in</strong>g;the exact location of the test po<strong>in</strong>t;effluent <strong>in</strong>terference.4.1.2.3.10 PrecisionWhen performed by skilled personnel, this method of measurement yields flow measurements with adeviation of no more than ± 1 % of the actual measurement.<strong>Booklet</strong> 7 - <strong>Flow</strong> <strong>Measurement</strong> <strong>Methods</strong> <strong>in</strong> <strong>Open</strong> <strong>Channels</strong> Page 161 of 223
4.1.2.3.11 Causes for errorThe pr<strong>in</strong>cipal causes for error are as follows:− speed of <strong>in</strong>jection if the <strong>in</strong>jection time is too long, the curve ofconcentration as a function of time at the test po<strong>in</strong>t maybe too large, mak<strong>in</strong>g it difficult to determ<strong>in</strong>e the centrepo<strong>in</strong>t of the cloud of dye;−measurement of the volume ofthe flow areathe measurement must be extremely precise, andparticular care must be taken to locate the flow areaexactly. Because the distance between the <strong>in</strong>jection po<strong>in</strong>tand observation po<strong>in</strong>t is extremely short, the flowmeasurement must also be very precise;− travel time to m<strong>in</strong>imize errors, a chronometer must be used to trackthe amount of time that elapses between the <strong>in</strong>jectionpo<strong>in</strong>t and test po<strong>in</strong>t and to plot the curve ofconcentrations over time, until the natural concentrationreappears.4.1.2.4 Use of a radioactive tracerUse of a radioactive tracer is an expensive method that is not <strong>in</strong> common use.4.1.2.4.1 Pr<strong>in</strong>ciple of useThis method is based on the fact that a tracer added to the discharge <strong>in</strong>creases the natural radioactivity ofwater. The change <strong>in</strong> radioactivity is detected to determ<strong>in</strong>e the amount of time that elapses for the tracer tomove between two observation po<strong>in</strong>ts.4.1.2.4.2 Applications of radioactive tracersRadioactive tracers can be used <strong>in</strong> almost any situation. They are particularly well adapted to measurementof water that conta<strong>in</strong>s large amounts of suspended matter and organic matter.Before use, it is important to ensure that a radioactive tracer will not affect the receiv<strong>in</strong>g water.Page 162 of 223<strong>Booklet</strong> 7 - <strong>Flow</strong> <strong>Measurement</strong> <strong>Methods</strong> <strong>in</strong> <strong>Open</strong> <strong>Channels</strong>
4.1.2.4.3 Preparation of radioactive tracersRadioactive tracers usually do not require any particular preparation and are used as is. The amount oftracer used depends on the estimated flowrate. A few tests are usually required to determ<strong>in</strong>e how muchtracer is necessary to obta<strong>in</strong> optimum results. There must be enough tracers available to allow five tests tobe performed, <strong>in</strong> addition to development tests.4.1.2.4.4 Advantages of radioactive tracers−−Only very small concentrations are necessary to detect the tracer, s<strong>in</strong>ce the natural radioactivity ofeffluents is negligible (28) .Portable <strong>in</strong>struments can be used for on-site detection and measurement.4.1.2.4.5 Disadvantages of radioactive tracers− The tracer must be stored <strong>in</strong> a lead conta<strong>in</strong>er until it is used (28) .− Special precautions have to be taken to protect the health and safety of workers.− The public perception of radioactive agents is negative.− Isotopes, detection equipment and measur<strong>in</strong>g <strong>in</strong>struments are expensive.− This tracer is normally used to measure large-volume flows.− It can pose a hazard to humans, wildlife and vegetation.<strong>Booklet</strong> 7 - <strong>Flow</strong> <strong>Measurement</strong> <strong>Methods</strong> <strong>in</strong> <strong>Open</strong> <strong>Channels</strong> Page 163 of 223
4.1.2.4.6 Detection and measurement equipmentThe follow<strong>in</strong>g equipment is required:−−−−a chronometer;a sc<strong>in</strong>tillation detector;a sampl<strong>in</strong>g <strong>in</strong>strument;20 liters conta<strong>in</strong>ers.4.1.2.4.7 Position of test po<strong>in</strong>tThe test po<strong>in</strong>t should be located far enough away from the <strong>in</strong>jection po<strong>in</strong>t to allow the tracer to mix withwater. Enough distance should also be allowed to enable an accurate measurement of the amount of timethat elapses between the moment of <strong>in</strong>jection and movement of the dye to the test po<strong>in</strong>t.The distance required between the <strong>in</strong>jection po<strong>in</strong>t and test po<strong>in</strong>t will vary accord<strong>in</strong>g to flow conditions anddepend<strong>in</strong>g on how fast the mixture occurs. The more turbulent the flow at the <strong>in</strong>jection po<strong>in</strong>t, the shorter thedistance. Nonetheless, the distance between the <strong>in</strong>jection po<strong>in</strong>t and test po<strong>in</strong>t should be no more thantwenty diameters of the conduit.4.1.2.4.8 Detection and measurement procedureThe procedure for detect<strong>in</strong>g radioactive tracers consists of measur<strong>in</strong>g their activity us<strong>in</strong>g sc<strong>in</strong>tillationdetectors. The degree of activity is recorded by plott<strong>in</strong>g a curve on record<strong>in</strong>g chart paper as a function oftime.This procedure requires immerg<strong>in</strong>g the detector <strong>in</strong> the flow. The detector must be surrounded by enoughliquid on all sides, between 0.5 and l meter, depend<strong>in</strong>g on the type of isotope used.Samples can also be taken and placed <strong>in</strong> 20 liters conta<strong>in</strong>ers for later sample analysis. This method requirestak<strong>in</strong>g a large number of samples at very rapid <strong>in</strong>tervals (with<strong>in</strong> thirty seconds of one another).The centre po<strong>in</strong>t of the curve co<strong>in</strong>cides with movement of the cloud of radioactive tracer to the test po<strong>in</strong>t.The time that elapses between the moment of <strong>in</strong>jection and the centre po<strong>in</strong>t of the curve is measured <strong>in</strong>seconds (2) .Velocity is the average velocity calculated on the basis of results obta<strong>in</strong>ed for each test.The deviation between the lowest and highest velocity measurements dur<strong>in</strong>g the five tests must be less than5 %. A larger deviation requires a complete review of the procedure and repeat<strong>in</strong>g tests.Page 164 of 223<strong>Booklet</strong> 7 - <strong>Flow</strong> <strong>Measurement</strong> <strong>Methods</strong> <strong>in</strong> <strong>Open</strong> <strong>Channels</strong>
4.1.2.4.9 Prelim<strong>in</strong>ary testsBefore conduct<strong>in</strong>g calibration tests, it is important to perform a few prelim<strong>in</strong>ary tests to determ<strong>in</strong>e thefollow<strong>in</strong>g:−−−the liquid’s natural radiation, that will be used as the basis for measurements (po<strong>in</strong>t zero);the amount of radioactive substances that are required to obta<strong>in</strong> an adequate read<strong>in</strong>g of activity at thetest po<strong>in</strong>t;the correct location of the test po<strong>in</strong>t.4.1.2.4.10 PrecisionWhen performed by skilled personnel, this method of measurement yields a value that deviates no morethan ± 1 % from the absolute value.4.1.2.4.11 Causes of errorThe pr<strong>in</strong>cipal causes of error are:− speed of <strong>in</strong>jection if the <strong>in</strong>jection time is too long, the curve of concentration as afunction of time at the test po<strong>in</strong>t may be too long, mak<strong>in</strong>g itdifficult to determ<strong>in</strong>e the centre po<strong>in</strong>t of the cloud;−volume measurement <strong>in</strong> the flowsectionthe measurement must be extremely accurate, and particularcare must be taken to correctly locate the flow section.Furthermore, because the distance between the <strong>in</strong>jection po<strong>in</strong>tand observation po<strong>in</strong>t is very short, the flow measurementmust be performed with extreme precision;− travel time travel time is gauged us<strong>in</strong>g a chronometer. The amount oftime that elapses between <strong>in</strong>jection and the time it takes tocompletely plot a curve of concentrations, and the position ofthe centre po<strong>in</strong>t of the curve determ<strong>in</strong>es the travel time.4.1.3. Dilution measurement method<strong>Flow</strong> measurement us<strong>in</strong>g the dilution measurement method can be performed us<strong>in</strong>g any type of tracer. Forthe purpose of this document, lithium chloride and rhodam<strong>in</strong>e WT will be discussed, because these twotracers are commonly used.<strong>Booklet</strong> 7 - <strong>Flow</strong> <strong>Measurement</strong> <strong>Methods</strong> <strong>in</strong> <strong>Open</strong> <strong>Channels</strong> Page 165 of 223
4.1.3.1 GeneralUse of the dilution method allows you to determ<strong>in</strong>e flow without the need to measure dimensions of theflow section.The dilution method is based on a measurement of color, conductivity, fluorescence, chemicalconcentration or radioactivity.4.1.3.1.1 Pr<strong>in</strong>ciple of the methodThe method consists of measur<strong>in</strong>g the degree of dilution of an amount of tracer, <strong>in</strong>jected <strong>in</strong>to a flow, once ithas been completely mixed (28) (30) .On the basis of this pr<strong>in</strong>ciple, flow can be determ<strong>in</strong>ed us<strong>in</strong>g the follow<strong>in</strong>g equation (33) := QQ1C12 C2(51)where:Q 1C 1Q 2C 2is the <strong>in</strong>jection flow of the tracer;is the concentration of tracer <strong>in</strong>jected;is the desired flowrate;is the concentration of tracer mixed <strong>in</strong> the flow.The pr<strong>in</strong>ciple appears simple enough; however, practical application requires a thorough understand<strong>in</strong>g ofthe dispersion process.4.1.3.1.2 General applicationsThis method can be used to measure flow <strong>in</strong> an open or closed conduit.In an open conduit, this method is used when:− the flow is too fast and turbulent (30) ;− the measurement segment is too irregular;− the measurement segment conta<strong>in</strong>s debris and deposits (30) ;− the segment area and flow velocities are variable (30) ;− access to the measurement segment poses a risk of accident (30) ;− some portions of the measurement segment can only be accessed through small diameter observationwells.Page 166 of 223<strong>Booklet</strong> 7 - <strong>Flow</strong> <strong>Measurement</strong> <strong>Methods</strong> <strong>in</strong> <strong>Open</strong> <strong>Channels</strong>
4.1.3.1.3 Advantages of the method− enables flow measurements where other methods cannot be used;− allows large flows to be measured;− produces extremely accurate measurements; the method can therefore be used to counter-checkmeasurement setups and movement of liquids at the site (28) ;− does not require knowledge of dimensions of the flow area and flow velocity (28) ;− enables flow measurements <strong>in</strong> a closed or open conduit.4.1.3.1.4 Disadvantages of the method− tracers are expensive;− the method usually yields only momentary flow measurements;− the procedure requires tra<strong>in</strong>ed personnel;− the procedure requires a lot of time (28) ;− an number of parameters that can cause <strong>in</strong>terference must be considered when select<strong>in</strong>g a tracer andmust be measured dur<strong>in</strong>g use;− flow measurement is not always immediately available.4.1.3.1.5 Injection equipmentThe type of equipment required to carry out the dilution method will vary accord<strong>in</strong>g to the flow systempresent at the site and the method of measurement used. The tracer that is used has no bear<strong>in</strong>g or very littlebear<strong>in</strong>g on the type of <strong>in</strong>jection equipment used.The follow<strong>in</strong>g equipment is required:−−−−−−−an <strong>in</strong>jection <strong>in</strong>strument;a deflection device to create turbulence <strong>in</strong> the flow at the <strong>in</strong>jection po<strong>in</strong>t;a mix<strong>in</strong>g tank for the solution;a tracer;a chronometer;graduated conta<strong>in</strong>ers (cyl<strong>in</strong>ders, flasks, pipettes, test tubes) to prepare the stock solution, calibrate the<strong>in</strong>jection <strong>in</strong>strument, store the stock solution, collect samples and store samples;a hose and coupl<strong>in</strong>gs.4.1.3.1.6 PersonnelThis method requires technical personnel who have relevant tra<strong>in</strong><strong>in</strong>g and experience. It is difficult to carryout work with fewer than three people.<strong>Booklet</strong> 7 - <strong>Flow</strong> <strong>Measurement</strong> <strong>Methods</strong> <strong>in</strong> <strong>Open</strong> <strong>Channels</strong> Page 167 of 223
4.1.3.1.7 Types of tracersGo to section 4.1.1.1 for more <strong>in</strong>formation about tracers.4.1.3.1.8 Recovery <strong>in</strong>dex (I r )Whether you use a slug <strong>in</strong>jection or constant <strong>in</strong>jection technique, when us<strong>in</strong>g chemical tracers and dyes, itis always important to perform tests to determ<strong>in</strong>e the recovery <strong>in</strong>dex (I r). A recovery <strong>in</strong>dex is required todemonstrate the accuracy of the method and it allows you to determ<strong>in</strong>e the correction factor that appliesdur<strong>in</strong>g the flow calculation (34) .4.1.3.1.8.1 Procedure to determ<strong>in</strong>e the recovery <strong>in</strong>dexThe procedure to determ<strong>in</strong>e the recovery <strong>in</strong>dex consists of two steps: theoretical calculation of theconcentration after mix<strong>in</strong>g and laboratory test<strong>in</strong>g.4.1.3.1.8.1.1 Theoretical calculationBased on the pr<strong>in</strong>ciple that if the <strong>in</strong>itial concentration of a tracer is known, it is possible to make atheoretical calculation of the concentration of a specific amount of tracer once it is mixed with apredeterm<strong>in</strong>ed volume of water.Example:A tracer with an <strong>in</strong>jection concentration of 4000 ppb is used to perform tests. If 1 ml of traceris mixed with 999 ml of water, the theoretical concentration of the tracer after mix<strong>in</strong>g is4 ppb.4.1.3.1.8.1.2 Laboratory test<strong>in</strong>gLaboratory recover<strong>in</strong>g tests consist of compar<strong>in</strong>g the amount of tracer recovered and the establishedtheoretical value, when the tracer is mixed with the follow<strong>in</strong>g:−−a solution that has no chance of <strong>in</strong>terfer<strong>in</strong>g with the tracer, usually distilled water or dem<strong>in</strong>eralizedwater;water from the discharge, usually taken upstream from the <strong>in</strong>jection po<strong>in</strong>t.Page 168 of 223<strong>Booklet</strong> 7 - <strong>Flow</strong> <strong>Measurement</strong> <strong>Methods</strong> <strong>in</strong> <strong>Open</strong> <strong>Channels</strong>
Test<strong>in</strong>g procedures are as follows:Three volumetric flasks, of 1000 ml are used. One (1) ml of tracer is placed <strong>in</strong> each of thevolumetric flasks. The first flask is filled to the mark with distilled or dem<strong>in</strong>eralized water, andthe two other volumetric flasks are filled with water from the flow. Each flask is then shakento obta<strong>in</strong> a uniform mixture. A sample is taken from each flask and the concentration of tracerafter mixture is measured <strong>in</strong> each case. The concentrations recorded are compared with thetheoretical concentration that was determ<strong>in</strong>ed ahead of time.The concentration of tracer, after mixture with distilled water, must be equal to the theoreticalconcentration. Any deviation with the theoretical value will be considered an error <strong>in</strong> handl<strong>in</strong>g.If the deviation is too large (± 1 %), all tests must be repeated.The concentration of the tracer, after mixture with water from the flow, is compared with theconcentration of the solution prepared with distilled water. The value obta<strong>in</strong>ed for eachsolution must be identical. Any deviation between these two values is def<strong>in</strong>ed as a recovery<strong>in</strong>dex.Example:The theoretical value determ<strong>in</strong>ed above was 4 ppb. The value obta<strong>in</strong>ed withdistilled water is also 4 ppb. The value obta<strong>in</strong>ed with water from the flow is3.8 ppb. The recovery <strong>in</strong>dex is therefore 0.95, or 3.8 ppb/4 ppb.4.1.3.1.9 Mix<strong>in</strong>g conditionsTo ensure that measurements are successful, sampl<strong>in</strong>g must be carried out at a po<strong>in</strong>t far enoughdownstream from the <strong>in</strong>jection po<strong>in</strong>t and the tracer must mix with the flow well.The follow<strong>in</strong>g conditions help to create proper mix<strong>in</strong>g:− a turbulent flow at the <strong>in</strong>jection po<strong>in</strong>t;− a long enough measurement segment;− a water depth at the <strong>in</strong>jection po<strong>in</strong>t comparable to the average depth <strong>in</strong> the measurement segment.To determ<strong>in</strong>e if mixture is complete, use the follow<strong>in</strong>g formula recommended by Rimmar (27) :⎛ C )- C ⎞⎜ 100 < 1 %C⎟⎝ ⎠(52 )where:ĈCis the maximum concentration at a po<strong>in</strong>t <strong>in</strong> the test section, <strong>in</strong> mg/l or μg/l;is the average concentration for all po<strong>in</strong>ts <strong>in</strong> the control section, <strong>in</strong> mg/l or μg/l.<strong>Booklet</strong> 7 - <strong>Flow</strong> <strong>Measurement</strong> <strong>Methods</strong> <strong>in</strong> <strong>Open</strong> <strong>Channels</strong> Page 169 of 223
In pipel<strong>in</strong>es, this calculation method does not determ<strong>in</strong>e the effectiveness of mix<strong>in</strong>g. S<strong>in</strong>ce measurementsegments are not as wide as rivers and s<strong>in</strong>ce walls <strong>in</strong> a flow segment are usually quite uniform, sampl<strong>in</strong>g atthe test po<strong>in</strong>t should be carried out at one po<strong>in</strong>t, not at three po<strong>in</strong>ts <strong>in</strong> the cross section. Use the equationshown <strong>in</strong> section 4.1.3.1.10 to determ<strong>in</strong>e the correct length of the measurement segment.4.1.3.1.10 <strong>Measurement</strong> segmentThe measurement segment must conta<strong>in</strong> few locations of dead water (such as observation wells) which<strong>in</strong>crease retention time and cause small concentrations of the tracer to appear, and are more difficult tomeasure accurately. A rapid cross section mixture reduces measurement time and the length of themeasur<strong>in</strong>g segment. Water depth plays an important role <strong>in</strong> the mix<strong>in</strong>g process (30) .The follow<strong>in</strong>g conditions should be exam<strong>in</strong>ed when choos<strong>in</strong>g a measurement segment:−−a turbulent flow that allows the tracer to mix effectively;a long enough measur<strong>in</strong>g segment to ensure proper mix<strong>in</strong>g.The follow<strong>in</strong>g factors should also be considered:−−an <strong>in</strong>flow of liquid between the <strong>in</strong>jection and sampl<strong>in</strong>g po<strong>in</strong>t, which <strong>in</strong>creases the distance necessary toobta<strong>in</strong> proper mix<strong>in</strong>g (3) (30) ;loss of liquid between the <strong>in</strong>jection and sampl<strong>in</strong>g po<strong>in</strong>ts, which can misrepresent results.Page 170 of 223<strong>Booklet</strong> 7 - <strong>Flow</strong> <strong>Measurement</strong> <strong>Methods</strong> <strong>in</strong> <strong>Open</strong> <strong>Channels</strong>
Use the follow<strong>in</strong>g formula to determ<strong>in</strong>e the length of the segment necessary to ensure adequate mix<strong>in</strong>g (30) :Lmv= k(BE z2)(53 )where:L mis the length of mixture <strong>in</strong> meters or feet;k is a constant (0.46 with the metric system and 0.14 with the imperial system);v is the average velocity of flow <strong>in</strong> meters or feet per second;B is the average width of flow <strong>in</strong> meters or feet;E z is 1.13 (d 3/2 S 1/2 ); or 0.2 (d * u);g is the gravitational constant (9.8 meters/s 2 or 32.17 feet/s 2 );d is the average depth of the <strong>in</strong> meters or feet;s is the slope of the flow area <strong>in</strong> meters per meter or feet per foot;u is equal to (g dS) 1/2The length that is determ<strong>in</strong>ed is measured from the last water <strong>in</strong>flow po<strong>in</strong>t, upstream from the sampl<strong>in</strong>gpo<strong>in</strong>t.In a river, the above equation should yield a result that corresponds to approximately 30 to 40 times theaverage width of the measurement segment.For an artificial channel, the recommended length is at least 20 times the diameter of the conduit, becausefor small conduits (< 0.6 meters or 2 feet), the equation produces lower values.4.1.3.1.10.1 Injection po<strong>in</strong>t−−−−−An <strong>in</strong>jection po<strong>in</strong>t must be chosen beforehand <strong>in</strong> order to ensure that it can be accessed.It must be located <strong>in</strong> a turbulent flow. A turbulent flow can be created when necessary.Access to the <strong>in</strong>jection po<strong>in</strong>t must be secure.It must be located at a site that does not <strong>in</strong>terfere with vehicular traffic.It must be large enough to enable <strong>in</strong>jection equipment to be <strong>in</strong>stalled.4.1.3.1.10.2 Sampl<strong>in</strong>g po<strong>in</strong>t−−−A sampl<strong>in</strong>g po<strong>in</strong>t must be chosen beforehand, <strong>in</strong> accordance with access and security criteria.The presence or absence of turbulence is of little importance.It must be located at a site that does not <strong>in</strong>terfere with vehicular traffic and that is large enough toallow sampl<strong>in</strong>g equipment to be set up.<strong>Booklet</strong> 7 - <strong>Flow</strong> <strong>Measurement</strong> <strong>Methods</strong> <strong>in</strong> <strong>Open</strong> <strong>Channels</strong> Page 171 of 223
4.1.3.1.11 Method of execution<strong>Flow</strong> measurement us<strong>in</strong>g the dilution method can be performed us<strong>in</strong>g a slug <strong>in</strong>jection or constant <strong>in</strong>jectionof a tracer.4.1.3.2 Slug <strong>in</strong>jectionThis method is sometimes called the total recovery method.4.1.3.2.1 Pr<strong>in</strong>ciple of the method<strong>Flow</strong> is calculated accord<strong>in</strong>g to the rate at which a tracer is diluted with the flow, based on a completeevaluation of its mass downstream from the <strong>in</strong>jection po<strong>in</strong>t.This pr<strong>in</strong>ciple may translate <strong>in</strong>to the follow<strong>in</strong>g equation, which expresses flow as a function the mass of thetracer (30) :MQ=Ac(54 )where:QMA cis the volume of the flow measured;is the mass of the tracer <strong>in</strong>jected;is the area located below the response curve follow<strong>in</strong>g satisfactory mix<strong>in</strong>g of thetracer with the flow (30) .This measurement method requires an exact knowledge of the total amount of tracer that is <strong>in</strong>jected and theconcentration of tracer <strong>in</strong> the flow, throughout the entire period it can be detected.Page 172 of 223<strong>Booklet</strong> 7 - <strong>Flow</strong> <strong>Measurement</strong> <strong>Methods</strong> <strong>in</strong> <strong>Open</strong> <strong>Channels</strong>
The discharge equation is therefore as follows (35) :where:Q sC oC 1C 2t 3t 2t( 1 2 − C0C − C0)V = QS∫ ( Co)dt(55 )is the flowrate;is the natural concentration of tracer <strong>in</strong> the flow, prior to <strong>in</strong>jection;is the concentration of tracer <strong>in</strong>jected;is the concentration of tracer follow<strong>in</strong>g mix<strong>in</strong>g;V is the volume of the tracer <strong>in</strong>jection;dt is the elapsed time (t 3 - t 2 );is the time of the end of movement of the tracer to the test po<strong>in</strong>t, <strong>in</strong> m<strong>in</strong>utes;is the time of the beg<strong>in</strong>n<strong>in</strong>g of the movement of the tracer to the test po<strong>in</strong>t, <strong>in</strong>m<strong>in</strong>utes.If the natural concentration (C o ) of the tracer <strong>in</strong> the flow is negligible, the equation can be simplified asfollows:Qs=Vt∫oCC21dt(56 )4.1.3.2.2 UsesThe slug <strong>in</strong>jection measurement method is used where:− radioactive tracers are used. This is almost the only method that can be used with this type of tracer (30) ;− the measurement segment is relatively short. Long segments can result <strong>in</strong> a loss of tracer and causeunsatisfactory measurements (30) ;− the <strong>in</strong>jection equipment available is limited (30) .4.1.3.2.3 ImplementationThe slug <strong>in</strong>jection method consists of <strong>in</strong>troduc<strong>in</strong>g a known amount of tracer to the flow as quickly aspossible and measur<strong>in</strong>g the concentration of the tracer downstream at regular <strong>in</strong>tervals <strong>in</strong> order to plotdilution-flow response curves. Because the measurement segment is usually relatively short, the time ittakes for a tracer to move downstream rarely exceeds more than one hour (30) .The success of implement<strong>in</strong>g this formula lies <strong>in</strong> the fact that the mass of the tracer <strong>in</strong>jected is totallyrecovered at the test po<strong>in</strong>t. Calculation of recovery consists of multiply<strong>in</strong>g the area of the response curve<strong>Booklet</strong> 7 - <strong>Flow</strong> <strong>Measurement</strong> <strong>Methods</strong> <strong>in</strong> <strong>Open</strong> <strong>Channels</strong> Page 173 of 223
(A c ) {concentration by the amount of time that has elapsed (C 2 ) (dt)}, by the flowrate (Q s ). It is thereforeextremely important to ensure that the area of the response curve (A c ) is representative of the dilution of thetracer <strong>in</strong>jected (31) .The response curve must be measured relatively further downstream from the <strong>in</strong>jection po<strong>in</strong>t to enableadequate mix<strong>in</strong>g. Once mix<strong>in</strong>g has occurred, the surface below the concentration curve as a function oftime is the same, regardless of the shape of the curve, for samples taken at different po<strong>in</strong>ts along the widthof the discharge (30) .At least 30 samples are required to plot this curve (35) .When us<strong>in</strong>g this measurement method, follow these steps:• Select the measurement segmentEstimate the characteristics of the measurement segment:−−−−−average width (B);average depth (d);velocity of flow (v);flowrate (Q);slope of the measurement segment (s).Determ<strong>in</strong>e the length of the measurement segment required.The required length is calculated accord<strong>in</strong>g to equation 53 <strong>in</strong> section 4.1.3.1.10.Page 174 of 223<strong>Booklet</strong> 7 - <strong>Flow</strong> <strong>Measurement</strong> <strong>Methods</strong> <strong>in</strong> <strong>Open</strong> <strong>Channels</strong>
• Choos<strong>in</strong>g a tracerExam<strong>in</strong>e the discharge for parameters that may <strong>in</strong>terfere with tracers, such as the pH, color,presence of suspended matter, presence of m<strong>in</strong>erals, etc., and determ<strong>in</strong>e the tracer’s recovery<strong>in</strong>dex accord<strong>in</strong>g to the method described <strong>in</strong> section 4.1.3.1.8 of this document.Select the tracer that is best suited to conditions, based on <strong>in</strong>formation gathered and criterialisted <strong>in</strong> section 4.1.1.3.• Prepar<strong>in</strong>g the tracerThe tracer is prepared accord<strong>in</strong>g to the method described <strong>in</strong> section 4.1.1.4.To determ<strong>in</strong>e the amount of tracer required to carry out work, the follow<strong>in</strong>g <strong>in</strong>formation mustbe available:− the concentration of the tracer at the time of <strong>in</strong>jection (C 1 );− the projected concentration of the tracer after mix<strong>in</strong>g with the discharge (C 2 );− the estimated flowrate of the effluent discharge (Q);− the estimated time it takes the tracer to migrate to the test po<strong>in</strong>t (t F - t 1 ).The projected concentration of the tracer after mixture with the discharge (C 2 ) must be at least20 times the natural concentration of the discharge and must be between 0 and 20 μg/l <strong>in</strong> the(3) (30)case of rhodam<strong>in</strong>e WT, and between 0 and 3 mg/l <strong>in</strong> the case of lithium chloride (LiCl)(33) .Once these four parameters are known, the amount of tracer required can be determ<strong>in</strong>ed us<strong>in</strong>gthe follow<strong>in</strong>g equation:C=C− t2V Q( t F 11)1000(57 )where:VC 1C 2Qt Ft 1is the amount of tracer required, <strong>in</strong> milliliters;is the concentration of the tracer at the time of <strong>in</strong>jection <strong>in</strong> mg/l;is the concentration of the tracer after mix<strong>in</strong>g with the discharge, <strong>in</strong> mg/l;is the estimated flowrate <strong>in</strong> liters per m<strong>in</strong>ute;is the end time for migration of the tracer, <strong>in</strong> m<strong>in</strong>utes;is the start time for migration of the tracer, <strong>in</strong> m<strong>in</strong>utes.<strong>Booklet</strong> 7 - <strong>Flow</strong> <strong>Measurement</strong> <strong>Methods</strong> <strong>in</strong> <strong>Open</strong> <strong>Channels</strong> Page 175 of 223
• Field workTracer <strong>in</strong>jection:−−−−<strong>in</strong>stantly <strong>in</strong>ject the total amount of the prepared tracer <strong>in</strong>to the measurementsegment, <strong>in</strong> the centre of the discharge. Injection should be performed us<strong>in</strong>g aconta<strong>in</strong>er with a very large open<strong>in</strong>g to ensure that all of the solution is emptiedimmediately;when <strong>in</strong>ject<strong>in</strong>g the tracer, ensure that no amount of the tracer is lost due to splash<strong>in</strong>g,etc. by <strong>in</strong>troduc<strong>in</strong>g the tracer <strong>in</strong>to the discharge at least 2 to 3 <strong>in</strong>ches away from thesurface, especially if the procedure is carried out <strong>in</strong> relatively tight quarters, such asmanholes;beg<strong>in</strong> tim<strong>in</strong>g beg<strong>in</strong>s, notify <strong>in</strong>dividuals at the sampl<strong>in</strong>g po<strong>in</strong>t that the tracer has been<strong>in</strong>jected;measure and record water depth <strong>in</strong> the measurement segment to ensure that the flowrema<strong>in</strong>s constant.Sampl<strong>in</strong>g:Two types of samples are taken, control samples and measurement samples.The purpose of control samples is:− to verify and quantize the natural presence of tracer <strong>in</strong> the discharge;− to verify the stability of or fluctuations <strong>in</strong> the natural concentration of the tracer <strong>in</strong>the discharge;− to verify the concentration of the tracer <strong>in</strong>jected.Control samples:− a water sample (preferably two) is taken <strong>in</strong> the measurement segment to determ<strong>in</strong>ethe natural concentration of tracer <strong>in</strong> the water. These samples are taken evenbefore beg<strong>in</strong>n<strong>in</strong>g to handle the tracer, every three m<strong>in</strong>utes throughout the procedureand at the end of the <strong>in</strong>jection, to ensure that there have been no changes <strong>in</strong> thenatural concentration (27) ;− the sample must be taken at a location that is representative of the quality of flow,without risk of contam<strong>in</strong>ation by the tracer (27) ;− an approximately 50 ml sample (preferably two) of the <strong>in</strong>jection solution should betaken, to verify the concentration of solution and to prepare calibration standards, ifnecessary (30) .<strong>Measurement</strong> samples:−−samples are taken at the test po<strong>in</strong>t after the tracer has been <strong>in</strong>jected;they help to determ<strong>in</strong>e the concentration of the tracer after mix<strong>in</strong>g and to ascerta<strong>in</strong>the flow measurement <strong>in</strong> the measurement segment.Page 176 of 223<strong>Booklet</strong> 7 - <strong>Flow</strong> <strong>Measurement</strong> <strong>Methods</strong> <strong>in</strong> <strong>Open</strong> <strong>Channels</strong>
Sampl<strong>in</strong>g must be carried out dur<strong>in</strong>g the entire time the tracer is present. It must beg<strong>in</strong> beforethe tracer arrives at the test po<strong>in</strong>t and must cont<strong>in</strong>ue until no further sign of the tracer ispresent.A large number of samples are required to ensure that the tracer has completely migrated.In the case of wide channels, samples must be taken at three po<strong>in</strong>ts, at 1/6, 3/6 and 5/6 of thewidth of the channel if:−−the channel is wider than 8 feet and has uniform and seamless walls (example:concrete conduit);the channel is wider than 6 feet and has uniform but irregular sides (example: ditch).Sampl<strong>in</strong>g must cont<strong>in</strong>ue after an estimate of how long it takes the tracer to migrate. Sampl<strong>in</strong>gmust cont<strong>in</strong>ue for at least three to four times the amount of time that is required for themaximum concentration of the tracer to migrate to the test po<strong>in</strong>t. For example, if the maximumconcentration is projected to migrate to the test po<strong>in</strong>t 10 m<strong>in</strong>utes after <strong>in</strong>jection, sampl<strong>in</strong>g mustcont<strong>in</strong>ue after these ten m<strong>in</strong>utes for a period of at least 20 m<strong>in</strong>utes (preferably 40 m<strong>in</strong>utes).Samples must be taken <strong>in</strong> brief <strong>in</strong>tervals, less than one m<strong>in</strong>ute apart, and the exact time ofsampl<strong>in</strong>g must be noted for each sample.Each sample must be identified and prepared immediately for shipment to the laboratory.Samples must be stored out of direct sunlight, particularly <strong>in</strong> the case of light-sensitive tracers,such as dyes (30) .Sampl<strong>in</strong>g must be carried out by two <strong>in</strong>dividuals; one to take samples, the other to note andrecord the exact time of sampl<strong>in</strong>g (30) .To gauge the retention time of the maximum concentration of the tracer at the text po<strong>in</strong>t, it iscommon practice to use a dye to perform a prelim<strong>in</strong>ary test and to measure the travel time onthe basis of the visual effect of the mixture. If the tracer is <strong>in</strong>visible, a dye can be added to thestock solution for view<strong>in</strong>g and to omit the need to perform a prelim<strong>in</strong>ary test. The totalretention time is projected to last four times longer than the time necessary for the maximumconcentration to migrate (30) .<strong>Booklet</strong> 7 - <strong>Flow</strong> <strong>Measurement</strong> <strong>Methods</strong> <strong>in</strong> <strong>Open</strong> <strong>Channels</strong> Page 177 of 223
• Analysis of resultsThe concentration of tracers is usually determ<strong>in</strong>ed <strong>in</strong> a laboratory. If the tracer is a dye, it maybe more convenient to analyze the sample at the site, but this procedure is not mandatory. Ifsamples are analyzed at the site, they must still be stored for future reference.4.1.3.2.4 Advantages of a slug <strong>in</strong>jection−−−Injection of a tracer does not require a sophisticated <strong>in</strong>strument.Injection of a tracer requires few personnel and little time.Less tracer is required when us<strong>in</strong>g the slug <strong>in</strong>jection method, compared to the constant <strong>in</strong>jectionmethod. To measure smaller flows, 3 to 5 times less tracer is required than the amount required for theconstant <strong>in</strong>jection method. To measure large flows, the difference is marg<strong>in</strong>al.4.1.3.2.5 Disadvantages of slug <strong>in</strong>jection− The entire sequence must be sampled (27) .− Requires a large number of samples.− Can only be used to measure the segment where the flow is stable.4.1.3.2.6 Interpretation of resultsOnce samples have been taken at three po<strong>in</strong>ts, a concentration curve <strong>in</strong> relation to time is plotted for eachsampl<strong>in</strong>g po<strong>in</strong>t and the area of each curve is measured.The mixture is uniform when areas under the curves are identical. An average curve is plotted on the basisof these three curves (30) .The flow is determ<strong>in</strong>ed through use of the equation <strong>in</strong> section 4.1.3.2.1.4.1.3.2.7 Causes for errorTo m<strong>in</strong>imize errors due to handl<strong>in</strong>g, the follow<strong>in</strong>g po<strong>in</strong>ts should be verified:−−−−−−the concentration of the stock solution;rapid <strong>in</strong>jection (<strong>in</strong> one go) of the tracer;the amount of tracer <strong>in</strong>jected;loss of the tracer due to splash<strong>in</strong>g at the time of <strong>in</strong>jection;deterioration of the trac<strong>in</strong>g solution;a lack of consistency of the trac<strong>in</strong>g solution prior to <strong>in</strong>jection;Page 178 of 223<strong>Booklet</strong> 7 - <strong>Flow</strong> <strong>Measurement</strong> <strong>Methods</strong> <strong>in</strong> <strong>Open</strong> <strong>Channels</strong>
−−contam<strong>in</strong>ation of sampl<strong>in</strong>g conta<strong>in</strong>ers;changes <strong>in</strong> flowrate dur<strong>in</strong>g measurement.4.1.3.2.8 PrecisionUnder normal conditions, the method is accurate to with<strong>in</strong> ± 3 % (27) .4.1.3.3 Constant <strong>in</strong>jectionThe constant <strong>in</strong>jection method is an un<strong>in</strong>terrupted sequence of slug <strong>in</strong>jections of m<strong>in</strong>imum amounts of atracer. It is usually preferred over the slug <strong>in</strong>jection method, due largely to its superior precision.4.1.3.3.1 Pr<strong>in</strong>ciple of the methodThe constant flow <strong>in</strong>jection method consists of measur<strong>in</strong>g the concentration of the tracer present at the testpo<strong>in</strong>t when a state of stability is achieved (30) .The follow<strong>in</strong>g equation establishes the relationship between flow of the tracer and flow of effluent (30) :C1Q2= Q1C 2(58 )where:Q 2Q 1C 2C 1is the flowrate measured;is the <strong>in</strong>jection rate of the tracer;is the concentration of the tracer after mix<strong>in</strong>g with the discharge;is the concentration of the tracer at the <strong>in</strong>jection po<strong>in</strong>t, before mix<strong>in</strong>g with thedischarge.4.1.3.3.2 UsesThe constant <strong>in</strong>jection measurement method is used when:− the natural concentration of the tracer <strong>in</strong> the discharge may vary;− the flowrate may vary dur<strong>in</strong>g tests;− the greatest precision possible is desired (3o) .<strong>Booklet</strong> 7 - <strong>Flow</strong> <strong>Measurement</strong> <strong>Methods</strong> <strong>in</strong> <strong>Open</strong> <strong>Channels</strong> Page 179 of 223
4.1.3.3.3 ProcedureThis method consists of <strong>in</strong>ject<strong>in</strong>g a known concentration of tracer at a constant rate, and measur<strong>in</strong>g theconcentration after homogeneous mix<strong>in</strong>g with the discharge. The exact <strong>in</strong>jection rate and exactconcentration of the tracer must be known.The <strong>in</strong>jection rate must be much slower than the flow of effluent, and the optimum measurementconcentration must be much greater than the natural concentration of tracer <strong>in</strong> the effluent.To factor <strong>in</strong> the natural concentration level, the equation is as follows (27) :Q2C1= Q (1C2− C0)(59 )Where:Q 2Q 1C 1C 0C 2is the flowrate of the discharge;is the rate of <strong>in</strong>jection of the tracer;is the concentration of the tracer <strong>in</strong>jected;is the natural concentration of the tracer <strong>in</strong> the effluent;is the concentration of the tracer after mixture with the discharge.S<strong>in</strong>ce four variables are known, it is possible to calculate the flowrate of the discharge.Unlike a slug <strong>in</strong>jection, the response time of the curve does not have to be determ<strong>in</strong>ed, only the po<strong>in</strong>t wherethe maximum concentration is achieved and ma<strong>in</strong>ta<strong>in</strong>ed (plateau). Once this condition of stability isachieved, the pr<strong>in</strong>ciple of mass conservation applies and the amount of tracer <strong>in</strong>jected (Q 1 C 1 ) is equal to theamount of tracer that migrates to the test po<strong>in</strong>t (Q 2 C 2 ) (30) .The time necessary to measure the flow us<strong>in</strong>g one or more methods is approximately the same (30) . Theconstant <strong>in</strong>jection method, however, has the advantage of be<strong>in</strong>g able to cover a longer period ofmeasurement, by extend<strong>in</strong>g the <strong>in</strong>jection after a plateau has been reached.The time required to reach the po<strong>in</strong>t of equilibrium through cont<strong>in</strong>uous <strong>in</strong>jection can be determ<strong>in</strong>edprecisely by exam<strong>in</strong><strong>in</strong>g the response time of the curve that is generated with the slug <strong>in</strong>jection method, asshown below.Page 180 of 223<strong>Booklet</strong> 7 - <strong>Flow</strong> <strong>Measurement</strong> <strong>Methods</strong> <strong>in</strong> <strong>Open</strong> <strong>Channels</strong>
Instantaneous <strong>in</strong>jections1 2 3 4 5nPlateauResponse curvesInstantaneous <strong>in</strong>jections12345nConcentrationTimeThe above chart shows that the beg<strong>in</strong>n<strong>in</strong>g of the plateau, accord<strong>in</strong>g to the cont<strong>in</strong>uous method, co<strong>in</strong>cideswith the moment the tracer disappears, if only one <strong>in</strong>jection was made us<strong>in</strong>g the <strong>in</strong>stant method. In practice,the constant <strong>in</strong>jection period should be slightly longer than the period required to generate the first responsecurve, us<strong>in</strong>g the <strong>in</strong>stant method (30) .This method requires the follow<strong>in</strong>g steps:• Choos<strong>in</strong>g a measurement segmentEstimate the characteristics of the measurement segment:−−−−−average width (B);average depth (d);flow velocity (v);flowrate (Q);slope of the measurement segment (s).Determ<strong>in</strong>e the length of the segment required, us<strong>in</strong>g equation 53 <strong>in</strong> section 4.1.3.1.10.• Choos<strong>in</strong>g a tracerExam<strong>in</strong>e parameters <strong>in</strong> the discharge that may <strong>in</strong>terfere with tracers, such as the pH, color,presence of suspended matter, presence of m<strong>in</strong>erals, etc., and determ<strong>in</strong>e the tracer’s recovery<strong>in</strong>dex accord<strong>in</strong>g to the method described <strong>in</strong> section 4.1.3.1.8 of this document.Select the tracer that is best suited to conditions, based on <strong>in</strong>formation gathered and criterialisted <strong>in</strong> 4.1.1.3.<strong>Booklet</strong> 7 - <strong>Flow</strong> <strong>Measurement</strong> <strong>Methods</strong> <strong>in</strong> <strong>Open</strong> <strong>Channels</strong> Page 181 of 223
• Prepar<strong>in</strong>g the tracerThe tracer is prepared accord<strong>in</strong>g to the method described <strong>in</strong> section 4.1.1.4.To determ<strong>in</strong>e the amount of tracer that will be required for the procedure, the follow<strong>in</strong>g<strong>in</strong>formation must be known:− the concentration of the tracer at the time of <strong>in</strong>jection (C 1 );− the projected concentration of the tracer after mix<strong>in</strong>g with the discharge (C 2 );− the estimated flowrate of the effluent discharge (Q 2 );− the estimated time it takes the tracer to migrate to the test po<strong>in</strong>t (t 3 - t 2 ) <strong>in</strong> m<strong>in</strong>utes;− the elapsed time of the <strong>in</strong>jection after a plateau has been reached, <strong>in</strong> m<strong>in</strong>utes.Once these five parameters are known, the amount of tracer required can be determ<strong>in</strong>ed us<strong>in</strong>g the follow<strong>in</strong>gequation:V = ( tf −ti+ tpQ2C)C12(60 )where:VC 1C 2Q 2t ft it pis the amount of tracer required <strong>in</strong> liters;is the concentration of tracer at the time of <strong>in</strong>jection <strong>in</strong> mg/l;is the concentration of the tracer after mix<strong>in</strong>g with the discharge, <strong>in</strong> mg/l;is the estimated flowrate <strong>in</strong> liters per m<strong>in</strong>ute;is the end time for migration of the tracer, <strong>in</strong> m<strong>in</strong>utes;is the start time for migration of the tracer, <strong>in</strong> m<strong>in</strong>utes;is the <strong>in</strong>jection time after a plateau has been reached, <strong>in</strong> m<strong>in</strong>utes.A slightly larger amount (5 %) of tracer should be prepared than the amount calculated for thiswork, <strong>in</strong> order to be prepared for the unexpected.• Field workTracer <strong>in</strong>jection:A known concentration of the tracer is <strong>in</strong>jected cont<strong>in</strong>uously <strong>in</strong>to the discharge, us<strong>in</strong>g an<strong>in</strong>strument for which the <strong>in</strong>jection rate can be adjusted and controlled. The pr<strong>in</strong>cipal<strong>in</strong>struments used <strong>in</strong>clude: Mariotte vase, constant level vessel and feed pumps.No amount of tracer should be lost when it is <strong>in</strong>jected; ensure that no amount of thePage 182 of 223<strong>Booklet</strong> 7 - <strong>Flow</strong> <strong>Measurement</strong> <strong>Methods</strong> <strong>in</strong> <strong>Open</strong> <strong>Channels</strong>
tracer is lost due to splash<strong>in</strong>g, by <strong>in</strong>troduc<strong>in</strong>g the tracer <strong>in</strong>to the discharge at least 2 to 3<strong>in</strong>ches away from the surface of the water, especially when the procedure is carried out<strong>in</strong> relatively tight quarters, such as manholes.The <strong>in</strong>jection tube must not touch the water surface, to prevent tracer from be<strong>in</strong>g carriedby the stream and subsequently distort<strong>in</strong>g the rate of <strong>in</strong>jection.The <strong>in</strong>jection <strong>in</strong>strument must be calibrated before and after use to verify if the flow hasrema<strong>in</strong>ed constant.No air bubbles should be present <strong>in</strong> the <strong>in</strong>jection system, to ma<strong>in</strong>ta<strong>in</strong> a cont<strong>in</strong>uouspresence of trac<strong>in</strong>g solution <strong>in</strong> the tube.The tracer solution should be placed <strong>in</strong> a graduated conta<strong>in</strong>er; the level of solution mustbe recorded at time 0.2, 0.4, 0.6 and 0.8 of the total time of <strong>in</strong>jection. This observationserves as a counter-check to ensure that the rate of <strong>in</strong>jection is consistent.Sampl<strong>in</strong>g:There are two types of samples: control samples and measurement samples.The purpose of control samples is:−−−−to verify and quantize the natural presence of tracer <strong>in</strong> the discharge;verify the stability of or fluctuations <strong>in</strong> the natural concentration of the tracer <strong>in</strong>the discharge;verify the concentration of the <strong>in</strong>jection solution;determ<strong>in</strong>e the tracer recovery rate.Control samples:−a water sample (preferably two) is taken <strong>in</strong> the measurement segment, todeterm<strong>in</strong>e natural concentration of tracer <strong>in</strong> the water and any variations <strong>in</strong>concentration. These samples are taken even before beg<strong>in</strong>n<strong>in</strong>g to handle thetracer, every three m<strong>in</strong>utes throughout the procedure and at the end of the<strong>in</strong>jection (27) .The sample must be taken at a location that is representative of the quality offlow, without risk of contam<strong>in</strong>ation by the tracer (30) .−A sample (preferably two) of the <strong>in</strong>jection solution should be taken at the<strong>Booklet</strong> 7 - <strong>Flow</strong> <strong>Measurement</strong> <strong>Methods</strong> <strong>in</strong> <strong>Open</strong> <strong>Channels</strong> Page 183 of 223
eg<strong>in</strong>n<strong>in</strong>g and end of the procedure, to verify the concentration of solution.<strong>Measurement</strong> samples:<strong>Measurement</strong> samples are taken <strong>in</strong> the discharge, downstream from the tracer <strong>in</strong>jectionpo<strong>in</strong>t. These samples are used to determ<strong>in</strong>e the concentration of tracer at the test po<strong>in</strong>t.Enough samples must be taken to plot a m<strong>in</strong>imum number of po<strong>in</strong>ts on the responsecurve, that is, three po<strong>in</strong>ts on the upward curve and n<strong>in</strong>e po<strong>in</strong>ts on the plateau.Sampl<strong>in</strong>g must beg<strong>in</strong> before the tracer migrates to the test po<strong>in</strong>t, and must cont<strong>in</strong>ue aftera plateau has been reached.In the case of large channels, samples should be taken at three po<strong>in</strong>ts, at 1/6, 3/6 and 5/6 thewidth of the channel if:−−the channel is wider than 8 feet and has uniform and seamless walls(example: concrete conduit);the channel is wider than 6 feet and has uniform but irregular sides (example: ditch).Samples must be taken at brief <strong>in</strong>tervals, no more than five m<strong>in</strong>utes apart and at every m<strong>in</strong>ute,once a plateau is reached.The exact time of sampl<strong>in</strong>g must be <strong>in</strong>dicated for each sample.Each sample must be identified and prepared immediately for shipment to the laboratory.Samples must be stored out of direct sunlight, particularly <strong>in</strong> the case of light-sensitivetracers (30) .Sampl<strong>in</strong>g must be carried out by two <strong>in</strong>dividuals; one to take samples, the other to note andrecord the exact time of sampl<strong>in</strong>g (30) .It is common practice to use a dye to perform a prelim<strong>in</strong>ary test and to measure travel time onthe basis of the visual effect of the mixture. If a chemical tracer is used, a dye can be added (solong as it does not cause <strong>in</strong>terference) to omit the need to perform a prelim<strong>in</strong>ary test.• Analysis of results;Page 184 of 223<strong>Booklet</strong> 7 - <strong>Flow</strong> <strong>Measurement</strong> <strong>Methods</strong> <strong>in</strong> <strong>Open</strong> <strong>Channels</strong>
The concentration of tracers is usually determ<strong>in</strong>ed <strong>in</strong> a laboratory. If the tracer is a dye, it maybe more convenient to analyze the sample at the site; samples must nonetheless be stored forfuture reference.4.1.3.3.4 Advantages of constant <strong>in</strong>jectionFewer samples are required for analysis than the slug <strong>in</strong>jection method.This method enables measurements to be taken <strong>in</strong> segments where the flow <strong>in</strong> not constant, so long as the<strong>in</strong>jection time is extended and the <strong>in</strong>terval between samples is less than one m<strong>in</strong>ute.This method provides greater precision than the slug <strong>in</strong>jection method.4.1.3.3.5 Disadvantages of constant <strong>in</strong>jectionInjection of the tracer requires cont<strong>in</strong>uous attention.Injection of the tracer requires an <strong>in</strong>jection <strong>in</strong>strument, the rate of which can be adjusted and controlledprecisely.To measure smaller flows, 3 to 5 times more tracer is required than the amount required for the slug<strong>in</strong>jection method. To measure large flows, the difference is marg<strong>in</strong>al.4.1.3.3.6 Interpretation of resultsOnce samples have been taken at three po<strong>in</strong>ts, a concentration curve as a function of time is plotted for eachsampl<strong>in</strong>g po<strong>in</strong>t.Response curvesCont<strong>in</strong>uous <strong>in</strong>jections3 sampl<strong>in</strong>g po<strong>in</strong>tsPlateauConcentrationsabResponse curvesInstantaneous <strong>in</strong>jections3 sampl<strong>in</strong>g po<strong>in</strong>tscTimeAn identical profile for all three curves <strong>in</strong>dicates that the mixture is uniform and that the duration of<strong>in</strong>jection is satisfactory.<strong>Booklet</strong> 7 - <strong>Flow</strong> <strong>Measurement</strong> <strong>Methods</strong> <strong>in</strong> <strong>Open</strong> <strong>Channels</strong> Page 185 of 223
The tracer <strong>in</strong>jection period must be sufficient to produce three identical curves, and only concentrationssituated on the plateau should be used to calculate the flowrate.The stability (plateau) between the three po<strong>in</strong>ts is rarely reached at the same moment, because thetransversal flow velocities are different between each po<strong>in</strong>t.<strong>Flow</strong> is determ<strong>in</strong>ed us<strong>in</strong>g the follow<strong>in</strong>g equation:where:Q 1C 0C 1C 2Q 2C1Q2= Q1(C 2 − C0) (61)is the tracer <strong>in</strong>jection rate <strong>in</strong> ml/m<strong>in</strong>;is the natural concentration of tracer <strong>in</strong> the effluent <strong>in</strong> μg/l;is the <strong>in</strong>jection concentration of the tracer <strong>in</strong> mg/l;is the concentration of the tracer at the test po<strong>in</strong>t <strong>in</strong> μg/l;is the flowrate of the discharge <strong>in</strong> l/m<strong>in</strong>.If recovery tests (I r ) show a deviation between the analytical value measured and the theoretical value, dueto <strong>in</strong>terferences between the tracer and effluent, to obta<strong>in</strong> the absolute flow, the recovery <strong>in</strong>dex (I r ) must be<strong>in</strong>cluded <strong>in</strong> the above formula to reflect this situation.The formula is therefore as follows:C1Q2= Q1()IC2− C0r(62 )Page 186 of 223<strong>Booklet</strong> 7 - <strong>Flow</strong> <strong>Measurement</strong> <strong>Methods</strong> <strong>in</strong> <strong>Open</strong> <strong>Channels</strong>
4.1.3.3.7 Causes of errorThe pr<strong>in</strong>cipal causes of error and items to verify to m<strong>in</strong>imize errors are as follows:CAUSES OF ERRORCORRECTIONSNon-uniform tracer solutionError regard<strong>in</strong>g the concentration of stocksolutionInadequate mixture of the tracer solution withthe effluentBreakdown of the tracer solution dur<strong>in</strong>g<strong>in</strong>jectionBreakdown of the tracer solution upon contactwith the flowUnstable rate of <strong>in</strong>jectionLoss of tracer solution at the <strong>in</strong>jection po<strong>in</strong>tAnalysis problemsLarge deviation <strong>in</strong> concentrations on the plateauof the curveConstant mix<strong>in</strong>g dur<strong>in</strong>g <strong>in</strong>jectionCompare the theoretical value with the analyticalvalueChange the sampl<strong>in</strong>g po<strong>in</strong>ts, create turbulence atthe tracer <strong>in</strong>jection po<strong>in</strong>tProtect the solution from exposure to direct sunlightdur<strong>in</strong>g the entire operationPerform recovery tests before and dur<strong>in</strong>gmeasurements- Calibrate the <strong>in</strong>jection <strong>in</strong>strument at the beg<strong>in</strong>n<strong>in</strong>gand end of procedure;- check for the presence of air bubbles <strong>in</strong> the<strong>in</strong>jection system;- place the tracer solution <strong>in</strong> a graduated conta<strong>in</strong>erand take note of the volume that is <strong>in</strong>jected atdifferent moments dur<strong>in</strong>g the <strong>in</strong>jection procedure;- do not allow the <strong>in</strong>jection tube to come <strong>in</strong>tocontact with the water surfacePosition the <strong>in</strong>jection tube near the water surface toprevent splash<strong>in</strong>gIn the event that sampl<strong>in</strong>g conta<strong>in</strong>ers have beencontam<strong>in</strong>ated, check the analytical method and rateof recoveryVerify the permanence of the flow pattern bycont<strong>in</strong>uously record<strong>in</strong>g the water depth <strong>in</strong> themeasurement segment<strong>Booklet</strong> 7 - <strong>Flow</strong> <strong>Measurement</strong> <strong>Methods</strong> <strong>in</strong> <strong>Open</strong> <strong>Channels</strong> Page 187 of 223
4.1.3.3.8 PrecisionIn normal conditions, the deviation <strong>in</strong> measurements us<strong>in</strong>g the constant <strong>in</strong>jection method is approximately1 %, which means that it is accurate to with<strong>in</strong> 99 % ( 27) .4.2. Volumetric methodIn the case of small flows, the volumetric method often appears to be the simplest method for perform<strong>in</strong>g apo<strong>in</strong>t-specific measurement.4.2.1. Pr<strong>in</strong>ciple of the methodThis method, which is a “gauged-capacity” type, consists of fill<strong>in</strong>g a conta<strong>in</strong>er, the exact volume of whichis known, and track<strong>in</strong>g the time required to fill it. The follow<strong>in</strong>g equation <strong>in</strong>terprets the relation between theflow, volume and time:Q =V/t(63 )where:QVtis the flowrate as a function of time unit;is the volume;is the time unit.4.2.2. ApplicationsThe volumetric method is generally used for:−−−po<strong>in</strong>t-specific flow measurements;flow measurements where the flowrate is steady;calibration of primary measur<strong>in</strong>g devices.This method can be adapted us<strong>in</strong>g a tipp<strong>in</strong>g bucket to obta<strong>in</strong> cont<strong>in</strong>uous flow measurements. Use of thisdevice, however, is limited to flowrates of less than 150 m 3 /h.4.2.3. AdvantagesThe pr<strong>in</strong>cipal advantages of the volumetric method are:−−−the speed at which it can be performed;the extreme precision of results;its cost-effectiveness.Page 188 of 223<strong>Booklet</strong> 7 - <strong>Flow</strong> <strong>Measurement</strong> <strong>Methods</strong> <strong>in</strong> <strong>Open</strong> <strong>Channels</strong>
4.2.4. DisadvantagesThe pr<strong>in</strong>cipal disadvantages of this method are:−−−usually limited to measur<strong>in</strong>g small flowrates (< 100 liters/m<strong>in</strong>ute);usually allows only po<strong>in</strong>t-specific measurements to be taken;to measure large flows, requires the presence of a regular shape reservoir, the capacity of which atdifferent levels can be measured with 99 % precision.4.2.5. Equipment requiredTo measure small flowrates (< 100 liters/m<strong>in</strong>ute):−−a graduated conta<strong>in</strong>er (± 20 liters);a chronometer.To measure large flowrates (> 100 liters/m<strong>in</strong>ute):−−−−a tank of suitable dimensions;a tape measure;a level <strong>in</strong>dicator;a chronometer.4.2.6. PersonnelTwo <strong>in</strong>dividuals are usually required to perform this type of measurement.4.2.7. ProcedureThere are two techniques to measure small flows:−−the first technique consists of fill<strong>in</strong>g a conta<strong>in</strong>er, the exact volume of which is known, and us<strong>in</strong>g achronometer to calculate how long it takes to fill the conta<strong>in</strong>er;the second consists of calculat<strong>in</strong>g the time necessary to fill a conta<strong>in</strong>er and then evaluat<strong>in</strong>g the amountof liquid recovered by weigh<strong>in</strong>g the liquid or measur<strong>in</strong>g its volume.For this type of measurement, the flow should orig<strong>in</strong>ate from a conduit with a free-fall discharge.For measurement of large flows, the method consists of:−−precisely calibrat<strong>in</strong>g a regular shaped tank, <strong>in</strong> order to be able to determ<strong>in</strong>e its volume, at all levels,with 99 % precision;track the amount of time that is required to vary the water level between the <strong>in</strong>itial level and f<strong>in</strong>al level.<strong>Booklet</strong> 7 - <strong>Flow</strong> <strong>Measurement</strong> <strong>Methods</strong> <strong>in</strong> <strong>Open</strong> <strong>Channels</strong> Page 189 of 223
4.2.7.1 Number of testsThe method requires three tests to be performed. The deviation between each test must not exceed 2 %. Ifdeviation is greater than 2 %, determ<strong>in</strong>e the causes and repeat the entire operation.4.2.7.2 Test periodIn all cases, time is calculated <strong>in</strong> seconds.To measure large flowrates, each test should take at least five m<strong>in</strong>utes.To measure small flowrates, each test should take at least the number of seconds <strong>in</strong>dicated:<strong>Flow</strong>rate (liters perm<strong>in</strong>ute)Time <strong>in</strong> seconds10 12020 6030 4040 3050 2560 2070 1780 1590 12100 124.2.8. PrecisionA flow measurement us<strong>in</strong>g the volumetric method may yield results with a deviation of ± 1 %, whenmeasurement is carried out with attention to detail.−The volume of a conta<strong>in</strong>er must be measured precisely, because most errors can be attributed to thisvariable.Page 190 of 223<strong>Booklet</strong> 7 - <strong>Flow</strong> <strong>Measurement</strong> <strong>Methods</strong> <strong>in</strong> <strong>Open</strong> <strong>Channels</strong>
−If the dimensions cannot be measured exactly, the volume can be deducted by weigh<strong>in</strong>g. This method,however, can be burdensome and even impracticable, <strong>in</strong> the case of large flowrates.4.3. <strong>Flow</strong> measurement us<strong>in</strong>g pump<strong>in</strong>g stations<strong>Flow</strong> measurement us<strong>in</strong>g pump<strong>in</strong>g stations provides real-time <strong>in</strong>formation about the amount of water that ismov<strong>in</strong>g <strong>in</strong> the dra<strong>in</strong>age system.4.3.1. <strong>Measurement</strong> pr<strong>in</strong>ciple<strong>Flow</strong> measurement us<strong>in</strong>g pump<strong>in</strong>g stations requires knowledge of the operat<strong>in</strong>g time and capacity of eachpump<strong>in</strong>g station.The follow<strong>in</strong>g equation applies:V = Qpt(64 )where:V is the total volume drawn by a pump <strong>in</strong> m 3 ;Q p is the pump’s absolute flowrate <strong>in</strong> m 3 as a function of time;t is the time measured.To determ<strong>in</strong>e the capacity of a pump or pumps <strong>in</strong> a pump<strong>in</strong>g well, refer to the curves that are characteristicof the pumps, which are supplied by the manufacturer. This method may, however, <strong>in</strong>clude some errors thatmay significantly affect the precision of a measurement (wear of the pump motor, wear of the pump itself,deviation of the static head, viscosity of liquid, etc.). Pumps must therefore be calibrated.4.3.2. Applications<strong>Measurement</strong> of flow us<strong>in</strong>g pump<strong>in</strong>g stations allows the follow<strong>in</strong>g:−−−−to determ<strong>in</strong>e the amount of water flow<strong>in</strong>g through particular sections of a dra<strong>in</strong>age network, whenseveral pump<strong>in</strong>g stations are connected to the same network;to determ<strong>in</strong>e the amount of water flow<strong>in</strong>g <strong>in</strong> real time through a dra<strong>in</strong>age network and to becomeaware of changes <strong>in</strong> flow;to determ<strong>in</strong>e the amount of <strong>in</strong>filtration water <strong>in</strong> the dra<strong>in</strong>age network;to quantize the volume of water flow<strong>in</strong>g through a network, over long periods.To determ<strong>in</strong>e the volume of water a pump<strong>in</strong>g station supplies over long periods, simply keep track of theoperat<strong>in</strong>g time of pumps, by <strong>in</strong>stall<strong>in</strong>g a timer <strong>in</strong> the pump control panel. S<strong>in</strong>ce the period of operation ofone or more pumps (at a constant speed) is directly proportional to the volume delivered by the pumps, thetotal volume delivered by a pump can be determ<strong>in</strong>ed.<strong>Booklet</strong> 7 - <strong>Flow</strong> <strong>Measurement</strong> <strong>Methods</strong> <strong>in</strong> <strong>Open</strong> <strong>Channels</strong> Page 191 of 223
4.3.3. Calibration of pumpsCalibration of pump<strong>in</strong>g stations consists of precisely determ<strong>in</strong><strong>in</strong>g the volume of water each pump candeliver over a given period, at a constant speed. To ascerta<strong>in</strong> the absolute volumetric flowrate for eachpump, the volume (V) variable has to be determ<strong>in</strong>ed and the time (t) variable has to be measured.A pump’s capacity is expressed by the follow<strong>in</strong>g relation:VQp=t p(65 )where:Q pis the pump’s capacity;V is the volume pumped <strong>in</strong> m 3 ;t p is the time that is required to pump the volume (V).4.3.4. Personnel and equipmentCalibration of a pump<strong>in</strong>g station requires at least two <strong>in</strong>dividuals and use of the follow<strong>in</strong>g equipment:−−a chronometer;a tape measure.4.3.5. Information that should be notedThe follow<strong>in</strong>g <strong>in</strong>formation must be verified and noted when calibrat<strong>in</strong>g a pump<strong>in</strong>g station:−−−−−−−the serial number of pumps and their <strong>in</strong>spections;orig<strong>in</strong>al pump specifications;the type of pump<strong>in</strong>g well (wet, dry);the normal position of high-level and low-level alarms, if present;the presence of an overflow dra<strong>in</strong>, and where it is located <strong>in</strong> the well;the existence of submerged conduits supply<strong>in</strong>g the well;the presence of and status of check valves.4.3.6. Advantages<strong>Flow</strong> measurement us<strong>in</strong>g pump<strong>in</strong>g stations has the follow<strong>in</strong>g advantages:−−−requires few personnel;requires little equipment;flow can be measured over very long time periods.Page 192 of 223<strong>Booklet</strong> 7 - <strong>Flow</strong> <strong>Measurement</strong> <strong>Methods</strong> <strong>in</strong> <strong>Open</strong> <strong>Channels</strong>
4.3.7. Disadvantages<strong>Flow</strong> measurement us<strong>in</strong>g pump<strong>in</strong>g stations has the follow<strong>in</strong>g disadvantages:−−−−pump<strong>in</strong>g stations must be closely monitored;does not take <strong>in</strong>to account spillovers from overflow pipes;cannot be carried out with us<strong>in</strong>g variable-flow pumps;the precision of measurements is variable and depends on how often calibrations are performed.4.3.8. Calibration methodRegardless of the shape of the pump<strong>in</strong>g well, it is important first to determ<strong>in</strong>e the exact volume that will bepumped and the amount of time the pump will require to transfer the exact volume of water.4.3.8.1 Calculation of the pump<strong>in</strong>g volumeThe most common calculation of the volume of wells <strong>in</strong> the water treatment field is based on geometricfeatures.4.3.8.1.1 Rectangular wellsCalculation of the surface of a well (A)To determ<strong>in</strong>e the surface of a well, the follow<strong>in</strong>g equation must be used to measure the horizontalsection of a well:A = L* l(66 )where:A is the surface of a well <strong>in</strong> square meters (m 2 );L is the length of a well <strong>in</strong> meters (m);l is the width of a well <strong>in</strong> meters (m).<strong>Booklet</strong> 7 - <strong>Flow</strong> <strong>Measurement</strong> <strong>Methods</strong> <strong>in</strong> <strong>Open</strong> <strong>Channels</strong> Page 193 of 223
4.3.8.1.2 Circular wellCalculation of the surface of a well (A)To determ<strong>in</strong>e the surface of a well, the horizontal section must be measured us<strong>in</strong>g the follow<strong>in</strong>gequation:2πA=D(67 )4where:A is the surface of a well <strong>in</strong> square meters (m 2 );D is the diameter of a well <strong>in</strong> meters (m);π is equal to 3.1416.Calculation of the depth of water pumped (h)The depth of the water (h) pumped is the result of the difference between the water level <strong>in</strong> the well,immediately before pumps are started (h 0 ), and the water level <strong>in</strong> the well (h f ), immediately afterpumps are stopped, which translates <strong>in</strong>to the follow<strong>in</strong>g equation:h= h0 −hf(68 )Calculation of the pump<strong>in</strong>g volume (V)To calculate the pump<strong>in</strong>g volume, the area of the well must be comb<strong>in</strong>ed with the depth of the waterpumped. This operation results <strong>in</strong> the follow<strong>in</strong>g equation:V = Ah(69 )where:V is the volume of water pumped <strong>in</strong> cubic meters (m 3 ) per time unit;A is the surface of s well <strong>in</strong> square meters (m 2 );h is the depth of water pumped <strong>in</strong> meters (m).Note: In the case of small wells that conta<strong>in</strong> submerged pumps, the volume occupied by the pumps andany other accessories must be subtracted from the total volume of the pump<strong>in</strong>g well.Page 194 of 223<strong>Booklet</strong> 7 - <strong>Flow</strong> <strong>Measurement</strong> <strong>Methods</strong> <strong>in</strong> <strong>Open</strong> <strong>Channels</strong>
4.3.8.2 Calculation of pump<strong>in</strong>g timePump<strong>in</strong>g time (t p ) is the amount of time that pumps are <strong>in</strong> operation, that is, the amount of time that elapsesbetween the time pumps are started (t 0 ) and stopped (t f ), and is represented by the follow<strong>in</strong>g equation:t p = t f − t0(70 )4.3.8.2.1 Insulated wellsIf a pump<strong>in</strong>g well is <strong>in</strong>sulated, that is, if the flow of water enter<strong>in</strong>g the pump<strong>in</strong>g well is drawn off, the pumpcapacity is determ<strong>in</strong>ed <strong>in</strong> the follow<strong>in</strong>g manner:−−the pump<strong>in</strong>g volume (V), as described above;the pump<strong>in</strong>g time, that is, the amount of time a pump requires (t p ) to extract a determ<strong>in</strong>ed volume (V)is measured.A pump’s absolute flow is determ<strong>in</strong>ed us<strong>in</strong>g the follow<strong>in</strong>g equation:VQp= (71)t pwhere:Q p is the pump’s absolute flowrate <strong>in</strong> m 3 /sec;V is the volume of water extracted by the pump;t p is the time necessary to extract the volume of water V.Note: A pump<strong>in</strong>g well should be <strong>in</strong>sulated dur<strong>in</strong>g calibration, to reduce the risk of error.4.3.8.2.2 Un<strong>in</strong>sulated wellsIf a pump<strong>in</strong>g well cannot be <strong>in</strong>sulated, that is, if the flow of water enter<strong>in</strong>g the pump<strong>in</strong>g well cannot beextracted, the follow<strong>in</strong>g is required:−−establish the <strong>in</strong>let flow;determ<strong>in</strong>e the pump’s flow capacity.To establish the <strong>in</strong>let flow:−measure the water-level recovery time (t r ), that is, the time it takes the water level <strong>in</strong> a well to rise to adeterm<strong>in</strong>ed height (h r );<strong>Booklet</strong> 7 - <strong>Flow</strong> <strong>Measurement</strong> <strong>Methods</strong> <strong>in</strong> <strong>Open</strong> <strong>Channels</strong> Page 195 of 223
−determ<strong>in</strong>e the water-level recovery flowrate (Q <strong>in</strong> ) us<strong>in</strong>g the follow<strong>in</strong>g equation:Q<strong>in</strong>V=tr(72 )where:Q <strong>in</strong> is the flow enter<strong>in</strong>g the pump<strong>in</strong>g station;V is the volume of the water-level recovery, (V = A*h r );t r is the time of the water-level recovery;A is the area of the well;is the height of the water-level recovery.h rTo determ<strong>in</strong>e the pump’s flow capacity:−−establish the pump<strong>in</strong>g volume (V), as described above;determ<strong>in</strong>e the pump<strong>in</strong>g time, that is, the time the pump requires (t p ) to extract a determ<strong>in</strong>ed volume(V).The pump’s absolute flow capacity is determ<strong>in</strong>ed us<strong>in</strong>g the follow<strong>in</strong>g equation:Qp= Q<strong>in</strong>V+t p(73 )where:Q pQ <strong>in</strong>is the pump’s absolute flow capacity <strong>in</strong> m 3 as a function of time unit;is the flowrate enter<strong>in</strong>g the pump<strong>in</strong>g station, <strong>in</strong> m 3 as a function of time unit;V is the volume of water extracted by the pump, <strong>in</strong> m 3 ;t p is the time necessary to extract the volume (V).Note: Insulation of a pump<strong>in</strong>g well dur<strong>in</strong>g calibration is recommended, to reduce error.4.3.8.3 Calibration conditionsPumps should be calibrated under the follow<strong>in</strong>g conditions:−−−−normal pump operat<strong>in</strong>g conditions are present;time and pump<strong>in</strong>g volume are calculated when the pump reaches its permanent runn<strong>in</strong>g speed, becausestart<strong>in</strong>g and stopp<strong>in</strong>g a pump causes a transient flow pattern, from no flow to maximum flow;ensure that valves on the pump pressure l<strong>in</strong>e are watertight to prevent a backflow of water <strong>in</strong>to thepump<strong>in</strong>g well;<strong>in</strong> the case of un<strong>in</strong>sulated wells, the <strong>in</strong>let flowrate (Q <strong>in</strong> ) is constant.Page 196 of 223<strong>Booklet</strong> 7 - <strong>Flow</strong> <strong>Measurement</strong> <strong>Methods</strong> <strong>in</strong> <strong>Open</strong> <strong>Channels</strong>
4.3.8.4 Number of testsWhen a pump<strong>in</strong>g station is calibrated, at least three separate test runs must be performed on each pumpdur<strong>in</strong>g solo operation, and three tests dur<strong>in</strong>g comb<strong>in</strong>ed operation, depend<strong>in</strong>g on how pumps are set up.To be acceptable, the deviation between each test must be less than 5 % of the average test value. If thedeviation exceeds 5 %, all tests must be repeated.The average for all three tests represents the pump’s capacity.4.3.8.5 Frequency of calibrationPumps must be calibrated each year if:−−−the pumps are operated;the pumps have been rebuilt;major repairs, that may affect the pump’s capacity, are carried out.4.3.8.6 Precision of calibrationThe precision of the pump calibration method depends on the precision of the pump<strong>in</strong>g volume andpump<strong>in</strong>g time measurement.The dimensional parameter variable is usually the water depth. If a constant systematic error is presumed,the greater the water depth, the smaller the error.Example:Presum<strong>in</strong>g a systematic water depth measurement error of 2 cm, for a depth of0.5 m, the error will be ± 4 %; and for a depth of 4 m, the error will only be ± 0.5%.The maximum systematic error, for the time variable, likely cannot be reduced to less than two seconds fora complete pump<strong>in</strong>g cycle (start – stop). Presum<strong>in</strong>g a constant systematic error, the longer the pump<strong>in</strong>gtime, the smaller the error.Example:For a pump<strong>in</strong>g time of 20 seconds, the error will be ± 10 % and for a pump<strong>in</strong>g timeof 3 m<strong>in</strong>utes and 20 seconds, the error will be ± 1 %.To obta<strong>in</strong> a calibration precision of approximately 95 %, the pump<strong>in</strong>g time must be longer than 1 m<strong>in</strong>uteand the depth of the water pumped, deeper than one meter.<strong>Booklet</strong> 7 - <strong>Flow</strong> <strong>Measurement</strong> <strong>Methods</strong> <strong>in</strong> <strong>Open</strong> <strong>Channels</strong> Page 197 of 223
4.4. Area/velocity methodThe method of determ<strong>in</strong><strong>in</strong>g the area and velocity of flow is perhaps the most common method of measur<strong>in</strong>gthe flowrate of a river.4.4.1. GeneralThis method of evaluat<strong>in</strong>g the flowrate of a watercourse has been <strong>in</strong> use s<strong>in</strong>ce the mid-XIX th century.4.4.2. Method pr<strong>in</strong>cipleThe method consists of accurately measur<strong>in</strong>g a cross section area and the flow velocity. Accord<strong>in</strong>g to thispr<strong>in</strong>ciple, the flowrate can be determ<strong>in</strong>ed us<strong>in</strong>g the follow<strong>in</strong>g equation:Q = AU(74 )where:QAUis the flowrate <strong>in</strong> cubic feet or meters per time unit;is the area of the cross section <strong>in</strong> square feet or meters;is the average flow velocity <strong>in</strong> feet or meters per time unit.4.4.3. Applications− measurement of the flowrate of rivers and large artificial channels;− flow measurement <strong>in</strong> an open conduit where the flow cross section is uniform;− flow measurement of large closed conduits (6) .4.4.4. AdvantagesThe pr<strong>in</strong>cipal advantages of the area and velocity method are:−−−low operat<strong>in</strong>g costs;does not require use of sophisticated <strong>in</strong>struments;results are available immediately.4.4.5. DisadvantagesThe pr<strong>in</strong>cipal disadvantages of this method are:−−−does not provide po<strong>in</strong>t-specific flow read<strong>in</strong>gs;requires a uniform discharge dur<strong>in</strong>g the entire measurement procedure;requires a uniform flow cross section, the section of the conduit must be straight and the slope must beuniform;Page 198 of 223<strong>Booklet</strong> 7 - <strong>Flow</strong> <strong>Measurement</strong> <strong>Methods</strong> <strong>in</strong> <strong>Open</strong> <strong>Channels</strong>
−−−−−requires a number of tests to be performed when the area of the section is large;requires deep enough water to ensure that <strong>in</strong>struments are completely submerged;cannot be used <strong>in</strong> conduits smaller than 203 mm (8 <strong>in</strong>ches);the presence of foul<strong>in</strong>g suspended matter and large debris h<strong>in</strong>ders operation of the measur<strong>in</strong>g<strong>in</strong>strument;requires attention to detail dur<strong>in</strong>g measurements to ensure that errors rema<strong>in</strong> at acceptable levels.4.4.6. Equipment to measure velocityThe most common equipments for measur<strong>in</strong>g velocity <strong>in</strong> clear water and <strong>in</strong> water that may conta<strong>in</strong>suspended matter are:−−hydrographic flow meters;hydrostatic probes.4.4.6.1 Hydrographic flow metersThe operat<strong>in</strong>g pr<strong>in</strong>ciple of a flow meter is based on the relationship between a liquid’s flow velocity and therotation speed of the mov<strong>in</strong>g part of the flow meter (cup or propeller). The number of revolutions made bythe propeller is recorded by a tachometer over a given period. Because different propellers can be adaptedto a flow meter and because each has a different correlation, the number of revolutions can be converted<strong>in</strong>to speed. A m<strong>in</strong>imum speed of 0.15 m/s and a maximum speed of 6 m/s is required to producerepresentative results.The horizontal shaft of the flow meter must be positioned below the water surface, at a distance equal to atleast 1.5 times the height of the rotor. The position of the rotor axis must be parallel with the direction offlow and level with the surface.A flow meter must be checked before and after use to ensure that it is operat<strong>in</strong>g correctly. The propeller orcup must be able to perform revolutions for at least four m<strong>in</strong>utes, <strong>in</strong> free air conditions and where it isprotected from w<strong>in</strong>d. If a test is <strong>in</strong>conclusive, the ball bear<strong>in</strong>gs should be checked. Instruments that do notmeet these requirements must be repaired and calibrated by the manufacturer (6) .A propeller must be selected on the basis of measurement conditions. A propeller must always be used <strong>in</strong>comb<strong>in</strong>ation with the flow meter that was used to determ<strong>in</strong>e the equation to convert the number ofrevolutions per m<strong>in</strong>ute <strong>in</strong>to speed.4.4.6.2 Hydrostatic probesThe operat<strong>in</strong>g pr<strong>in</strong>ciple of hydrostatic probes is based on the relationship between the flow velocity of aliquid and fluctuations <strong>in</strong> an electrical signal to the detection electrodes. Faraday’s law respect<strong>in</strong>g magneticflux density shows that a voltage develops <strong>in</strong> a conductor when it crosses an electrical field.A detection probe consists of an electromagnet that produces a magnetic field and two detection electrodeslocated 180° from one another. Voltage fluctuations <strong>in</strong> the detector as a liquid moves through are amplified<strong>Booklet</strong> 7 - <strong>Flow</strong> <strong>Measurement</strong> <strong>Methods</strong> <strong>in</strong> <strong>Open</strong> <strong>Channels</strong> Page 199 of 223
and converted to suction to produce a direct read<strong>in</strong>g of the flow velocity. A speed of at least 0.5 ft/s(0.15 m/s) is required to produce representative results.The horizontal shaft of the detection probe must be positioned below the water surface, at a distance of lessthan 1.5 times the height of the probe and, from the bottom, a distance that is at least equal to 3 times theheight of the probe. The shaft of the detection probe must be parallel with the direction of flow and levelwith the surface.The detection probe must be checked before and after use to ensure that it is operat<strong>in</strong>g correctly. Whenplaced <strong>in</strong> a non-metallic conta<strong>in</strong>er, the detection probe must show a speed of less than 30 mm/s (0.1 ft/s), ifit is stationary. If the probe is moved with<strong>in</strong> a conta<strong>in</strong>er, the speed of movement must be positive.Instruments that do not meet these requirements must be repaired and calibrated by the manufacturer (6) .4.4.7. Water depth measurementDur<strong>in</strong>g the entire velocity measurement procedure, water depth must be monitored us<strong>in</strong>g a pengraphdevice. The graphic record must be stored for consultation.4.4.8. Position of the measur<strong>in</strong>g po<strong>in</strong>tWhen select<strong>in</strong>g a measur<strong>in</strong>g po<strong>in</strong>t, the follow<strong>in</strong>g conditions should be verified:−−−−−−−access for personnel and equipment;a straight measur<strong>in</strong>g segment over a distance equal to at least 25 times the width of the flow;a regular shape conduit (or channel) that has no deposits on the walls;the measur<strong>in</strong>g po<strong>in</strong>t must not be located near a bend, connection or obstacle that might disrupt flow,over a distance equal to at least 25 times the width of the flow;water deep enough to allow measurement <strong>in</strong>struments to be submerged;there is no suspended matter that can <strong>in</strong>terfere with operation of measurement <strong>in</strong>struments;sections <strong>in</strong> the measurement segment where flows diverge, converge or that show backwash, contraflowsand vortexes, should be avoided.The exact location of the measur<strong>in</strong>g po<strong>in</strong>t and a complete description of its layout must be specified <strong>in</strong> thereport.Page 200 of 223<strong>Booklet</strong> 7 - <strong>Flow</strong> <strong>Measurement</strong> <strong>Methods</strong> <strong>in</strong> <strong>Open</strong> <strong>Channels</strong>
4.4.9. <strong>Flow</strong> area<strong>Measurement</strong> of the flow area requires enormous precision to m<strong>in</strong>imize the percentage of error. <strong>Flow</strong> areais determ<strong>in</strong>ed <strong>in</strong> the follow<strong>in</strong>g manner:−for a circular conduit,The <strong>in</strong>side dimension of the conduit is measured us<strong>in</strong>g an <strong>in</strong>side caliper that takesmeasurements to with<strong>in</strong> one thousandths of a meter (thousandths of a foot). The diameter ismeasured on at least three proportional angles, to ensure that the conduit is perfectly round.The number of read<strong>in</strong>gs varies accord<strong>in</strong>g to the difference between the read<strong>in</strong>gs obta<strong>in</strong>ed andthe nom<strong>in</strong>al dimension of the conduit.<strong>Flow</strong> depth <strong>in</strong> the conduit is measured from the centre of the conduit. To determ<strong>in</strong>e the centreposition of the conduit, measure the width of the flow area. The centre po<strong>in</strong>t of the flow area isthe centre of the conduit, unless the conduit is not round;−for another type of conduit or channel,the width of the flow area is determ<strong>in</strong>ed us<strong>in</strong>g a tape measure or, <strong>in</strong> the case of very widechannels, us<strong>in</strong>g an optical measur<strong>in</strong>g device. <strong>Flow</strong> depth is measured at several po<strong>in</strong>ts spacedalong the horizontal axis <strong>in</strong> the follow<strong>in</strong>g manner:−−−−for channels measur<strong>in</strong>g 4,572 mm (15 feet) and over, at <strong>in</strong>tervals equal to 5 % thetotal width of the channel;for 2,438 to 4,572 mm (8 to 15 feet) channels, at <strong>in</strong>tervals equal to 10 % of the totalwidth of the channel;for 610 to 2,438 mm (2 to 8 feet) channels, at <strong>in</strong>tervals equal to 20 % of thechannel’s total width;for channels measur<strong>in</strong>g 610 mm (2 feet) or less, at <strong>in</strong>tervals equal to 30 % of thetotal width of the channel.The profile of the section measured is pr<strong>in</strong>ted on graph paper and the area of the section ismeasured us<strong>in</strong>g a planimeter.4.4.10. Water depth measurementThis method requires a discharge that is flow<strong>in</strong>g at a steady rate dur<strong>in</strong>g the entire measurement procedure.To verify if a discharge has a steady flow, water depth measur<strong>in</strong>g equipment that produces a graphic recordmust be set up. The difference between the lowest depth read<strong>in</strong>g and highest depth read<strong>in</strong>g should be lessthan 5 %. If the difference is greater than 5 %, all measurements must be repeated (5) .<strong>Booklet</strong> 7 - <strong>Flow</strong> <strong>Measurement</strong> <strong>Methods</strong> <strong>in</strong> <strong>Open</strong> <strong>Channels</strong> Page 201 of 223
4.4.11. Velocity measurementS<strong>in</strong>ce the flow area consists of a series of currents mov<strong>in</strong>g at different speeds, velocity measurementsshould be taken at different locations to obta<strong>in</strong> an accurate profile of velocities (see Figure 26).FIGURE 26 - EXAMPLES OF HOW CURRENT VELOCITIES ARE DISTRIBUTED IN AFLOW SECTIONPage 202 of 223<strong>Booklet</strong> 7 - <strong>Flow</strong> <strong>Measurement</strong> <strong>Methods</strong> <strong>in</strong> <strong>Open</strong> <strong>Channels</strong>
Velocity measurements should be taken at the same time as a depth measurement, to ensure therepresentativeness of results.Each velocity measurement should last at least 60 seconds and should be repeated at least five times (36) .The deviation <strong>in</strong> measurements, between the lowest and highest velocity, measured dur<strong>in</strong>g all five tests atthe same po<strong>in</strong>t, must be less than 5 %. A higher rate of deviation will require all tests to be repeated aga<strong>in</strong> atthe same po<strong>in</strong>t (36) .Velocity measurements are carried out along verticals and the space between measurements should be asfollows:−−−−for channels measur<strong>in</strong>g 4,572 mm (15 feet) and over, 5 % of the total width of the channel;for 2,438 to 4,572 mm (8 to 15 feet) channels, 10 % of the total width of the channel;for 610 to 2,438 mm (2 to 8 feet) channels, 20 % of the total width of the channel;for channels 610 mm (2 feet) or less, 30 % of the channel’s total width.For depth, the measur<strong>in</strong>g po<strong>in</strong>ts are established as follows:−−−for depths less than 610 mm (2 feet), at 0.6 times the total depth measured from the surface;for depths 610 mm (2 feet) and over, at 0.2 and 0.8 times the total depth measured from the surface.This is the average for velocities measured along a vertical axis that determ<strong>in</strong>es the velocity of thissection of the flow area;if the deviation between the number of revolutions between two verticals exceeds 10 %, measurementsshould be repeated and the distance between verticals reduced.The velocity of the flow area is determ<strong>in</strong>ed by f<strong>in</strong>d<strong>in</strong>g the sum of average velocities measured alongverticals, divided by the number of verticals.4.4.12. Calculation of flow<strong>Flow</strong> is the average velocity multiplied by the flow area measured. The unit of measurement is cubic meterper second or cubic foot per second.4.4.13. PrecisionThe characteristic fluctuation, expressed as a percentage of the average velocity for a flow meter, shouldnot exceed 5 %. If all of the precautions listed above have been taken, and if measurements are conductedunder optimum conditions, the error of the method should be less than 10 %.4.4.14. Causes of errorThe pr<strong>in</strong>cipal causes of error are as follows:−−<strong>in</strong>strument handl<strong>in</strong>g, more specifically the position of the probe <strong>in</strong> relation to the direction of flow;precision of the <strong>in</strong>strument;<strong>Booklet</strong> 7 - <strong>Flow</strong> <strong>Measurement</strong> <strong>Methods</strong> <strong>in</strong> <strong>Open</strong> <strong>Channels</strong> Page 203 of 223
−−lack of precision of the flow area measurement. Particular care must be taken to locate the flow area;unstable flow conditions.5. COMPARISON OF THE PRECISION AND ACCURACY OF VOLUMETRIC, DILUTIONAND FLOW METER METHODSAn <strong>in</strong>spection of the characteristics of a channel is recommended <strong>in</strong> this booklet to determ<strong>in</strong>e the reliabilityof a flow measurement system. To confirm that a channel is operat<strong>in</strong>g correctly, many <strong>in</strong> the field choosean extraneous <strong>in</strong>spection us<strong>in</strong>g an alternative measurement, the most common of which is a flow meter.Although one or more <strong>in</strong>spection measurements are not very significant <strong>in</strong> terms of mathematics, it isimportant to acknowledge that two similar results are an <strong>in</strong>dication that re<strong>in</strong>forces a presumption that ameasur<strong>in</strong>g device is operat<strong>in</strong>g correctly. Reference is made to this type of observation frequently, whichcontributes to perpetuat<strong>in</strong>g the practice, although we have certa<strong>in</strong> reservations. A detailed statisticalexam<strong>in</strong>ation of this matter does not fall with<strong>in</strong> the realm of this booklet. What we can say essentially that aconclusion of adequate operation depends on the difference that is tolerated between both <strong>in</strong>struments. Thedifference depends on systematic errors of <strong>in</strong>struments and their respective precision.The section that follows summarizes topics discussed <strong>in</strong> the booklet and compares the pr<strong>in</strong>cipal sources oferror associated with the three test<strong>in</strong>g methods. The concepts of precision and accuracy are presented as ameans of underscor<strong>in</strong>g how the pr<strong>in</strong>cipal causes of error can lead an applied scientist to mistakenlyconclude that a measur<strong>in</strong>g device is operat<strong>in</strong>g correctly or <strong>in</strong>correctly, based on a few tests.5.1. Precision and accuracyThere are two fundamental concepts related to measurement <strong>in</strong> the scientific field: precision and accuracy.Precision refers to the proximity of a series of measurements compared to one another, without regard forthe degree of reconciliation between an average for these measurements and the true value, which<strong>in</strong>cidentally is often unknown. Distribution or deviation is therefore def<strong>in</strong>ed on the basis of randomdifferences that exist between measurements. It is obta<strong>in</strong>ed by compar<strong>in</strong>g each <strong>in</strong>dividual measurement toan observed average. In this booklet, use of the term “precision” <strong>in</strong>dicates the degree of similarity ofvalues. Deviation is additional data. Therefore 99 % precision <strong>in</strong>volves a deviation of 1 %.To reduce the number of random errors, simply repeat a measurement several times. The higher the numberof sources of deviation <strong>in</strong> the process or the greater the number of <strong>in</strong>dividual variations, the higher the risk ofobta<strong>in</strong><strong>in</strong>g a different value compared to the true value. Precision is often expressed <strong>in</strong> terms of deviation,standard deviation or variation coefficient. Statistics allow a quantitative understand<strong>in</strong>g of the reduction ofrange of variation <strong>in</strong> relation to the number of measurements. This reduction is a function of the square rootof the number of measurements.Accuracy refers to the aff<strong>in</strong>ity of one method or process to produce a result that is equal to the true result,Page 204 of 223<strong>Booklet</strong> 7 - <strong>Flow</strong> <strong>Measurement</strong> <strong>Methods</strong> <strong>in</strong> <strong>Open</strong> <strong>Channels</strong>
consider<strong>in</strong>g only the source of error that can cause a bias. For example, a one-meter ruler that is only 95 cmlong will produce results that are 5 % negatively biased or with a systematic error of -5 %.In one sense, the accuracy of a measurement method is more important than its precision, because a lack ofaccuracy is a source of bias that systematically distorts all results. A bias is more serious than a chancevariation, particularly when it cannot be estimated or, worse, observed. It leaves the experimenter with datathat are positively or negatively distorted compared to the true value. Repeat<strong>in</strong>g the measurement simplyconfirms this result.For an <strong>in</strong>strument to be deemed fit for use to verify another <strong>in</strong>strument, the precision of measurements ofthis <strong>in</strong>strument must be at least as good as the precision of the <strong>in</strong>strument to be tested. Where this is not thecase, a large number of measurements should be taken to statistically compensate for the lack of precision.Obviously, use of a method that could cause a serious bias is unacceptable.When these concepts are applied to different flow measurement techniques, the follow<strong>in</strong>g comments can bemade.5.2. Volumetric methodThe volumetric method is the most direct test<strong>in</strong>g method. The causes of deviation are based on the precisionof the volume measurement of the conta<strong>in</strong>er and the fill<strong>in</strong>g time.The only sources of bias are the volume measurement of a tank and time-keep<strong>in</strong>g, but the sources of biascan be reduced to a po<strong>in</strong>t of becom<strong>in</strong>g negligible. If the accuracy of the volume of a tank is questionable,the volume of a liquid can be figured out by weigh<strong>in</strong>g it. Random errors of time or volume measurementscan be assessed relatively easily. Natural fluctuations <strong>in</strong> flow are taken <strong>in</strong>to account by the channel and bythe <strong>in</strong>strument. Their effect on precision and accuracy depends on the time and precision of response of asecondary measur<strong>in</strong>g device and the simultaneity of operations. To accommodate natural fluctuations <strong>in</strong>flow, measurements should be taken close to one another. A correction that reflects a time delay can also beused if this condition cannot be met.If fundamental <strong>in</strong>spections have been made and if recommendations <strong>in</strong> this booklet have been followed, this<strong>in</strong>strument produces an unbiased result with a high degree of precision. In most cases, it is a reliable costeffectivemethod.5.3. Dilution methodThe large number of procedures <strong>in</strong>volved <strong>in</strong> the dilution method is a source of random variations that, when<strong>in</strong>correctly gauged or tested, can also become sources of bias. For example, the constant <strong>in</strong>jection methodoften produces the follow<strong>in</strong>g errors:−−an unstable flow of the <strong>in</strong>jection pump;absorption or reaction of the tracer with the effluent (tracer recovery <strong>in</strong>dex);<strong>Booklet</strong> 7 - <strong>Flow</strong> <strong>Measurement</strong> <strong>Methods</strong> <strong>in</strong> <strong>Open</strong> <strong>Channels</strong> Page 205 of 223
−−−<strong>in</strong>adequate mix<strong>in</strong>g of the tracer at the test po<strong>in</strong>t;the natural presence of tracer <strong>in</strong> the flow;analysis errors.A fluctuation <strong>in</strong> flowrate dur<strong>in</strong>g measurement can also be added. Theoretically, the tracer takes thisfluctuation <strong>in</strong>to account. An <strong>in</strong>crease <strong>in</strong> flowrate will be accompanied by a decrease <strong>in</strong> the concentration oftracer. However, because these changes occur also <strong>in</strong>stantaneously, the likelihood is uncerta<strong>in</strong>, s<strong>in</strong>cedispersion may not occur fast enough to reflect a correspond<strong>in</strong>g and <strong>in</strong>stantaneous adjustment <strong>in</strong>concentration. Nonetheless, when fluctuations <strong>in</strong> flowrate (variation divided by the average flow) are smalland random, that is, as positive as they are negative, this can be deemed an error where the mathematicalexpectation is zero. Under these conditions, it is a cause for error that is not readily a source of bias, so longas the variations rema<strong>in</strong> small, as <strong>in</strong>dicated <strong>in</strong> this booklet.Stability of the output capacity of the tracer <strong>in</strong>jection pump can become a cause for bias if, for example, theoutput capacity drops dur<strong>in</strong>g <strong>in</strong>jection as a measurement is be<strong>in</strong>g carried out, perhaps due to a fluctuation <strong>in</strong>pressure between the pump and tracer solution.Similar annotations apply to other causes of error. They are all controllable and measurable; but if they arenot checked, they can <strong>in</strong>troduce bias.Uniform mix<strong>in</strong>g at the test po<strong>in</strong>t is probably the cause of error that is most difficult to control. This erroralso causes a systematic under-estimation or over-estimation of flowrate, depend<strong>in</strong>g if sampl<strong>in</strong>g takes place<strong>in</strong> a zone where the concentration of tracer is respectively too high or too low.Therefore, the dilution method <strong>in</strong>volves a certa<strong>in</strong> number of causes of error that must be controlled toprevent bias from show<strong>in</strong>g up. The large number of possible sources of deviation may require a largenumber of measurements <strong>in</strong> order to obta<strong>in</strong> satisfactory precision.5.4. <strong>Flow</strong> meter methodThere are fewer procedures <strong>in</strong>volved <strong>in</strong> use of the flow meter method compared to use of the dilutionmethod, which is the likely reason it is so popular (37, 38, 39) . There are, however, a number of causes of bias.First, is the <strong>in</strong>ability to take measurements near the walls of a channel where velocity is lower, whichresults <strong>in</strong> an over-estimation of flow. This source of error takes on more importance if a channel is smalleror if the depth of liquid decl<strong>in</strong>es. It is the cause of an uncontrolled bias, but the effect decl<strong>in</strong>es as thevolume of water <strong>in</strong>creases relative to the surface of the walls exposed to the flow. Low water depth or wallsthat are close together and prevent a large number of measurements from be<strong>in</strong>g taken can cause significantbias.Page 206 of 223<strong>Booklet</strong> 7 - <strong>Flow</strong> <strong>Measurement</strong> <strong>Methods</strong> <strong>in</strong> <strong>Open</strong> <strong>Channels</strong>
There are also other causes of bias that are easier to verify, <strong>in</strong>clud<strong>in</strong>g:−−−the presence of matter that adheres to surfaces or large debris and causes a reduction of the rotationspeed;the fragility of an <strong>in</strong>strument, the calibration of which can be affected by a number of factors, such asimpacts, compression, rust, etc. The user must ma<strong>in</strong>ta<strong>in</strong> an exact calibration at all times, whichimposes some restrictions because there are very few companies that offer this type of service;the presence of a deformed flow, backwater, etc, can <strong>in</strong>troduce serious bias. This error can becontrolled if the <strong>in</strong>dividual conduct<strong>in</strong>g measurements can change the measur<strong>in</strong>g po<strong>in</strong>t. For sometypes of <strong>in</strong>struments, the angle of <strong>in</strong>sertion is another variable that requires special attention.However, use of another flow meter located on a representative spot may compensate for variations<strong>in</strong> flowrate.There are few random errors related to use of this <strong>in</strong>strument. They can be summarized as an error <strong>in</strong> theread<strong>in</strong>g of rotation speed and an error of position<strong>in</strong>g the <strong>in</strong>strument <strong>in</strong> the flow. Under uniform flowconditions, this error is negligible, but it takes on more importance if turbulence are present. The flow metermethod offers acceptable precision if favorable conditions are present.This method is affected ma<strong>in</strong>ly by errors that can cause bias. If there is not a sufficient flow of liquid, thebias may be significant and the situation may not be able to be remedied. Even if the orig<strong>in</strong> of other biasesis known, it may be difficult to determ<strong>in</strong>e their effect. Use of this <strong>in</strong>strument may also lead to confusion ifthe causes of biases are not known.A measur<strong>in</strong>g <strong>in</strong>strument must therefore be checked after an exam<strong>in</strong>ation of flow characteristics and on thebasis of a professional judgment of how each method is used.<strong>Booklet</strong> 7 - <strong>Flow</strong> <strong>Measurement</strong> <strong>Methods</strong> <strong>in</strong> <strong>Open</strong> <strong>Channels</strong> Page 207 of 223
REFERENCES1. MANNING ENVIRONMENTAL CORP., Flumes, Publication # FL-778, Mann<strong>in</strong>gEnvironmental Corp., Santa Cruz.2. UNITED STATES DEPARTMENT OF THE INTERIOR, Water <strong>Measurement</strong> Manuel,2 nd edition revised, repr<strong>in</strong>ted 1974 – repr<strong>in</strong>ted 1981, Denver, 327 p.3. BONNIN, J., Débits des liquides à l'air libre, Association française de normalisation, R-2310,R-2311, 33 p.4. GRANT, D. M., <strong>Open</strong> Channel <strong>Flow</strong> <strong>Measurement</strong> Handbook, 1 st edition, L<strong>in</strong>coln,Instrumentation Specialties Company (1979).5. AMERICAN SOCIETY FOR TESTING AND MATERIALS, Annual Book of ASTMStandard: Water and Environmental Technology Water (1), volume 11.01, Philadelphia(1987).6. COMPTON, P. R., KULIN, G., A Guide to <strong>Methods</strong> and Standards for the <strong>Measurement</strong> ofWater <strong>Flow</strong>, Wash<strong>in</strong>gton, National Bureau of Standards Special Publication 421, Institute forBasic Standards (1975), 97 p.7. GRANT, D. M., ISCO <strong>Open</strong> Channel <strong>Flow</strong> <strong>Measurement</strong> Handbook, 2 nd edition, ISCO Inc.,Environmental Division (1988).8. SKOGERBOE, G. V., HYATT, L., ENGLAND, J. D. and JOHNSON, J. R., Design andCalibration of Submerged <strong>Open</strong> Channel <strong>Flow</strong> <strong>Measurement</strong> Structures: Part 2, ParshallFlumes, PRWG 31-3, Logan, Utah Water Research Laboratory, Utah State University, 1967.9. PLASTI-FAB INC., Product Bullet<strong>in</strong> No. PB 1, LP-5M-2-80, Plasti-Fab <strong>in</strong>c., Tualat<strong>in</strong>, Oregon(1980).10. LUDWIG, J. H., LUDWIG, R. G., Design of Palmer-Bowlus Flumes, Journal Sewage andIndustrial Wastes, vol. 23, no. 9, p. 1097-1107 (September 1951).11. WELLS, E. A., Gotaas, H. B., Design of Venturi Flumes <strong>in</strong> Circular Conduits, Paper No. 2937,Transactions of ASCE, vol. 121, p. 749-775 (1956).Page 208 of 223<strong>Booklet</strong> 7 - <strong>Flow</strong> <strong>Measurement</strong> <strong>Methods</strong> <strong>in</strong> <strong>Open</strong> <strong>Channels</strong>
12. GRANT, D. M., ISCO <strong>Open</strong> Channel <strong>Flow</strong> <strong>Measurement</strong> Handbook, ISCO Inc., L<strong>in</strong>coln, NE68501,Third Edition (1989).13. F.B. LEOPOLD COMPANY INC., “Catalog No. 661”, F.B. Leopold-lagco Inc., Zelienople,Pensylvenia, 16063 (1969).14. F.B. LEOPOLD COMPANY INC., Catalog No. 652-B, F.B. Leopold-lagco Inc., Zelienople,Pensylvenia, 16063 (1974).15. MARSALEK, J., Instrumentation for field studies of urban runoff, Research report No. 42,Environmental Management Service, Canada Centre for Inland Waters, Burl<strong>in</strong>gton, Ontario(1973).16. SKOGERBOE, Gaylord V., Bennett, Ray, S. and WALKER, Wynn R., Generalized DischargeRelations for Cutthroad Flumes, Journal of the Irrigation and Dra<strong>in</strong>age Division, ASCE, Vol.98, No. IR4, p. 569-583 (Dec. 1974).17. WALKER, W. R., Skogerboe, G. V. and Bennet, R. S., <strong>Flow</strong>-measur<strong>in</strong>g flume for wastewatertreatment plants, Journal of the Water Pollution Control Federation, Vol. 45, No. 3, p. 542-550(mars 1973).18. SKOGERBOE, Gaylord V., Walker, Wynn R., Wu, Tsu-Yang and Bennet, Ray S., Slope-Discharge Rat<strong>in</strong>gs for Cutthroat Flumes, Transactions of American Society of AgriculturalEng<strong>in</strong>eers, Vol. 16, No. 1 (1973).19. SKOGERBOE, Gaylord V., Hyatt, Leon M., Rectangular Cutthroat <strong>Flow</strong> Measur<strong>in</strong>g Flumes,Journal of the Irrigation and Dra<strong>in</strong>age Division, ASCE, IR4, p. 1-13 (Dec. 1967).20. ACKERS, P., White, W. R., Perk<strong>in</strong>s, J. A., Harrison, A. M., Weirs and Flumes for <strong>Flow</strong><strong>Measurement</strong>, John Wiley & Sons Ltd. (1978).21. GWINN, W. R. and Parson, D. A., Discharge Equations for Hs, H, and HL Flumes, Journal ofthe Hydraulics Division, ASCE, Vol. 102 (jan. 1976), No. HY1, Proc. Paper 11874, p. 73-88.22. INTERNATIONAL STANDARD ORGANISATION, Water <strong>Flow</strong> <strong>Measurement</strong> <strong>in</strong> <strong>Open</strong><strong>Channels</strong> Us<strong>in</strong>g Weirs and Venturi Flumes - Part 1: Th<strong>in</strong>-Plate Weirs ,ISO StandardNo. : 1438/1, First Edition (April, 1980).23. AMERICAN SOCIETY FOR TESTING AND MATERIALS, Annual Book of ASTM,Standards Water and Environmental Technology, Part 31, Water, Philadelphia, PA. (1980).<strong>Booklet</strong> 7 - <strong>Flow</strong> <strong>Measurement</strong> <strong>Methods</strong> <strong>in</strong> <strong>Open</strong> <strong>Channels</strong> Page 209 of 223
24. KINDSVATER, C. E., Carter, R. W., Discharge Characteristics of Rectangular Th<strong>in</strong>-plateWeirs, Journal of the Hydraulic Division of the ASCE, Vol. 83, No. HY6/1453 (Dec. 1957).25. SHEN, J., Discharge Characteristics of Triangular-notch Th<strong>in</strong>-plate Weirs, U.S. Departmentof Interior, Geological Survey, Draft for I.S.O. (July 1960).26. THEL-MAR COMPANY, A Volumetric Weir for Measur<strong>in</strong>g <strong>Flow</strong>s Thru Manholes,Publication # 1-1-78, Thel-Mar Company, Lansdale, PA. 19446 (1978).27. COLLINGE, V. K. and Simpson, James R., Dilution Techniques for <strong>Flow</strong> <strong>Measurement</strong>,University of Newcastle Upon Tyne, Department of Civil Eng<strong>in</strong>eer<strong>in</strong>g (1963).28. WERRELL, W. L., Stream Gag<strong>in</strong>g by Injection of Tracer Elements, M. Sc. Thesis, ArizonaUniversity, Tuscon (1967).29. WILSON, Jr., J. F., Cobb, Ernest D. and Kilpatrick, Frederick A., Fluorometric Procedures forDye Trac<strong>in</strong>g, Chap. A12, Book 3, Revised 1986, Applications of Hydraulics, Techniques ofWater Resources Investigations of the U.S. Geological Survey (1986).30. KILPATRICK, Frederick A. and Cobb, Ernest D., <strong>Measurement</strong> of Discharge Us<strong>in</strong>g Tracers,Chap. A16, Book 3, Applications of Hydraulics, Techniques of Water Resources Investigationsof the U.S. Geological Survey (1985).31. THOMAS, Charles W. and Dexter, Robert B., Modern Equipment for Application of SaltVelocity Method of Discharge <strong>Measurement</strong> for Performance Tests, U.S. Department ofInterior, Bureau of Reclamation, Denver, Colorado.32. WILSON Jr., James F., Fluorometric Procedures for Dye Trac<strong>in</strong>g, Chap. A12, Book 3,Applications of Hydraulics, Techniques of Water Resources Investigations of the U.S.Geological Survey (1968).33. COLE, J.A., Dilution Gaug<strong>in</strong>g by Inorganic Tracers; Notably the Plateau Method, Us<strong>in</strong>gDichromates, Symposium on river flow measurements, Loughborough, 1969, LondonInstitution of Water Eng<strong>in</strong>eers, p. 111-146 (1969).34. TURNER DESIGNS, <strong>Flow</strong> <strong>Measurement</strong>s <strong>in</strong> Sanitary Sewers by Dye Dilution, FluorometricFacts, Bullet<strong>in</strong> SS 7-80, Turner Designs, Mounta<strong>in</strong> View, California.35. BELLAMY, R. J., An Evaluation of Chemical Gaug<strong>in</strong>g Techniques, New Zealand M<strong>in</strong>istry ofWorks, Water and Soil Division, Hydrological Research, Progress Report No. 6 (1971).Page 210 of 223<strong>Booklet</strong> 7 - <strong>Flow</strong> <strong>Measurement</strong> <strong>Methods</strong> <strong>in</strong> <strong>Open</strong> <strong>Channels</strong>
36. INTERNATIONAL STANDARD ORGANISATION, Liquid <strong>Flow</strong> <strong>Measurement</strong> <strong>in</strong> <strong>Open</strong><strong>Channels</strong> - Velocity-area <strong>Methods</strong> - Collection and Process<strong>in</strong>g of Data for Determ<strong>in</strong>ation ofErrors <strong>in</strong> <strong>Measurement</strong>, ISO 1088, Second Edition (1985).37. FRENCH, Richard H., <strong>Open</strong>-channel Hydraulics, McGraw-Hill Book Company, New York(1985).38. MARSH-MCBIRNEY, INC., Instruction Manual, Model 201, Portable Water Current Meter,Publication 201-676, Marsh-McBirney, Inc., Gaithersburg, Maryland, (1981).<strong>Booklet</strong> 7 - <strong>Flow</strong> <strong>Measurement</strong> <strong>Methods</strong> <strong>in</strong> <strong>Open</strong> <strong>Channels</strong> Page 211 of 223
BIBLIOGRAPHYAASTAD, Johan and Szgnen, Re<strong>in</strong>hardt, Discharge <strong>Measurement</strong>s by Means of a Salt Solution "TheRelative Dilution Method", p. 289 - 292.AGG, A. R., Mitchell, N. T. and Eden, G. E., The Use or Lithium as a Tracer for Measur<strong>in</strong>g Rates of<strong>Flow</strong> of Water or Sewage, Water Pollution Research Laboratory, Stevenage, Paper no. 2, p.240-245 (1960).ASSOCIATION GÉNÉRALE DES HYGIÉNISTES ET TECHNICIENS MUNICIPAUX. Lesstations de pompage d'eau, 3 e édition, 445 p. (1986).BARSBY, A., Determ<strong>in</strong>ation of Mix<strong>in</strong>g Lengths <strong>in</strong> Dilution Gaug<strong>in</strong>g, Symposium on Geochem,Precipitation, Evaporation, Soil-Moisture, Hydrom, Bern 1967, Int. Ass. SCI Hydrol, Pub no.78, p. 395-407 (1968).BOLCHO, C. and Fisher, T. J., Control of Industrial Wastewater Discharges <strong>in</strong> the North West ofEngland, Water Science Technology, vol. 25, no. 1, p. 53-59, IAWPCR (1992).BENNETT, R.S., Cutthroat Flume Discharge Relations, M.Sc. Thesis, Agricultural Eng<strong>in</strong>eer<strong>in</strong>gDept., Colorado State University., Fort Coll<strong>in</strong>s, Colorado (1972).BERMEL, K. J., Hydraulic Influence of Modifications to the San Dimas Critical Depth Measur<strong>in</strong>gFlume, Transaction of Geophysic Union, vol. 31, no. 5, p. 763-770 (Oct. 1950).BLUMBERG, A. F., Galper<strong>in</strong>, B. and O'Connor, D. J., Model<strong>in</strong>g Vertical Structure of <strong>Open</strong>- Channel<strong>Flow</strong>s, Journal of Hydraulic Eng<strong>in</strong>eer<strong>in</strong>g, vol. 118, no. 8, p. 1119-1134, ASCE (August 1992).BSATA, Abdalla, Instrumentation et automation des procédés <strong>in</strong>dustriels, Applications à l'<strong>in</strong>dustrie del'eau, Cégep de Sa<strong>in</strong>t-Laurent, Édition Le Griffon d'argile, Québec.CARTER, Rolland W., et Anderson, Irv<strong>in</strong>g E., Accuracy of Current Meter <strong>Measurement</strong>s, Journal ofthe Hydraulics Division, Proceed<strong>in</strong>g of the American Society of Civil Eng<strong>in</strong>eers, vol. HY 4, p.105 - 115 (Jul 1963).<strong>Booklet</strong> 7 - <strong>Flow</strong> <strong>Measurement</strong> <strong>Methods</strong> <strong>in</strong> <strong>Open</strong> <strong>Channels</strong> Page 213 of 223
CHANDRA, U., Aoki, P. E., Ramos e Silva, J. A. and Castagnet, A. C., <strong>Measurement</strong> of <strong>Flow</strong> andDirection of Ground Water by Radioactive Tracers : Hydrological Evaluation of a WasteDisposal Site at "Instituto de Pesquisas Energéticas E Nucleares (IPEN)", IPEN Pub. 28,Institut de recherches énergétiques et nucléaires, Sao Paulo, Brésil (1981).CHASE BECKER, Edith, Payne, Faith N., Selected Techniques <strong>in</strong> Water Resources Investigations,1966-67, Geological Survey Water-Supply, Paper 1892, Department of the Interior, U.S. GovernmentPr<strong>in</strong>t<strong>in</strong>g Office, Wash<strong>in</strong>gton, D.C. 20402 (1968).CHEN, C. L., Clyde, C. G., Chu, M. S. and Wei, C. Y., Calibration of Parshall Flumes with Non-Standards Entrance Transitions, Utah Water Research Laboratory, Utah State University,Logan, Utah (March 1972).CHIU, C. L., Variation of Velocity Distribution Along Nonuniform <strong>Open</strong>-Channel <strong>Flow</strong>, Journal ofHydraulic Eng<strong>in</strong>eer<strong>in</strong>g, vol. 118, no. 7, p. 989-1001, ASCE (July 1992).CHOW, Ven Te, <strong>Open</strong>-Channel Hydraulics, McGraw-Hill Book Company, New York (1959).COBB, E. D. and Bailey, J. F., <strong>Measurement</strong> of Discharge by Dye-Dilution <strong>Methods</strong>, Book 1, Chapter14 - Hydraulic <strong>Measurement</strong> and Computation, Surface Water Techniques, U. S. Departmentof the Interior Geological Survey (Aug. 1965).COLE, John A., Prediction of Mix<strong>in</strong>g Lengths for River <strong>Flow</strong> Gag<strong>in</strong>g, Proceed<strong>in</strong>gs American Societyof Civil Eng<strong>in</strong>eers, Journal Hydraulic Division, vol. 100, no. 8, p. 1167-1172 (1974).COMMISSION INTERNATIONALE DES IRRIGATIONS ET DU DRAINAGE, Dictionnairetechnique multil<strong>in</strong>gue des irrigations et du dra<strong>in</strong>age, Central Office, Chanakyapuri, NewDelhi.CROMPTON & KNOWLES CANADA LIMITED, Intracid Rhodam<strong>in</strong>e WT liquid, Fiche signalitique,Anjou, Québec (1991)CSÉPAI, L. and Kastanek, F., <strong>Flow</strong> Regulation by Automatically Controlled Overflow Weirs, WaterResources, vol. 26, no. 5, p.625-628 (1992).DEANER, David G., Effect of Chlor<strong>in</strong>e on Fluorescent Dyes, Journal of Water Pollution ControlFederation (WPCF), vol. 45, no. 3, p. 507-514 (Mar. 1973).DIPLAS, P., Hydraulic Geometry of Threshold <strong>Channels</strong>, Journal of Hydraulic Eng<strong>in</strong>eer<strong>in</strong>g, vol. 118,no. 4, ASCE, p. 597-614 (Apr. 1992).DISKIN, M. H., Temporary <strong>Flow</strong> <strong>Measurement</strong> <strong>in</strong> Sewers and Dra<strong>in</strong>s, Journal of the HydraulicDivision, ASCE Proceed<strong>in</strong>gs, vol. 89, no. HY4, p. 141-159 (Jul. 1963).Page 214 of 223<strong>Booklet</strong> 7 - <strong>Flow</strong> <strong>Measurement</strong> <strong>Methods</strong> <strong>in</strong> <strong>Open</strong> <strong>Channels</strong>
DISKIN, M. H., Sharp Crested Weirs for Circular <strong>Channels</strong>, Water and Water Eng<strong>in</strong>eer<strong>in</strong>g, vol. 75, p.309-313 (Aug. 1971).DUMAS, Henry, La méthode chimique pour la mesure du débit des cours d'eau, La Houille Blanche,no. 5, p. 690-701 (oct.-nov. 1952), no. 1, p. 51-57 (janv.- fév. 1953), no. 3, p. 360-373 (ju<strong>in</strong>juil.1953).ENGEL, P., A Universal Calibration Equation for Price Meters and Similar Instruments, ScientificSeries no. 65, Environment Canada, Inland Waters Directorate, Burl<strong>in</strong>gton, Ontario (1976).ENVIRONMENT CANADA, Sampl<strong>in</strong>g for Water Quality, Water Quality Branch, Inland WatersDirectorate, Ottawa (1983).FEUERSTEIN, Donald L. and Selleck, Robert E., Fluorescent Tracers for Dispersion <strong>Measurement</strong>s,Journal of the Sanitary Eng<strong>in</strong>eer<strong>in</strong>g Division, Proced<strong>in</strong>gs of the American Society of CivilEng<strong>in</strong>eers, vol. 89, no. SA 4 (Aug. 1963).FISHER, Hugo B., <strong>Flow</strong> <strong>Measurement</strong>s with Fluorescent Tracers, ASCE, Paper no. 1, p. 139-140(Jan. 1967).FOGLER, Scott H. and Brown, L. F., Elements of Chemical Reaction Eng<strong>in</strong>eer<strong>in</strong>g, Second Edition,Prentice Hall International Series <strong>in</strong> the Physical and Chemical Eng<strong>in</strong>eer<strong>in</strong>g Sciences, p. 708-727.FOSTER, William S., How to Determ<strong>in</strong>e Waste Water <strong>Flow</strong>, The American City and County, vol. 92,no. 3, p. 61-62 (Mar. 1977).GILMAN, K., Application of a Residence Time Model to Dilution Gaug<strong>in</strong>g, with Particular Referenceto the Problem of Chang<strong>in</strong>g Discharge, Hydrological Sciences Bullet<strong>in</strong>, vol. 20, no. 4, p. 523-537 (Dec. 1975).GOODELL, B. C., Watt, J. P. C. and Zorich, T. M., Streamflow Volumes and Hydrographs byFluorescent Dyes, Int. Un. of Forestry Res. Organizations (1967)GOTOH, Shigeru., Witl<strong>in</strong>, William G., New Signal Process<strong>in</strong>g Approach <strong>in</strong> Electromagnetic<strong>Flow</strong>meters, Yokogawa Hokush<strong>in</strong> Electric Corp., Tokyo, Japan (1982).HAGER, W.H., Design Procedure for <strong>Flow</strong> Over Side Weirs, ASCE, vol. 117, no. 1 (1991).HAGER, W.H., Divid<strong>in</strong>g <strong>Flow</strong> <strong>in</strong> <strong>Open</strong> <strong>Channels</strong>, ASCE, vol. 116, no. 3, p. 634-637 (1990).<strong>Booklet</strong> 7 - <strong>Flow</strong> <strong>Measurement</strong> <strong>Methods</strong> <strong>in</strong> <strong>Open</strong> <strong>Channels</strong> Page 215 of 223
HAMMER, Mark J., Water and Waste-Water Technology, SI Version, John Wiley & Sons Inc., NewYork.HARRIS, James P., Kacman, Stephen A., Forest, Grant and Tomcik, John, <strong>Flow</strong> Monitor<strong>in</strong>gTechniques <strong>in</strong> Sanitary Sewers, Deeds and Data, Water Pollution Control Federation,Wash<strong>in</strong>gton, D.C. (July 1974).HELMES, Tucker C., Lipsett, Michael J., Owen, Patricia A. and Sigman, Carol<strong>in</strong>e C., Health andEnvironments Aspects of Rhodam<strong>in</strong>e-Based Dyes, F<strong>in</strong>al Report, SRI Project LSC-3614, SRIInternational, Menlo Park, CA 94025 (1983).HENDERSON, F.M., <strong>Open</strong>-channel <strong>Flow</strong>, The Macmillan Co., New York (1966).HOLLEY, E. R., Dilution Method of Discharge <strong>Measurement</strong> <strong>in</strong> Pipes, National Bureau of StandardsSpecial Publication 484, Proceed<strong>in</strong>gs of the Symposium on <strong>Flow</strong> <strong>in</strong> <strong>Open</strong> <strong>Channels</strong> and ClosedConduits, Gaithersburg, MD (Feb. 1977).HORN, D.R. and DEE, N., Technical Report no. 5 of the Storm Dra<strong>in</strong>age Research Project, Dept. ofEnvironmental Eng<strong>in</strong>eer<strong>in</strong>g Science, Johns Hopk<strong>in</strong>s University (Jan. 1967).HORTON, R.E., Weir Experiments, Government Pr<strong>in</strong>t<strong>in</strong>g Office, Wash<strong>in</strong>gton, D.C. (1907).HUBER, W.C., Two-po<strong>in</strong>t Stage <strong>Measurement</strong>s for Calculation of Urban Runoff Hydrograph, A paperpresented at the 22nd Annual Specialty Conference, Hydraulics Division, ASCE, Knoxville,Tenn. (July 31-Aug.3, 1974).HYATT, M.L., Design, Calibration, and Evaluation of a Trapezoidal Measur<strong>in</strong>g Flume by ModelStudy, M.S. thesis, Civil Eng<strong>in</strong>eer<strong>in</strong>g Department, Utah State University, Logan, Utah (Mar.1965).INTERNATIONAL STANDARD ORGANIZATION, Liquid <strong>Flow</strong> <strong>Measurement</strong> <strong>in</strong> <strong>Open</strong> <strong>Channels</strong>by Weirs and Flumes - Rectangular Broad-Crested Weirs, ISO 3846, Second Edition (1989).INTERNATIONAL STANDARD ORGANIZATION, Mesure de débit des liquides dans les canauxdécouverts - canaux jaugeurs à col rectangulaire, à col trapézoïdal et à col en U, ISO 4359,première édition (1983).INTERNATIONAL STANDARDS ORGANIZATION, Mesure de débit des liquides dans les canauxdécouverts au moyen de déversoirs et de canaux jaugeurs - déversoirs à profil triangulaire,ISO 4360, deuxième édition (1984).Page 216 of 223<strong>Booklet</strong> 7 - <strong>Flow</strong> <strong>Measurement</strong> <strong>Methods</strong> <strong>in</strong> <strong>Open</strong> <strong>Channels</strong>
INTERNATIONAL STANDARDS ORGANIZATION, Mesure de débit des liquides dans les canauxdécouverts - déversoirs en V ouvert, ISO 4377, deuxième édition (1990).INTERNATIONAL STANDARDS ORGANIZATION, Mesure de débit des fluides - calcul del'erreur limite sur une mesure de débit, ISO 5168, première édition (1978).INTERNATIONAL STANDARDS ORGANIZATION, Évaluation de l'<strong>in</strong>certitude dans l'calibrationet l'utilisation des appareils de mesure du débit - partie 1 : relation d'calibration l<strong>in</strong>éaires, ISO7066-1, première édition (1989).JACOBI, J. P., Pump<strong>in</strong>g Stations as <strong>Flow</strong>meters, WPCF, Deeds and Data, p. 1-4 (July 1975).KARNEY Bryan W. and McInnis, Duncan, Efficient Calculation of Transient <strong>Flow</strong> <strong>in</strong> Simple PipeNetworks, Journal of Hydraulic Eng<strong>in</strong>eer<strong>in</strong>g, vol. 118, no. 7, p. 1014 - 1030, ASCE (Jul. 1992).KATZ, Brian G. and Fisher, Gary T., A Comparison of Selected <strong>Methods</strong> for Measur<strong>in</strong>g <strong>Flow</strong>rate <strong>in</strong> aCircular Storm Sewer, International Symposium on Urban Hydrology, Hydraulics andSediment Control, University of Kentucky, Lex<strong>in</strong>gton, Kentucky (Jul. 1983).KERN, Robert, Measur<strong>in</strong>g <strong>Flow</strong> <strong>in</strong> Pipes With Orifices and Nozzles, Journal of Chemical Eng<strong>in</strong>eer<strong>in</strong>g,p. 72 - 78 (Feb. 1975).KILPATRICK, F. A., <strong>Flow</strong> Calibration by Dye-Dilution <strong>Measurement</strong>, Journal of Civil Eng<strong>in</strong>eer,ASCE, vol. 38, no. 2, p. 74-76 (Feb. 1968).KILPATRICK, F.A., <strong>Flow</strong> <strong>Measurement</strong>s with Fluorescent Tracers, Journal of Hydraulics Division,ASCE, vol. 93, no. 4, p. 298 - 308 (Jul. 1967).KILPATRICK, F.A., Dosage Requirements for Slug Injections of Rhodam<strong>in</strong>e BA and WT Dyes,Geological Survey Professional Paper 700-B, Geological Survey Research, U.S. GovernmentPr<strong>in</strong>t<strong>in</strong>g Office, Wash<strong>in</strong>gton, DC (1970).KIRKPATRICK, George A., A Review of <strong>Flow</strong> Measur<strong>in</strong>g Devices, Proceed<strong>in</strong>gs of a ResearchConference Urban Runoff Quantity and Quality, Published by ASCE, p. 191-198, New York(1975).KNAPP, John A., Schaake, Jr., John C., Viessman, Jr., Warren and Associate Members ASCE,Measur<strong>in</strong>g Ra<strong>in</strong>fall and Runoff at Storm-water Inlets, Journal of the Hydraulics Division,Proceed<strong>in</strong>g of the American Society of Civil Eng<strong>in</strong>eers (Sep. 1963).KRIZEK, Raymond J., Mosonyl and, Emil F., Water Resources Instrumentation, Volume 1, Measur<strong>in</strong>gand Sens<strong>in</strong>g <strong>Methods</strong>, Proceed<strong>in</strong>gs of the International Sem<strong>in</strong>ar and Exposition on Water<strong>Booklet</strong> 7 - <strong>Flow</strong> <strong>Measurement</strong> <strong>Methods</strong> <strong>in</strong> <strong>Open</strong> <strong>Channels</strong> Page 217 of 223
Resources Instrumentation, June 4-6 1974, Chicago, Ill., Distributed by Ann Arbor SciencePublishers Inc., Ann Arbor, Michigan (1975).LESBROS, J., et Damez, F., La mesure des grands débits en conduits fermés, Inventaire, comparaisonet évolution des diverses techniques pour la mesure des grands débits d'eau (Instruments demesure mécaniques et non mécaniques) – 2 e partie, La technique de l'eau et de l'assa<strong>in</strong>issement,Nos 433/434 (1983).LEWIS PUBLISHERS INC., Submersible Sewage Pump<strong>in</strong>g Systems Handbook, 120 p. (1988).LI, S.G., Venkataraman, L. and Mclaughl<strong>in</strong> D., Stochastic Theory for Irregular Stream Model<strong>in</strong>g. PartI: <strong>Flow</strong> Resistance, Journal of Hydraulic Eng<strong>in</strong>eer<strong>in</strong>g, vol. 118, no. 8, p. 1079 - 1090, ASCE(Aug. 1992).LYN, D. A., Turbulence Characteristics of Sediment-Laden <strong>Flow</strong>s <strong>in</strong> <strong>Open</strong> <strong>Channels</strong>, Journal ofHydraulic Eng<strong>in</strong>eer<strong>in</strong>g, ASCE, vol. 118, no. 7, p. 971-988 (Jul. 1992).MAHESHWARI, B. L. and McMahon, T. A., Model<strong>in</strong>g Shallow Overland <strong>Flow</strong> <strong>in</strong> Surface Irrigation,Journal of Irrigation and Dra<strong>in</strong>age Eng<strong>in</strong>eer<strong>in</strong>g, vol. 118, no. 2, p. 201-217, ASCE (Mar./Apr.1992).MASON, Mart<strong>in</strong> A., Scott, Cloyd H., Culbertson, James R. and Worstell, R. V., <strong>Flow</strong> <strong>Measurement</strong>swith Fluorescent Tracers, Journal of the Hydraulics Division, ASCE, vol. 93, no. 3 (May1967).MINISTÈRE DE L'AGRICULTURE, Mesure des faibles débits d'eaux usées par auget basculeur,Centre national du mach<strong>in</strong>isme agricole du génie rural, des eaux et des forêts (CEMAGREF),Division qualité des eaux, pêche et pisciculture, Paris (1982).MORGAN, W. H., Kempf, D. and Phillips, R. E., Validation of Use of Dye-Dilution Method for <strong>Flow</strong><strong>Measurement</strong> <strong>in</strong> Large <strong>Open</strong> and Closed Channel <strong>Flow</strong>s, NBS Special Publication,Proceed<strong>in</strong>gs of the Symposium on <strong>Flow</strong> <strong>Measurement</strong> <strong>in</strong> <strong>Open</strong> <strong>Channels</strong> and Closed Conduits,Gaithersburg (Oct. 1977).MOUGENOT, G., Measur<strong>in</strong>g Sewage <strong>Flow</strong> Us<strong>in</strong>g Weirs and Flumes, Water & Sewage Works, July1974, p. 78-81.NAFFRECHOUX, N., Mazas, N. and Thomas, O., Identification rapide de la composante <strong>in</strong>dustrielled'une eau résiduaire, Laboratoire de Chimie et Ingénierie de l'Environnement, ESIGEC,Université de Savoie, France, Environmental Technology, vol. 12, p. 325-332 (Mai 1990).Page 218 of 223<strong>Booklet</strong> 7 - <strong>Flow</strong> <strong>Measurement</strong> <strong>Methods</strong> <strong>in</strong> <strong>Open</strong> <strong>Channels</strong>
NEDVED, T. K., Fochtman, E. G., Langdon, W. M. and Sullivan, F. O., Instrumentation for<strong>Measurement</strong> of Wastewater <strong>Flow</strong>, Journal of the Water Pollution Control Federation, vol. 44,no. 5, p. 820-828 (May 1955).OFFICE DES NORMES GÉNÉRALES DU CANADA, Liquid <strong>Flow</strong> <strong>Measurement</strong> <strong>in</strong> <strong>Open</strong> <strong>Channels</strong>- Establishment and Operation of a Gaug<strong>in</strong>g Station, CAN/CGSB-157.3-M91, CanadianGeneral Standards Board, Ottawa, Ontario (Jul. 1991).OFFICE DES NORMES GÉNÉRALES DU CANADA, Liquid <strong>Flow</strong> <strong>Measurement</strong> <strong>in</strong> <strong>Open</strong> <strong>Channels</strong>- Vocabulary and Symbols, CAN/CGSB-157.1-M91, Canadian General Standards Board,Ottawa, Ontario (Aug. 1991).OFFICE DES NORMES GÉNÉRALES DU CANADA, Mesure de débit des liquides dans les canauxdécouverts - partie 2 : déterm<strong>in</strong>ation de la relation hauteur-débit, CAN/CGSB-157.4-M91/ISO 1100-2 :1982, Canadian General Standards Board, Ottawa (ju<strong>in</strong> 1991).PAINE, John N., <strong>Open</strong>-Channel <strong>Flow</strong> Algorithm <strong>in</strong> Newton-Raphson Form, Journal of Irrigation andDra<strong>in</strong>age Eng<strong>in</strong>eer<strong>in</strong>g, vol. 118, no. 2, p. 306-319,ASCE (Mar./Apr. 1992).PFANNKUCH, Hans-Olaf, Elsevier's Dictionary of Hydrology, Elsevier Publish<strong>in</strong>g Company, NewYork (1969).PLASTI-FAB INC., Product Bullet<strong>in</strong> Trapezoidal Flumes no. T-1, Tualat<strong>in</strong>, Oregon 97062 (1977).PLASTI-FAB INC., Technical Bullet<strong>in</strong> no. HF-2, Tualat<strong>in</strong>, Oregon 97062 (1977).POIRIER, Guy, Desjard<strong>in</strong>s, Raymond, Brière, François et Dagenais, Danielle, Mesure en cont<strong>in</strong>u dedébits d'eaux usées à l'aide d'un traceur fluorescent, la rhodam<strong>in</strong>e WT, Sciences et techniquesde l'eau, vol. 20, no. 2, Québec (Mai 1987).POISSANT, L. and Béron, P., Design and Operation of an Automatic Sequential Ra<strong>in</strong>fall Sampler,Water Resources, vol. 26, no. 4, p. 547-551 (1992).PRATT, E. A., Another Proportional-flow Weir : Sutro Weir, Eng<strong>in</strong>eer<strong>in</strong>g News, vol. 72, no. 9, p.462-463 (Aug. 1914).RABOSKY, J. G. and Koraido, D. L., Gag<strong>in</strong>g and Sampl<strong>in</strong>g Industrial Wastewaters, ASCE (Jan,1973).REPLOGLE, John A., Meyers, Lloyd E., Asce, F. and Brust, K. J., <strong>Flow</strong> <strong>Measurement</strong>s WithFluorescent Tracers, Proceed<strong>in</strong>g ASCE, Journal of the Hydraulics Division, vol. 92, no. HY5,p. 1-15 (Sep. 1966).<strong>Booklet</strong> 7 - <strong>Flow</strong> <strong>Measurement</strong> <strong>Methods</strong> <strong>in</strong> <strong>Open</strong> <strong>Channels</strong> Page 219 of 223
REPLOGLE, John A., Meyers, Lloyd E., Asce, F. and Brust, K. J., <strong>Flow</strong> <strong>Measurement</strong>s withFluorescent Tracers, Closure, Journal of the Hydraulics Division, vol. 94, no. HY2, p. 552-555(Mar. 1968).RICHARD, Renald, Mesure de débit, M<strong>in</strong>istère de l'Environnement du Québec, Direction del'assa<strong>in</strong>issement de l'eau (Nov. 1981).ROBINSON, A. R. and Chamberla<strong>in</strong>, A .R., Trapezoidal Flumes for <strong>Open</strong>-channel <strong>Flow</strong><strong>Measurement</strong>, Transactions of The American Society of Agricultural Eng<strong>in</strong>eers, vol. 3, no. 2,p. 120-128 (1960).ROBINSON, A.R., Trapezoidal Flumes for Measur<strong>in</strong>g <strong>Flow</strong> <strong>in</strong> Irrigation <strong>Channels</strong>, ARS 41-140,Agricultural Research Service, U.S. Department of Agriculture (March 1968).SCHAEFFER, David J., Kerster, Harold W., Bauer, Darryll R., Rees, Kim and McCormick, Steve,Composite Samples Overestimate Waste Load, Journal WPCF, vol. 55, no. 11, p. 1387-1392(Nov. 1983).SCOTT, C. H., Norman, V. W.' and Fields, F. K., Reduction of Fluorescence of Two Tracer Dyes byContact with a F<strong>in</strong>e Sediment, Geological Survey Research 1969, U. S. Geological SurveyProfessional Paper 650-B, p. B164 - B168 (1969).SCOTT, R. W. W., et al., Developments <strong>in</strong> <strong>Flow</strong> <strong>Measurement</strong>, Applied Science Publishers Inc.,Englewood, New Jersey (1982).SISSON, W., Estimat<strong>in</strong>g <strong>Flow</strong>s through Parshall Flumes, Plant Eng<strong>in</strong>eer<strong>in</strong>g, vol. 120 (Oct. 1980).SKOGERBOE, Gaylord V., Hyatt, Leon M. and Eggleston, Keith O., Design and Calibration ofSubmerged <strong>Open</strong> Channel <strong>Flow</strong> <strong>Measurement</strong> Structures. Part I. Submerged <strong>Flow</strong>, ReportWG31-2, Office of Water Resources Research, U. S Department of the Interior, Utah Centrefor Water Resources Research, Utah State University, Logan, Utah (Feb. 1967).SMART, P. L. and Laidlaw, I., M., S., An Evaluation of Some Fluorescent Dyes for Water Trac<strong>in</strong>g,Water Resources Research, vol. 13, no. 1 (Feb. 1977).SMOOT, George F., Are Individual Current-Meter Rat<strong>in</strong>gs Necessary?, Journal of the HydraulicsDivision, Proceed<strong>in</strong>gs of the American Society of Civil Eng<strong>in</strong>eers (Mar. 1968).SOENKSEN, Philip J., Automatic Tracer-Dilution Method Used for Stage-Dilution Rat<strong>in</strong>gs andStream flow Hydrographs on Small Iowa Streams, Water-Resources Investigations Report89-4187, U. S. Geological Survey, Denver, Colorado (1990).Page 220 of 223<strong>Booklet</strong> 7 - <strong>Flow</strong> <strong>Measurement</strong> <strong>Methods</strong> <strong>in</strong> <strong>Open</strong> <strong>Channels</strong>
SOUCEK, E., Howe, H. E. and Mavis, F. T., Sutro Weir Investigations Furnish DischargeCoefficients, Eng<strong>in</strong>eer<strong>in</strong>g News-Record (Nov. 1936).SPENCER, E. A. and Tudhope, J. S., A Literature Survey of the Salt-Dilution Method of <strong>Flow</strong><strong>Measurement</strong>, Journal I. W. E., vol. 12, no. 2, pp 127-138 (1958).SPENCER, E. A., Tudhope, J. S. and Morris, Miss. J. I. N., <strong>Flow</strong> <strong>Measurement</strong> by the SaltDilutionMethod, National Eng<strong>in</strong>eer<strong>in</strong>g Laboratory, Fluids Report no. 68, East Killbride (1958).SPRENKLE, R. E., Pip<strong>in</strong>g Arrangements for Acceptable <strong>Flow</strong> Meter Accuracy, Transaction of theASME, vol. 67 (Jul. 1945).STANBRO, W. D. and Pyrch, D. A., Stability of Rhodam<strong>in</strong>e WT <strong>in</strong> Sal<strong>in</strong>e Waters, Water ResourcesResearch, vol. 15, no. 6 (Dec. 1979).STEINBACK, B. J., Effluent <strong>Flow</strong>meter Calibration Us<strong>in</strong>g Fluorescent Dye Tracer, Journal of Pulpand Paper Canada 88: 12 (1987).STEVENS, John C., Temporary <strong>Flow</strong> <strong>Measurement</strong>s <strong>in</strong> Sewers and Dra<strong>in</strong>s, ASCE Proceed<strong>in</strong>gs, vol.34, no. HY6 (Nov. 1964).STEVENS WATER RESOURCES PRODUCTS, Stevens Water Resources Data Book, 3rd Edition,Leupold & Stevens Inc., Beaverton, Ore., 97075 (1974).STRILAEFF, P. W., S<strong>in</strong>gle Velocity Method <strong>in</strong> Measur<strong>in</strong>g Discharge, Department of the Environment,Inland Waters Branch, Water Survey of Canada, W<strong>in</strong>nipeg, Canada (1971).TARAZI, D. S., Hiser, L. L., Childers, R. E. and Boldt, C. A., Comparison of Wastewater Sampl<strong>in</strong>gTechniques, Journal of Water Pollution Control Federation, vol. 42, no. 5, p. 708 - 732 (May1970).TCHOBANOGLOUS, George, Wastewater Eng<strong>in</strong>eer<strong>in</strong>g: Collection and Pump<strong>in</strong>g of Wastewater,Metcalf & Eddy Inc., McGraw-Hill Book Company, New York (1981).TELEDYNE GURLEY, Direct Read<strong>in</strong>g Current Meter, Instruction Book Gurley No 665, Troy, NewYork.THORSEN, T. and Oen, R., How to Measure Industrial Wastewater <strong>Flow</strong>, Journal of ChemicalEng<strong>in</strong>eer<strong>in</strong>g (Feb. 1975).<strong>Booklet</strong> 7 - <strong>Flow</strong> <strong>Measurement</strong> <strong>Methods</strong> <strong>in</strong> <strong>Open</strong> <strong>Channels</strong> Page 221 of 223
TRIESTE, Douglas J., Evaluation of Supercritical/Subcritical <strong>Flow</strong>s <strong>in</strong> High-Gradient Channel,Journal of Hydraulic Eng<strong>in</strong>eer<strong>in</strong>g, American Society of Civil Eng<strong>in</strong>eers, vol. 118, no. 8(Aug. 1992).TURNER DESIGNS, Dye Studies/Chlorophyll/Oil <strong>Measurement</strong>, Field Fluorometry, Form 10-1084-7.5M, Turner Designs, Mounta<strong>in</strong> View, California.TURNER DESIGNS, <strong>Flow</strong> <strong>Measurement</strong>s, Fluorometric Facts, Turner Designs, Mounta<strong>in</strong> View,California.U. S. ENVIRONMENTAL PROTECTION AGENCY, <strong>Flow</strong> Equalization, EPA Technology TransferSem<strong>in</strong>ar Publication, EPA 625/4-74-006 (May 1974).U.S. ENVIRONMENTAL PROTECTION AGENCY, <strong>Flow</strong> <strong>Measurement</strong> Instrumentation, DesignInformation Report, Journal WPCF, vol. 58, no. 10 (Oct. 1986).U. S. ENVIRONMENTAL PROTECTION AGENCY, Handbook for Monitor<strong>in</strong>g IndustrialWastewater, Associated Water & Air Resources Eng<strong>in</strong>eers, Environmental Protection AgencyTechnology Transfer Publication (August 1973).U.S. ENVIRONMENTAL PROTECTION AGENCY, NPDES Compliance <strong>Flow</strong> <strong>Measurement</strong>Manual, MCD-77, Office of Water Enforcement and Permits Enforcement Division,Compliance Branch, Wash<strong>in</strong>gton, D.C. (Sep. 1981).U.S. ENVIRONMENTAL PROTECTION AGENCY, NPDES Compliance Sampl<strong>in</strong>g InspectionManual, Office of Water Enforcement, Enforcement Division, Compliance Branch,Wash<strong>in</strong>gton, D.C. (1979).UNITED STATES DEPARTMEENT OF THE INTERIOR, Water <strong>Measurement</strong> Manuel, Bureau ofReclamation, Denver Colorado, Second Edition, 1967.WENZEL, Jr., H. G., A Critical Review of <strong>Methods</strong> of Measur<strong>in</strong>g Discharge With<strong>in</strong> a Sewer Pipe,ASCE, Urban Water Resources Research Program, Tech. Memo no. 4 (Sep. 1968).WILLIAMS, R. T. and Bridges, J. W., Fluorescence of Solutions: A Review, Journal of Cl<strong>in</strong>icalPathology (1964).WILSON, A.L., Precision and Bias of the Results of Dilution Gaug<strong>in</strong>gs, Symposium on HydrometrySep 1970, International Association of Hydrological Sciences Publication, no. 99, vol. 1, p.289-299 (1973).Page 222 of 223<strong>Booklet</strong> 7 - <strong>Flow</strong> <strong>Measurement</strong> <strong>Methods</strong> <strong>in</strong> <strong>Open</strong> <strong>Channels</strong>
WILSON Jr., J. F., Time-of-Travel <strong>Measurement</strong>s and Other Applications of Dye Trac<strong>in</strong>g, WaterResources Division, U.S. Geological Survey, Cheyenne, Wyom<strong>in</strong>gYOTSUKURA, Nobuhiro and Cobb, Ernest D., Transverse Diffusion of Solutes <strong>in</strong> Natural Streams,Geological Survey Professional Paper 582-C, U. S. Government Pr<strong>in</strong>t<strong>in</strong>g Office, Wash<strong>in</strong>gton,D.C. (1972).<strong>Booklet</strong> 7 - <strong>Flow</strong> <strong>Measurement</strong> <strong>Methods</strong> <strong>in</strong> <strong>Open</strong> <strong>Channels</strong> Page 223 of 223