Lake Water Quality 2006 Report - Lakefield Herald
Lake Water Quality 2006 Report - Lakefield Herald
Lake Water Quality 2006 Report - Lakefield Herald

You also want an ePaper? Increase the reach of your titles
YUMPU automatically turns print PDFs into web optimized ePapers that Google loves.
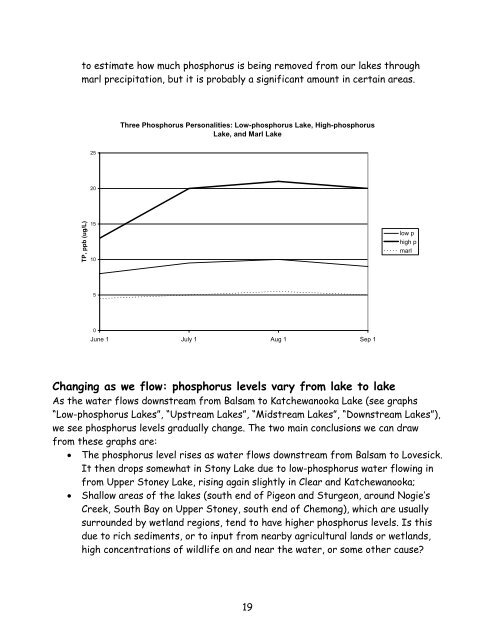
to estimate how much phosphorus is being removed from our lakes throughmarl precipitation, but it is probably a significant amount in certain areas.Three Phosphorus Personalities: Low-phosphorus <strong>Lake</strong>, High-phosphorus<strong>Lake</strong>, and Marl <strong>Lake</strong>2520TP, ppb (ug/L)1510low phigh pmarl50June 1 July 1 Aug 1 Sep 1Changing as we flow: phosphorus levels vary from lake to lakeAs the water flows downstream from Balsam to Katchewanooka <strong>Lake</strong> (see graphs“Low-phosphorus <strong>Lake</strong>s”, “Upstream <strong>Lake</strong>s”, “Midstream <strong>Lake</strong>s”, “Downstream <strong>Lake</strong>s”),we see phosphorus levels gradually change. The two main conclusions we can drawfrom these graphs are:• The phosphorus level rises as water flows downstream from Balsam to Lovesick.It then drops somewhat in Stony <strong>Lake</strong> due to low-phosphorus water flowing infrom Upper Stoney <strong>Lake</strong>, rising again slightly in Clear and Katchewanooka;• Shallow areas of the lakes (south end of Pigeon and Sturgeon, around Nogie’sCreek, South Bay on Upper Stoney, south end of Chemong), which are usuallysurrounded by wetland regions, tend to have higher phosphorus levels. Is thisdue to rich sediments, or to input from nearby agricultural lands or wetlands,high concentrations of wildlife on and near the water, or some other cause?19