MICROWAVE SPECTRAL TABLES Diatomic Molecules
MICROWAVE SPECTRAL TABLES Diatomic Molecules
MICROWAVE SPECTRAL TABLES Diatomic Molecules
You also want an ePaper? Increase the reach of your titles
YUMPU automatically turns print PDFs into web optimized ePapers that Google loves.
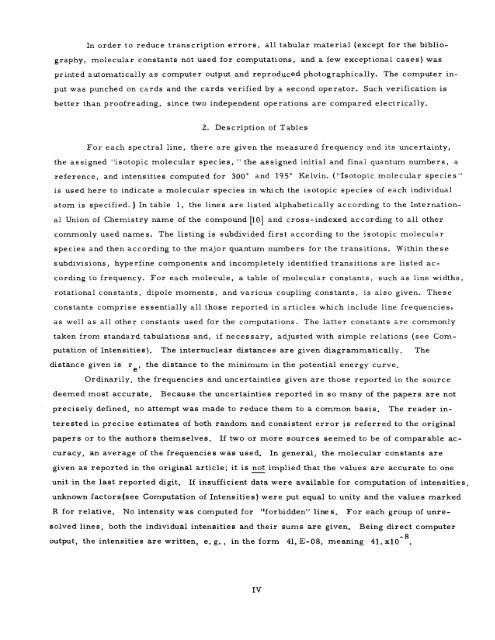
In order to reduce transcription errors, all tabular material (except for the bibliography, molecular constants not used for computations, and a few exceptional cases) wasprinted automatically as computer output and reproduced photographically. The computer input was punched on cards and the cards verified by a second operator. Such verification isbetter than proofreading, since two independent operations are compared electrically.2. Description of TablesFor each spectral line, there are given the measured frequency and its uncertainty,the assigned "isotopic molecular species, " the assigned initial and final quantum numbers, areference, and intensities computed for 300° and 195° Kelvin. ("Isotopic molecular species"is used here to indicate a molecular species in which the isotopic species of each individualatom is specified. ) In table 1, the lines are listed alphabetically according to the International Union of Chemistry name of the compound [10] and cross-indexed according to all othercommonly used names. The listing is subdivided first according to the isotopic molecularspecies and then according to the major quantum numbers for the transitions. Within thesesubdivisions, hyperfine components and incompletely identified transitions are listed according to frequency. For each molecule, a table of molecular constants, such as line widths,rotational constants, dipole moments, and various coupling constants, is also given. Theseconstants comprise essentially all those reported in articles which include line frequencies*as well as all other constants used for the computations. The latter constants are commonlytaken from standard tabulations and, if necessary, adjusted with simple relations (see Computation of Intensities). The internuclear distances are given diagrammatic ally. Thedistance given is r , the distance to the minimum in the potential energy curve.Ordinarily, the frequencies and uncertainties given are those reported in the sourcedeemed most accurate. Because the uncertainties reported in so many of the papers are notprecisely defined, no attempt was made to reduce them to a common basis. The reader interested in precise estimates of both random and consistent error is referred to the originalpapers or to the authors themselves. If two or more sources seemed to be of comparable accuracy, an average of the frequencies was used. In general, the molecular constants aregiven as reported in the original article; it is not implied that the values are accurate to oneunit in the last reported digit. If insufficient data were available for computation of intensities,unknown factors (see Computation of Intensities) were put equal to unity and the values markedR for relative. No intensity was computed for ''forbidden" lines. For each group of unresolved lines, both the individual intensities and their sums are given. Being direct computer- 8output, the intensities are written, e.g. , in the form 41. E-08, meaning 41.xlOIV


