<strong>Saudi</strong> TelecomTelecom –IndustrialSTC AB: <strong>Saudi</strong> Arabia04 December 2011US$17.71bn 16.4% US$5.61mnMarket cap Free float Avg. daily volumeTarget price 40.00 20.1% over currentConsensus price 42.37 27.2% over currentCurrent price 33.30 as at 03/12/2011Underweight Neutral OverweightOverweightKey themesWe expect mobile to outperform fixed-line telecomsin <strong>Saudi</strong> Arabia over the next few years. Growth in3.5G mobile broadband threatens the DSL marketdominated by STC. Though, STC is concentratingon the lucrative domestic market, the internationaloperations have not yielded the returns STC isaiming at.ImplicationsWe are positive on STC’s long term business and itsstrong balance sheet. With a low PE and modestdividend yield, STC is a safe investment option.PerformanceRSI10Vol thEarningsPeriod End (SAR) 12/10A 12/11E 12/12E 12/13ERevenue (mn) 51,787 55,276 58,596 61,708Revenue Growth 2.0% 6.7% 6.0% 5.3%EBITDA (mn) 19,625 20,591 21,623 23,202EBITDA Growth -4.8% 4.9% 5.0% 7.3%EPS 4.72 3.88 3.93 4.31EPS Growth -13.1% -17.8% 1.3% 9.6%Source: Company data, Al Rajhi CapitalValuation5.04.54.03.53.02.52.01.51.00.50.0413631703010 642Price Close MAV10 MAV50 Relative to SASEIDX (RHS)11/10 03/11 05/11 08/11 11/11Source: BloombergEV/Sales (x)01/08 01/09 01/10 01/111101061019793898480STCValuation attractiveResearch DepartmentMazhar Khan, Equity Research Analyst966 12119248, khanm@alrajhi-capital.comSTC reported weak Q3 results with a 53% y-o-y decline in net profit due tounexpected high foreign exchange losses (SAR780mn), reflecting that theoverseas business is susceptible to currency fluctuation. Further, domesticperformance in Q3 was below our estimates. That said, we <strong>still</strong> believe in STCslong term story and its growing focus on the domestic market. On the back ofQ3 results, we have cut our earnings forecasts for STC to incorporate thevulnerability of its business. As a result, our target price has fallen fromSAR43.6 to SAR40.0, representing 20% upside to current price levels; hence weremain Overweight. STC trades at a modest PE of 8.6x and carries a dividendyield of 6%, making it one of the attractive investments in the <strong>Saudi</strong> market.Sales growth decent; bottom-line under pressure: While STC’s results weremainly affected by exchange losses, operating performance was also belowexpectations. Although, sales grew by 5.9% y-o-y, EBITDA and operating profitdeclined by 4.0% and 7.8% respectively. Despite employee costs remained undercontrol, the access charges and higher marketing expenses dented the operatingperformance in Q3. We believe that the access charges (interconnection rates)rose due to an increase in international traffic volumes from India, Indonesiaand affiliates in other foreign markets. We expect these costs to be high in Q4 aswell due to the Hajj season. Moreover, South Asian currencies have fallen (INR -15% YTD, MYR -4% YTD, IDR -1%) against USD indicating that forex lossesmight be significant in Q4 as well.Financials strong but dividend cut dampener: At the end of Q3, STC’s netdebt/EBITDA ratio stood at 1.1x, below the level of 1.2x in Q2 2011. Balancesheet looks healthy; however, debt might increase as STC has committed toprovide a loan of US$1.2bn to its Indonesian subsidiary NTS. STC has cut itsdividend from Q1 this year and thus dividend yield fell to a modest 6%. We feelinvestors sentiments have clearly been hit by the dividend cut, which is beingreflected in the share price (-23% YTD).Overseas expansion – a mixed bag: We believe STC is engaged in excitinginitiatives in the domestic market such as Next Generation Network (NGN)which is likely to bring cost savings and high speed network in the country.Under fixed line, STC has been investing in FTTH (fibre-to-the-home) whichinvolves replacing copper line network with optical fibre. On the other hand, weremain concerned over STC’s overseas expansions, especially in countries likeIndonesia and India which are too competitive with one of the lowest ARPUlevels in the world. However, we like STC’s investments in Bahrain, Turkey andMalaysia, where growth is quite robust.Valuation: After reviewing our assumptions, we have cut our overall forecastsfor 2012 and beyond. We have also increased our WACC from 11.3% to 11.5%.This impacted our long-run valuation and so we have lowered our target pricefor STC by 8% to SAR40.0. We are positive on STC’s long term business modeland its strong balance sheet. We believe the share price has already reached itsbottom after falling by 8% since Q3 results and 23% YTD. STC trades at a low PEof 8.6x and carry a modest dividend yield of 6%, making it one of the attractiveinvestments in the market. Thus, we retain our Overweight rating.Source: Company data, Al Rajhi CapitalDisclosures Please refer to the important disclosures at the back of this report.Powered by Enhanced Datasystems’ EFA Platform 10
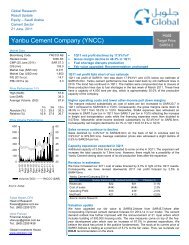
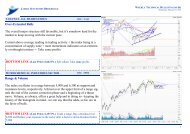
<strong>Saudi</strong> TelecomTelecom –Industrial04 December 2011Corporate summary Share information ValuationSTC is the largest telecoms operator inthe GCC region, with a market value ofUS$17.7bn. STC completely dominatesthe <strong>Saudi</strong> fixed-line telecom market andretains the highest share of the mobilemarket by revenues. STC is committedto expansion by investment abroad andacquisition, and has made majorinvestments in Turkey, Malaysia, SouthAfrica and elsewhere. Theseinvestments account for around onethirdof its value.Market cap (SAR/US$) 66.40bn / 17.71bn52-week range 33.00 - 43.60Daily avg volume (US$)5.61mnShares outstanding2,000mnFree float (est) 16.4%Performance: 1M 3M 12MAbsolute -1.8% -2.6% -17.4%Relative to index 0.2% -4.8% -13.9%Major Shareholder:Public Investment Fund 70%Gen. Organisation for Social Insce. 7%Source: Bloomberg, Al Rajhi CapitalPeriod End 12/10A 12/11E 12/12E 12/13ERevenue (SARmn) 51,787 55,276 58,596 61,708EBITDA (SARmn) 19,625 20,591 21,623 23,202Net Profit (SARmn) 9,440 7,764 7,866 8,618EPS (SAR) 4.72 3.88 3.93 4.31DPS (SAR) 3.00 2.00 2.00 2.40EPS Growth -13.1% -17.8% 1.3% 9.6%EV/EBITDA (x) 4.5 4.2 4.0 3.8P/E (x) 7.0 8.6 8.4 7.7P/B (x) 1.5 1.4 1.3 1.2Dividend Yield 9.0% 6.0% 6.0% 7.2%Source: Company data, Al Rajhi CapitalSTC: complicated businessIt is difficult to estimate STC’s overseas businessInconsistency in foreignexchange coupled with poordisclosures makes it difficult toestimate the performance ofSTCSTC continues to invest heavily overseas making its business model complex. Further, lack ofproper disclosures and vulnerability to foreign exchange fluctuations make results forecastingvery difficult. STC recently increased its stake in Axis (Indonesia) from 51% to 80%. Asinvestment in international companies’ increases, uncertainty and other costs such asdepreciation rise. In the first nine months of 2011, STC has reported foreign exchange lossesof SAR1, 083mn i.e., 20% of its accumulated profits in 2011. The company argued that it hasvery efficient hedging policies to reduce the impact of exchange rates. Although we cannotjudge to what extent these policies have offset the negative impact from exchange ratemovements over revenues and net profit, numbers clearly show the opposite.Figure 12. STC: foreign exchange gains and losses(SAR mn) 2008 2009 2010 Q111 Q211 Q311EBITDA 21,743 20,612 19,625 4814 5086 5198Oper. profit 15,335 12,814 10,981 2669 2783 3000Forex gains or losses -1,415 642 372 -355 53 -780Net profit 11,038 10,863 9,440 1573 2256 1562Source: Company data, Al Rajhi CapitalOverseas investments: mix bagIn a bid to expand its business, STC has completed a number of acquisitions in differentcountries. So far, the company has invested in excess of US$7.2bn but we haven’t seen aremarkable impact on its performance yet. We think there are two major reasons behind thislower than expected performance. Firstly, STC has invested in Greenfield companies (Kuwaitand Bahrain), which take time to gain a subscriber base. Secondly, STC has mostly investedin companies with position no.3 and below; these operators normally face stiff competitionfrom market leaders, resulting in subdued performance.Figure 13.STC: major overseas investmentsOwnership% Major marketsAmountinvested(US$ mn)Revenues(2011e;US$mn)Binariang 80.0% Malaysia, India, Indonesia 3,471 1,209Kuwaiti Telecom Company 26.0% Kuwait 900 343Oger Telecom 35.0% Turkey, South Africa 2,560 3,051Bahrain mobile licence 100.0% Bahrain 230 324Total invested 7,161 4,926Source: STC, Al Rajhi CapitalSource: Company data, Al Rajhi CapitalDisclosures Please refer to the important disclosures at the back of this report. 11