
Create successful ePaper yourself
Turn your PDF publications into a flip-book with our unique Google optimized e-Paper software.
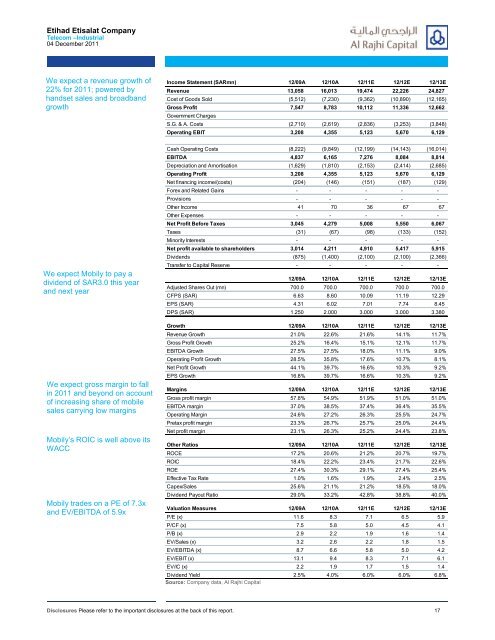
Etihad Etisalat CompanyTelecom –Industrial04 December 2011We expect a revenue growth of22% for 2011; powered byhandset sales and broadbandgrowthIncome Statement (SARmn) 12/09A 12/10A 12/11E 12/12E 12/13ERevenue 13,058 16,013 19,474 22,226 24,827Cost of Goods Sold (5,512) (7,230) (9,362) (10,890) (12,165)Gross Profit 7,547 8,783 10,112 11,336 12,662Government ChargesS.G. & A. Costs (2,710) (2,619) (2,836) (3,253) (3,848)Operating EBIT 3,208 4,355 5,123 5,670 6,129We expect <strong>Mobily</strong> to pay adividend of SAR3.0 this yearand next yearWe expect gross margin to fallin 2011 and beyond on accountof increasing share of mobilesales carrying low margins<strong>Mobily</strong>’s ROIC is well above itsWACC<strong>Mobily</strong> trades on a PE of 7.3xand EV/EBITDA of 5.9xCash Operating Costs (8,222) (9,849) (12,199) (14,143) (16,014)EBITDA 4,837 6,165 7,276 8,084 8,814Depreciation and Amortisation (1,629) (1,810) (2,153) (2,414) (2,685)Operating Profit 3,208 4,355 5,123 5,670 6,129Net financing income/(costs) (204) (146) (151) (187) (129)Forex and Related Gains - - - - -Provisions - - - - -Other Income 41 70 36 67 67Other Expenses - - - - -Net Profit Before Taxes 3,045 4,279 5,008 5,550 6,067Taxes (31) (67) (98) (133) (152)Minority Interests - - - - -Net profit available to shareholders 3,014 4,211 4,910 5,417 5,915Dividends (875) (1,400) (2,100) (2,100) (2,366)Transfer to Capital Reserve - - - - -12/09A 12/10A 12/11E 12/12E 12/13EAdjusted Shares Out (mn) 700.0 700.0 700.0 700.0 700.0CFPS (SAR) 6.63 8.60 10.09 11.19 12.29EPS (SAR) 4.31 6.02 7.01 7.74 8.45DPS (SAR) 1.250 2.000 3.000 3.000 3.380Growth 12/09A 12/10A 12/11E 12/12E 12/13ERevenue Growth 21.0% 22.6% 21.6% 14.1% 11.7%Gross Profit Growth 25.2% 16.4% 15.1% 12.1% 11.7%EBITDA Growth 27.5% 27.5% 18.0% 11.1% 9.0%Operating Profit Growth 28.5% 35.8% 17.6% 10.7% 8.1%Net Profit Growth 44.1% 39.7% 16.6% 10.3% 9.2%EPS Growth 16.8% 39.7% 16.6% 10.3% 9.2%Margins 12/09A 12/10A 12/11E 12/12E 12/13EGross profit margin 57.8% 54.9% 51.9% 51.0% 51.0%EBITDA margin 37.0% 38.5% 37.4% 36.4% 35.5%Operating Margin 24.6% 27.2% 26.3% 25.5% 24.7%Pretax profit margin 23.3% 26.7% 25.7% 25.0% 24.4%Net profit margin 23.1% 26.3% 25.2% 24.4% 23.8%Other Ratios 12/09A 12/10A 12/11E 12/12E 12/13EROCE 17.2% 20.6% 21.2% 20.7% 19.7%ROIC 18.4% 22.2% 23.4% 21.7% 22.6%ROE 27.4% 30.3% 29.1% 27.4% 25.4%Effective Tax Rate 1.0% 1.6% 1.9% 2.4% 2.5%Capex/Sales 25.6% 21.1% 21.2% 18.5% 18.0%Dividend Payout Ratio 29.0% 33.2% 42.8% 38.8% 40.0%Valuation Measures 12/09A 12/10A 12/11E 12/12E 12/13EP/E (x) 11.6 8.3 7.1 6.5 5.9P/CF (x) 7.5 5.8 5.0 4.5 4.1P/B (x) 2.9 2.2 1.9 1.6 1.4EV/Sales (x) 3.2 2.6 2.2 1.8 1.5EV/EBITDA (x) 8.7 6.6 5.8 5.0 4.2EV/EBIT (x) 13.1 9.4 8.3 7.1 6.1EV/IC (x) 2.2 1.9 1.7 1.5 1.4Dividend Yield 2.5% 4.0% 6.0% 6.0% 6.8%Source: Company data, Al Rajhi CapitalDisclosures Please refer to the important disclosures at the back of this report. 17