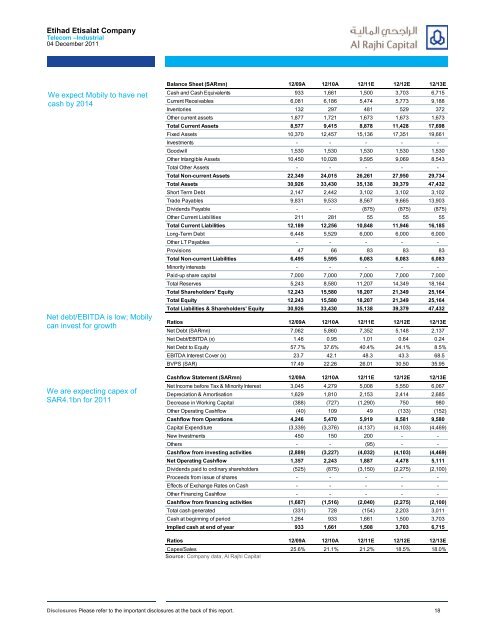
Etihad Etisalat CompanyTelecom –Industrial04 December 2011We expect <strong>Mobily</strong> to have netcash by 2014Net debt/EBITDA is low; <strong>Mobily</strong>can invest for growthWe are expecting capex ofSAR4.1bn for 2011Balance Sheet (SARmn) 12/09A 12/10A 12/11E 12/12E 12/13ECash and Cash Equivalents 933 1,661 1,500 3,703 6,715Current Receivables 6,081 6,186 5,474 5,773 9,188Inventories 132 297 481 529 372Other current assets 1,877 1,721 1,673 1,673 1,673Total Current Assets 8,577 9,415 8,878 11,428 17,698Fixed Assets 10,370 12,457 15,136 17,351 19,661Investments - - - - -Goodwill 1,530 1,530 1,530 1,530 1,530Other Intangible Assets 10,450 10,028 9,595 9,069 8,543Total Other Assets - - - - -Total Non-current Assets 22,349 24,015 26,261 27,950 29,734Total Assets 30,926 33,430 35,138 39,379 47,432Short Term Debt 2,147 2,442 3,102 3,102 3,102Trade Payables 9,831 9,533 8,567 9,665 13,903Dividends Payable - - (875) (875) (875)Other Current Liabilities 211 281 55 55 55Total Current Liabilities 12,189 12,256 10,848 11,946 16,185Long-Term Debt 6,448 5,529 6,000 6,000 6,000Other LT Payables - - - - -Provisions 47 66 83 83 83Total Non-current Liabilities 6,495 5,595 6,083 6,083 6,083Minority interests - - - - -Paid-up share capital 7,000 7,000 7,000 7,000 7,000Total Reserves 5,243 8,580 11,207 14,349 18,164Total Shareholders' Equity 12,243 15,580 18,207 21,349 25,164Total Equity 12,243 15,580 18,207 21,349 25,164Total Liabilities & Shareholders' Equity 30,926 33,430 35,138 39,379 47,432Ratios 12/09A 12/10A 12/11E 12/12E 12/13ENet Debt (SARmn) 7,062 5,860 7,352 5,148 2,137Net Debt/EBITDA (x) 1.46 0.95 1.01 0.64 0.24Net Debt to Equity 57.7% 37.6% 40.4% 24.1% 8.5%EBITDA Interest Cover (x) 23.7 42.1 48.3 43.3 68.5BVPS (SAR) 17.49 22.26 26.01 30.50 35.95Cashflow Statement (SARmn) 12/09A 12/10A 12/11E 12/12E 12/13ENet Income before Tax & Minority Interest 3,045 4,279 5,008 5,550 6,067Depreciation & Amortisation 1,629 1,810 2,153 2,414 2,685Decrease in Working Capital (388) (727) (1,290) 750 980Other Operating Cashflow (40) 109 49 (133) (152)Cashflow from Operations 4,246 5,470 5,919 8,581 9,580Capital Expenditure (3,339) (3,376) (4,137) (4,103) (4,469)New Investments 450 150 200 - -Others - - (95) - -Cashflow from investing activities (2,889) (3,227) (4,032) (4,103) (4,469)Net Operating Cashflow 1,357 2,243 1,887 4,478 5,111Dividends paid to ordinary shareholders (525) (875) (3,150) (2,275) (2,100)Proceeds from issue of shares - - - - -Effects of Exchange Rates on Cash - - - - -Other Financing Cashflow - - - - -Cashflow from financing activities (1,687) (1,516) (2,040) (2,275) (2,100)Total cash generated (331) 728 (154) 2,203 3,011Cash at beginning of period 1,264 933 1,661 1,500 3,703Implied cash at end of year 933 1,661 1,508 3,703 6,715Ratios 12/09A 12/10A 12/11E 12/12E 12/13ECapex/Sales 25.6% 21.1% 21.2% 18.5% 18.0%Source: Company data, Al Rajhi CapitalDisclosures Please refer to the important disclosures at the back of this report. 18
Zain KSATelecom –IndustrialZAINKSA AB: <strong>Saudi</strong> Arabia04 December 2011US$2.016bn 48.3% US$7.01mnMarket cap Free float Avg. daily volumeTarget price 6.00 9.2% over currentConsensus price 6.59 22.0% over currentCurrent price 5.40 as at 03/12/2011NeutralUnderweight Neutral OverweightKey themesWe expect mobile to continue to outperform fixedlinetelecom in <strong>Saudi</strong> Arabia for the next couple ofyears. Zain has been relying heavily on low incomegroups to generate revenues.ImplicationsZain is performing decent as a number 3 operator,trying to tap the growth in voice and data services.The problem for Zain is its high debt burden, whichreduces the share of enterprise value attributable toequity shareholders.PerformanceRSI10Vol thEarningsPeriod End (SAR) 12/10A 12/11E 12/12E 12/13ERevenue (mn) 5,934 6,923 8,401 9,677Revenue Growth 97.5% 16.7% 21.3% 15.2%EBITDA (mn) 331 911 1,572 2,148EBITDA Growth 175.4% 72.6% 36.7%EPS (1.68) (1.34) (0.79) (0.44)EPS Growth -23.9% -20.4% -41.0% -44.8%Source: Company data, Al Rajhi CapitalValuation2502001501005008.07.06.05.0703080 10604020Price Close MAV10 MAV50 Relative to SASEIDX (RHS)11/10 03/11 06/11 09/11Source: BloombergEV/Sales (x)01/08 01/09 01/10 01/11Source: Company data, Al Rajhi Capital110104999387817670Research DepartmentMazhar Khan, Equity Research Analyst966 12119248, khanm@alrajhi-capital.comZain KSArestructuring to decide futureZain’s results were poor for Q3 with only 8% y-o-y revenue growth and a netloss of SAR484mn. Though gross margins rose, Zain again recorded operatingand net losses in the quarter due to high interest and depreciation costs. Whilewe expect Q4 to be better keeping in mind the Hajj season, we opine that Zaindesperately needs financial restructuring in order to come out of its financialmess. Post restructuring, we estimate a 39% decline in net debt and subsequentreduction in interest costs. On the back of Q3 results, we have cut our forecastsfor Zain keeping in mind the slowdown in the voice call business (penetrationrate reaching 200%). Hence, we have reduced our target price by 15% toSAR6.0. We retain our Neutral rating.Poor revenue growth: Revenue grew only 8% y-o-y in Q3 to SAR1, 795mn, 12%below our estimate of SAR2, 038mn. We believe that this subdued performancewas due to lower than expected growth in subscriptions in Q3 and lower callvolumes. With Hajj season falling in Q4, we expect a better performance fromZain. It’s worth noting that Zain slashed its selective international call rates to20 halalas/min in a bid to boost call volumes in Q4.Decent gross profit growth but below estimates: Gross profit of SAR870mnwas up by 22% y-o-y but 20% below our expectation ofSAR1, 078mn.We believethat one of the key reasons for this below than expected performance was singledigit growth in revenues. The company earned a gross margin of 48%; 500 bpsabove the 43% earned last year. While gross profit growth was decent, SG&A anddepreciation costs surged by 14% and 52% y-o-y respectively. These high costsagain depressed operating results; operating loss of SAR222mn was higher thanour estimate of SAR111mn.Surging financial charges <strong>still</strong> weighs on net profit: Net debt in Q3 declinedmarginally to SAR15.3 from SAR15.4bn in Q2. High debt led to high interestcharges amounting to SAR262mn in Q3 at an effective interest cost of 6.6%(interest rate declined by 180bps year on year). The net debt/ EBITDA multiplestands at 18.2x with SAR20bn license fees <strong>still</strong> left to be amortized.Restructuring is critical: As per our estimates, Zain’s accumulated losses willreach 69% of the paid up capital by end of 2011, making capital restructuring atop priority. This involves cancelling 66% of paid up capital to eliminateaccumulated losses. The company will then raise capital and pay offapproximately 39% of the net debt. We expect the restructuring to go through inQ1 2012 as further losses might result in the stock being delisted. The proposedcapital reduction and subsequent capital increase look sensible, and willprobably make the company financially stronger.Valuation and conclusion: Zain’s CEO recently resigned bringing moredepressing news for the company. In our view, however, it is only restructuringwhich will decide Zain’s future. The major benefit of restructuring would belower interest costs which will provide a major boost to net profits. In line withour assumption of slowing mobile voice market and growing penetration rate,we have cut our forecast for Zain. We have also increased our WACC of Zain to12% factoring in the uncertainty surrounding its business. As a result, we haverevised our target price downwards to SAR6.0. We retain our Neutral rating.Disclosures Please refer to the important disclosures at the back of this report.Powered by Enhanced Datasystems’ EFA Platform 19