
Create successful ePaper yourself
Turn your PDF publications into a flip-book with our unique Google optimized e-Paper software.
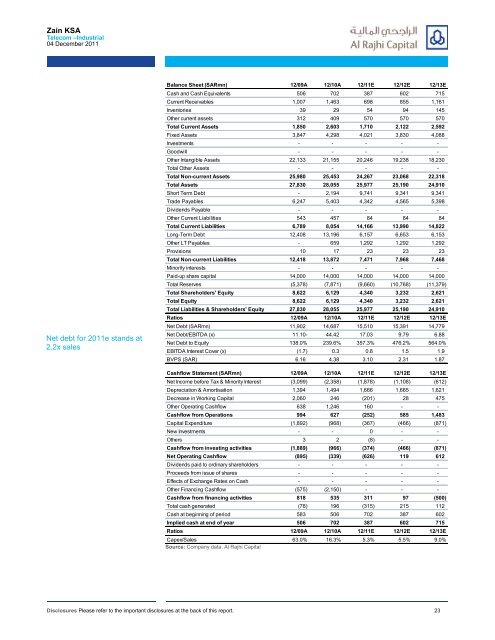
Zain KSATelecom –Industrial04 December 2011Net debt for 2011e stands at2.2x salesBalance Sheet (SARmn) 12/09A 12/10A 12/11E 12/12E 12/13ECash and Cash Equivalents 506 702 387 602 715Current Receivables 1,007 1,463 698 855 1,161Inventories 39 29 54 94 145Other current assets 312 409 570 570 570Total Current Assets 1,850 2,603 1,710 2,122 2,592Fixed Assets 3,847 4,298 4,021 3,830 4,088Investments - - - - -Goodwill - - - - -Other Intangible Assets 22,133 21,155 20,246 19,238 18,230Total Other Assets - - - - -Total Non-current Assets 25,980 25,453 24,267 23,068 22,318Total Assets 27,830 28,055 25,977 25,190 24,910Short Term Debt - 2,194 9,741 9,341 9,341Trade Payables 6,247 5,403 4,342 4,565 5,398Dividends Payable - - - - -Other Current Liabilities 543 457 84 84 84Total Current Liabilities 6,789 8,054 14,166 13,990 14,822Long-Term Debt 12,408 13,196 6,157 6,653 6,153Other LT Payables - 659 1,292 1,292 1,292Provisions 10 17 23 23 23Total Non-current Liabilities 12,418 13,872 7,471 7,968 7,468Minority interests - - - - -Paid-up share capital 14,000 14,000 14,000 14,000 14,000Total Reserves (5,378) (7,871) (9,660) (10,768) (11,379)Total Shareholders' Equity 8,622 6,129 4,340 3,232 2,621Total Equity 8,622 6,129 4,340 3,232 2,621Total Liabilities & Shareholders' Equity 27,830 28,055 25,977 25,190 24,910Ratios 12/09A 12/10A 12/11E 12/12E 12/13ENet Debt (SARmn) 11,902 14,687 15,510 15,391 14,779Net Debt/EBITDA (x) 11.10- 44.42 17.03 9.79 6.88Net Debt to Equity 138.0% 239.6% 357.3% 476.2% 564.0%EBITDA Interest Cover (x) (1.7) 0.3 0.8 1.5 1.9BVPS (SAR) 6.16 4.38 3.10 2.31 1.87Cashflow Statement (SARmn) 12/09A 12/10A 12/11E 12/12E 12/13ENet Income before Tax & Minority Interest (3,099) (2,358) (1,878) (1,108) (612)Depreciation & Amortisation 1,394 1,494 1,666 1,665 1,621Decrease in Working Capital 2,060 246 (201) 28 475Other Operating Cashflow 638 1,246 160 - -Cashflow from Operations 994 627 (252) 585 1,483Capital Expenditure (1,892) (968) (367) (466) (871)New Investments - - 0 - -Others 3 2 (8) - -Cashflow from investing activities (1,889) (966) (374) (466) (871)Net Operating Cashflow (895) (339) (626) 119 612Dividends paid to ordinary shareholders - - - - -Proceeds from issue of shares - - - - -Effects of Exchange Rates on Cash - - - - -Other Financing Cashflow (575) (2,150) - - -Cashflow from financing activities 818 535 311 97 (500)Total cash generated (78) 196 (315) 215 112Cash at beginning of period 583 506 702 387 602Implied cash at end of year 506 702 387 602 715Ratios 12/09A 12/10A 12/11E 12/12E 12/13ECapex/Sales 63.0% 16.3% 5.3% 5.5% 9.0%Source: Company data, Al Rajhi CapitalDisclosures Please refer to the important disclosures at the back of this report. 23