
Create successful ePaper yourself
Turn your PDF publications into a flip-book with our unique Google optimized e-Paper software.
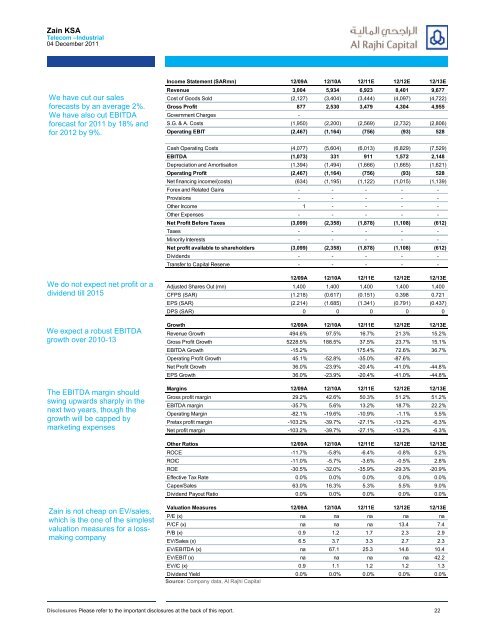
Zain KSATelecom –Industrial04 December 2011We have cut our salesforecasts by an average 2%.We have also cut EBITDAforecast for 2011 by 18% andfor 2012 by 9%.Income Statement (SARmn) 12/09A 12/10A 12/11E 12/12E 12/13ERevenue 3,004 5,934 6,923 8,401 9,677Cost of Goods Sold (2,127) (3,404) (3,444) (4,097) (4,722)Gross Profit 877 2,530 3,479 4,304 4,955Government Charges -S.G. & A. Costs (1,950) (2,200) (2,569) (2,732) (2,806)Operating EBIT (2,467) (1,164) (756) (93) 528Cash Operating Costs (4,077) (5,604) (6,013) (6,829) (7,529)EBITDA (1,073) 331 911 1,572 2,148Depreciation and Amortisation (1,394) (1,494) (1,666) (1,665) (1,621)Operating Profit (2,467) (1,164) (756) (93) 528Net financing income/(costs) (634) (1,195) (1,122) (1,015) (1,139)Forex and Related Gains - - - - -Provisions - - - - -Other Income 1 - - - -Other Expenses - - - - -Net Profit Before Taxes (3,099) (2,358) (1,878) (1,108) (612)Taxes - - - - -Minority Interests - - - - -Net profit available to shareholders (3,099) (2,358) (1,878) (1,108) (612)Dividends - - - - -Transfer to Capital Reserve - - - - -We do not expect net profit or adividend till 2015We expect a robust EBITDAgrowth over 2010-13The EBITDA margin shouldswing upwards sharply in thenext two years, though thegrowth will be capped bymarketing expenses12/09A 12/10A 12/11E 12/12E 12/13EAdjusted Shares Out (mn) 1,400 1,400 1,400 1,400 1,400CFPS (SAR) (1.218) (0.617) (0.151) 0.398 0.721EPS (SAR) (2.214) (1.685) (1.341) (0.791) (0.437)DPS (SAR) 0 0 0 0 0Growth 12/09A 12/10A 12/11E 12/12E 12/13ERevenue Growth 494.6% 97.5% 16.7% 21.3% 15.2%Gross Profit Growth 5228.5% 188.5% 37.5% 23.7% 15.1%EBITDA Growth -15.2% 175.4% 72.6% 36.7%Operating Profit Growth 45.1% -52.8% -35.0% -87.6%Net Profit Growth 36.0% -23.9% -20.4% -41.0% -44.8%EPS Growth 36.0% -23.9% -20.4% -41.0% -44.8%Margins 12/09A 12/10A 12/11E 12/12E 12/13EGross profit margin 29.2% 42.6% 50.3% 51.2% 51.2%EBITDA margin -35.7% 5.6% 13.2% 18.7% 22.2%Operating Margin -82.1% -19.6% -10.9% -1.1% 5.5%Pretax profit margin -103.2% -39.7% -27.1% -13.2% -6.3%Net profit margin -103.2% -39.7% -27.1% -13.2% -6.3%Other Ratios 12/09A 12/10A 12/11E 12/12E 12/13EROCE -11.7% -5.8% -6.4% -0.8% 5.2%ROIC -11.0% -5.7% -3.6% -0.5% 2.8%ROE -30.5% -32.0% -35.9% -29.3% -20.9%Effective Tax Rate 0.0% 0.0% 0.0% 0.0% 0.0%Capex/Sales 63.0% 16.3% 5.3% 5.5% 9.0%Dividend Payout Ratio 0.0% 0.0% 0.0% 0.0% 0.0%Zain is not cheap on EV/sales,which is the one of the simplestvaluation measures for a lossmakingcompanyValuation Measures 12/09A 12/10A 12/11E 12/12E 12/13EP/E (x) na na na na naP/CF (x) na na na 13.4 7.4P/B (x) 0.9 1.2 1.7 2.3 2.9EV/Sales (x) 6.5 3.7 3.3 2.7 2.3EV/EBITDA (x) na 67.1 25.3 14.6 10.4EV/EBIT (x) na na na na 42.2EV/IC (x) 0.9 1.1 1.2 1.2 1.3Dividend Yield 0.0% 0.0% 0.0% 0.0% 0.0%Source: Company data, Al Rajhi CapitalDisclosures Please refer to the important disclosures at the back of this report. 22