Finite Strip Modeling for Optimal Design of Folded Plate Structures
Finite Strip Modeling for Optimal Design of Folded Plate Structures
Finite Strip Modeling for Optimal Design of Folded Plate Structures

You also want an ePaper? Increase the reach of your titles
YUMPU automatically turns print PDFs into web optimized ePapers that Google loves.
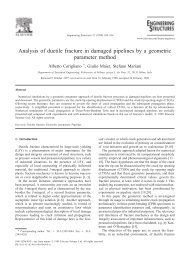
1050 A. Bergamini, F. Biondini / Engineering <strong>Structures</strong> 26 (2004) 1043–1054Fig. 7. Ro<strong>of</strong> element. (a) Main dimensions and loads. (b) <strong>Optimal</strong> thickness distributions, wings with constant thickness and (c) wings with aterminal bulb.andthe thickness distribution shown in Fig. 8(b), has atotal volume Vðx opt Þ¼0:753 m 3 =m.4.4. Bridge deck with prestressed girdersThe bridge deck shown in Fig. 9(a), with lengthL ¼ 40:0 m, width B ¼ 12:0 m andheight H ¼ 3:0 m,is considered. Besides its self-weight and the weight <strong>of</strong>the non-structural elements g p ¼ 4kN=m 2 , the structureis subjectedto the four alternative loading conditionsshown in Fig. 9(a), with q ¼ 8:0 kN=m 2 . Boththe girders are prestressed with a cable whose pr<strong>of</strong>ile isdescribed by a third degree polynomial curve. Thethickness distribution over the cross-section and thecables pr<strong>of</strong>ile which minimize both the total volumeandthe prestressing <strong>for</strong>ce (w V ¼ w P ¼ 1:0), are searched<strong>for</strong>.To this purpose, the width <strong>of</strong> the finite stripsis assumedto be variable. Moreover, two different constraints<strong>for</strong> the global de<strong>for</strong>mability index d(x) are considered,respectively with (1) d max;1 ¼ 0:75 and(2) d max;2 ¼ 0:50. The optimal thickness distributionandthe cable layout are shown <strong>for</strong> both cases (1) and(2) in Fig. 9(b) and(c), respectively. The correspondingoptimal values <strong>of</strong> the total volume and<strong>of</strong> the prestressing<strong>for</strong>ce are Vðx opt;1 Þ¼3:783 m 3 =m and Pðx opt;1 Þ¼7:079 MN <strong>for</strong> case (1), Vðx opt;2 Þ¼4:286 m 3 =m andPðx opt;2 Þ¼8:482 MN <strong>for</strong> case (2). It can be noticedthat solution (1), being associatedto a less restrictiveconstraint on the d-index, leads to lower values <strong>of</strong> volumeandprestressing with respect to solution (2).In order to better highlight the main aspects <strong>of</strong> thedesign process, Figs. 10–14 show the characteristics<strong>of</strong> the optimal solution (2) andthe correspondingevolution <strong>of</strong> the search procedure. In particular, Fig. 10shows the distribution along the longitudinal coordinatey <strong>of</strong> the maximum values attainedover all theloading conditions by the components <strong>of</strong> the behavioraldesign vectors g a (x) and g b (x), relatedto theFig. 8.Barrel vault. (a) Main dimensions and loads; (b) <strong>Optimal</strong> shape and thickness distribution.