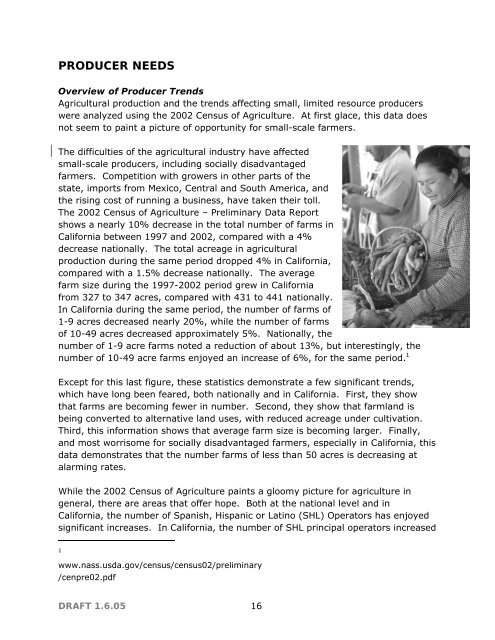
PRODUCER NEEDSOverview of Producer Trends<strong>Agricultural</strong> production and the trends affecting small, limited resource producerswere analyzed using the 2002 Census of Agriculture. At first glace, this data doesnot seem to paint a picture of opportunity <strong>for</strong> small-scale farmers.The difficulties of the agricultural industry have affectedsmall-scale producers, including socially disadvantagedfarmers. Competition with growers in other parts of thestate, imports from Mexico, Central and South America, andthe rising cost of running a business, have taken their toll.The 2002 Census of Agriculture – Preliminary Data Reportshows a nearly 10% decrease in the total number of farms inCali<strong>for</strong>nia between 1997 and 2002, compared with a 4%decrease nationally. The total acreage in agriculturalproduction during the same period dropped 4% in Cali<strong>for</strong>nia,compared with a 1.5% decrease nationally. The averagefarm size during the 1997-2002 period grew in Cali<strong>for</strong>niafrom 327 to 347 acres, compared with 431 to 441 nationally.In Cali<strong>for</strong>nia during the same period, the number of farms of1-9 acres decreased nearly 20%, while the number of farmsof 10-49 acres decreased approximately 5%. Nationally, thenumber of 1-9 acre farms noted a reduction of about 13%, but interestingly, thenumber of 10-49 acre farms enjoyed an increase of 6%, <strong>for</strong> the same period. 1Except <strong>for</strong> this last figure, these statistics demonstrate a few significant trends,which have long been feared, both nationally and in Cali<strong>for</strong>nia. First, they showthat farms are becoming fewer in number. Second, they show that farmland isbeing converted to alternative land uses, with reduced acreage under cultivation.Third, this in<strong>for</strong>mation shows that average farm size is becoming larger. Finally,and most worrisome <strong>for</strong> socially disadvantaged farmers, especially in Cali<strong>for</strong>nia, thisdata demonstrates that the number farms of less than 50 acres is decreasing atalarming rates.While the 2002 Census of Agriculture paints a gloomy picture <strong>for</strong> agriculture ingeneral, there are areas that offer hope. Both at the national level and inCali<strong>for</strong>nia, the number of Spanish, Hispanic or Latino (SHL) Operators has enjoyedsignificant increases. In Cali<strong>for</strong>nia, the number of SHL principal operators increased1www.nass.usda.gov/census/census02/preliminary/cenpre02.pdfDRAFT 1.6.05 16
45%, from 5,347 in 1997 to 7,771 in 2002. The All Operator category 2 , whichincludes up to 3 operators per farm, shows 12,083 SHL operators in 2002,representing nearly 10% of Total Operators in the state. Nationally, SHL principaloperators grew 51% <strong>for</strong> the same period, while the All Operators categoryregistered 72,329, representing only 2% of Total Operators in the country.These Census of Agriculture figures paint analarming picture of U.S. agriculture in which smallfarms (whether categorized by size or farm sales)are decreasing in numbers, yet farm operators ofSpanish, Hispanic or Latino descent, those mostlikely to operate small farms, are increasing.Compared with other demographic groups,Hispanic farmers have a higher proportion of“very small farms” (less than $10,000 FarmSales) and a high proportion of “small farms”(less than $250,000 Farm Sales). The share of high-value specialty crops producedby SHL farmers is much higher than <strong>for</strong> U.S. farms overall. Only 12% of SHLfarmers specialized in traditional commodity crops such as corn and grain. 3 Thissituation begs the question of what the future holds <strong>for</strong> small, limited resource,socially disadvantaged and beginning farmers in Cali<strong>for</strong>nia and the U.S. Are theyentering a particular sector of an industry that is only destined to continue tocontract? Will there be land available to meet their demand?As reflected in recent figures issued by the Social Sciences Institute of the NaturalResources Conservation Service, limited resource and beginning farmers, asclassified by USDA, represent a significant proportion of total farmers in the CentralCoast region of Cali<strong>for</strong>nia. In Monterey County alone, out of a total of 1,209 farms,672 (56%) are considered limited resource, having less than $100,000 in annualsales. Moreover, 390 (32%) of the total number of farms are considered beginningfarmers or ranchers, with less than 10 years experience on their present farm. InSanta Cruz County the figures are similar – out of a total of 722 farms, 507 (70%)are considered limited resource, while 222 (31%) are operated by beginningfarmers or ranchers. San Benito County, with 722 total farms, demonstratesequally significant numbers of limited resource farmers (441 or, 79%) andbeginning farmers and ranchers (185 or, 33%). 4 In an environment of budget cutsand increasing demand <strong>for</strong> the products which these farmers produce, there is a2 2002 was the first year this category existed,thus there is no comparative data.3Ibid.4 www.ssi.nrcs.usda.gov/CustomData/dataLRF.html.DRAFT 1.6.05 17
- Page 1 and 2: DRAFTURBAN EDGEAGRICULTURAL PARKSFE
- Page 3 and 4: EXECUTIVE SUMMARYOverview of AgPark
- Page 5: Farmworker Housing on the Rural/Urb
- Page 10 and 11: seeking to develop effective collab
- Page 12: INTRODUCTIONHistory of Collective F
- Page 15 and 16: Contemporary Models of Agricultural
- Page 17: accommodations, value-added product
- Page 21 and 22: information about each site include
- Page 23 and 24: undertaken. It may be best to furth
- Page 25 and 26: IDENTIFICATION OF POTENTIAL AGPARK
- Page 27 and 28: SONOMA COUNTYLaguna Farm 80-acre 3
- Page 29 and 30: The above examples reflect a range
- Page 31 and 32: MARTIAL COTTLE PARK FEASIBILITY STU
- Page 33 and 34: Median household income in the neig
- Page 35 and 36: • Relationship to surrounding nei
- Page 37 and 38: • Education/Research Center: 4-H,
- Page 39 and 40: Management and DevelopmentRole of S
- Page 41 and 42: Beyond the capital costs for the in
- Page 43 and 44: ConclusionThis property has great p
- Page 45 and 46: Ardenwood Historic Farm is the rema
- Page 47 and 48: • Establish Ardenwood as a vibran
- Page 49 and 50: These ideas complement and build on
- Page 51 and 52: • Farmer Housing: None proposed.
- Page 53 and 54: ConclusionsThis project identified
- Page 55 and 56: Appendix A: Overview of Ag Park Mod
- Page 57 and 58: The National Trust(England, Wales,N
- Page 59 and 60: Crystal Waters Village(Malaney, pop
- Page 61 and 62: McBryde AgriculturalPark (Kauai, HI
- Page 63 and 64: Farm worker Housing on Rural/Urban
- Page 65 and 66: Occidental Arts& EcologyCenter(Occi
- Page 67 and 68: The FarmSchool (Athol,MA)Privatelyo
- Page 69 and 70:
To ensure conservation in perpetuit
- Page 71 and 72:
King County FarmlandPreservation Pr
- Page 73 and 74:
development.Economics/Sources of Fu
- Page 75 and 76:
In 2001, the Trust advanced a susta
- Page 77 and 78:
LandThe cooperatives have sought la
- Page 79 and 80:
ALBA’s Farm Training andResearch
- Page 81 and 82:
• “ALBA Organics” distributio
- Page 83 and 84:
in addition to herbs, flowers, and
- Page 85 and 86:
APPENDIX C: FUNDING SOURCES FOR AGP
- Page 87 and 88:
Public Support for FarmlandPreserva
- Page 89 and 90:
transactions. Transaction types wil
- Page 91 and 92:
Affordable Rural Housing Grant andL
- Page 93 and 94:
farm" program, established farmers
- Page 95 and 96:
Appendix D: Producer Survey Instrum
- Page 97 and 98:
12. Would you be interested and wil
- Page 99 and 100:
Feasibility Study for Urban Edge Ag
- Page 101:
Site BLocationFremont, adjacent to