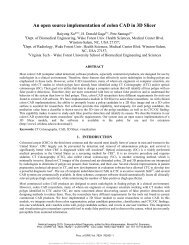
A method for planning safe trajectories in image-g... - 3D Slicer
A method for planning safe trajectories in image-g... - 3D Slicer
A method for planning safe trajectories in image-g... - 3D Slicer

Create successful ePaper yourself
Turn your PDF publications into a flip-book with our unique Google optimized e-Paper software.
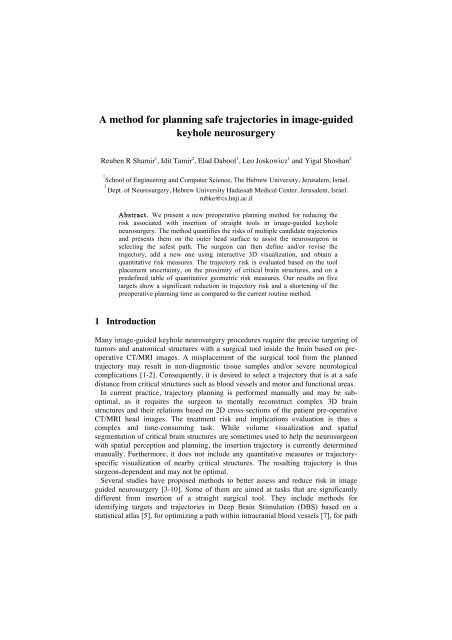
A <strong>method</strong> <strong>for</strong> <strong>plann<strong>in</strong>g</strong> <strong>safe</strong> <strong>trajectories</strong> <strong>in</strong> <strong>image</strong>-guidedkeyhole neurosurgeryReuben R Shamir 1 , Idit Tamir 2 , Elad Dabool 1 , Leo Joskowicz 1 and Yigal Shoshan 21School of Eng<strong>in</strong>eer<strong>in</strong>g and Computer Science, The Hebrew University, Jerusalem, Israel.2Dept. of Neurosurgery, Hebrew University Hadassah Medical Center, Jerusalem, Israel.rubke@cs.huji.ac.ilAbstract. We present a new preoperative <strong>plann<strong>in</strong>g</strong> <strong>method</strong> <strong>for</strong> reduc<strong>in</strong>g therisk associated with <strong>in</strong>sertion of straight tools <strong>in</strong> <strong>image</strong>-guided keyholeneurosurgery. The <strong>method</strong> quantifies the risks of multiple candidate <strong>trajectories</strong>and presents them on the outer head surface to assist the neurosurgeon <strong>in</strong>select<strong>in</strong>g the <strong>safe</strong>st path. The surgeon can then def<strong>in</strong>e and/or revise thetrajectory, add a new one us<strong>in</strong>g <strong>in</strong>teractive <strong>3D</strong> visualization, and obta<strong>in</strong> aquantitative risk measures. The trajectory risk is evaluated based on the toolplacement uncerta<strong>in</strong>ty, on the proximity of critical bra<strong>in</strong> structures, and on apredef<strong>in</strong>ed table of quantitative geometric risk measures. Our results on fivetargets show a significant reduction <strong>in</strong> trajectory risk and a shorten<strong>in</strong>g of thepreoperative <strong>plann<strong>in</strong>g</strong> time as compared to the current rout<strong>in</strong>e <strong>method</strong>.1 IntroductionMany <strong>image</strong>-guided keyhole neurosurgery procedures require the precise target<strong>in</strong>g oftumors and anatomical structures with a surgical tool <strong>in</strong>side the bra<strong>in</strong> based on preoperativeCT/MRI <strong>image</strong>s. A misplacement of the surgical tool from the plannedtrajectory may result <strong>in</strong> non-diagnostic tissue samples and/or severe neurologicalcomplications [1-2]. Consequently, it is desired to select a trajectory that is at a <strong>safe</strong>distance from critical structures such as blood vessels and motor and functional areas.In current practice, trajectory <strong>plann<strong>in</strong>g</strong> is per<strong>for</strong>med manually and may be suboptimal,as it requires the surgeon to mentally reconstruct complex <strong>3D</strong> bra<strong>in</strong>structures and their relations based on 2D cross-sections of the patient pre-operativeCT/MRI head <strong>image</strong>s. The treatment risk and implications evaluation is thus acomplex and time-consum<strong>in</strong>g task. While volume visualization and spatialsegmentation of critical bra<strong>in</strong> structures are sometimes used to help the neurosurgeonwith spatial perception and <strong>plann<strong>in</strong>g</strong>, the <strong>in</strong>sertion trajectory is currently determ<strong>in</strong>edmanually. Furthermore, it does not <strong>in</strong>clude any quantitative measures or trajectoryspecificvisualization of nearby critical structures. The result<strong>in</strong>g trajectory is thussurgeon-dependent and may not be optimal.Several studies have proposed <strong>method</strong>s to better assess and reduce risk <strong>in</strong> <strong>image</strong>guided neurosurgery [3-10]. Some of them are aimed at tasks that are significantlydifferent from <strong>in</strong>sertion of a straight surgical tool. They <strong>in</strong>clude <strong>method</strong>s <strong>for</strong>identify<strong>in</strong>g targets and <strong>trajectories</strong> <strong>in</strong> Deep Bra<strong>in</strong> Stimulation (DBS) based on astatistical atlas [5], <strong>for</strong> optimiz<strong>in</strong>g a path with<strong>in</strong> <strong>in</strong>tracranial blood vessels [7], <strong>for</strong> path
2optimization <strong>for</strong> optimal tumor evacuation [8], and <strong>for</strong> <strong>plann<strong>in</strong>g</strong> of non-straight<strong>trajectories</strong> with non-<strong>in</strong>teractive, time-consum<strong>in</strong>g optimization <strong>method</strong>s [4].In recent work, Lee et al. [9] propose a <strong>method</strong> to fuses patient MRI head <strong>image</strong>swith a registered atlas to support the manual selection of a trajectory with avisualization of the <strong>3D</strong> atlas structures. Its ma<strong>in</strong> disadvantage is that the trajectory isselected manually without any quantitative <strong>in</strong><strong>for</strong>mation regard<strong>in</strong>g nearby criticalstructures. Vaillant et al. [10] computes the risk of a candidate trajectory with aweighted sum and based on the trajectory <strong>in</strong>tersected <strong>in</strong>tracranial structures and theirassociated importance. The weakness of this <strong>method</strong> is that it does not consider thedistance of a structure from the trajectory; thus, the damage that can be caused bysurgical tool misplacement is not <strong>in</strong>corporated <strong>in</strong> the function. Tirelli et al. [3] assigneach candidate trajectory with a risk value that is based on a weighted sum; thedrawbacks are that no risk visualization or quantitative feedback is provided.Brunenberg et al. [6] show that comput<strong>in</strong>g the risk with a weighted sum can bemislead<strong>in</strong>g and suggest comput<strong>in</strong>g the maximum risk value <strong>in</strong>stead. The Euclideandistance of the trajectory from critical bra<strong>in</strong> structures is used to compute the risk ofeach voxel. Their <strong>method</strong> outputs tens to hundreds of <strong>trajectories</strong> associated withdistances above a predef<strong>in</strong>ed threshold. Although the <strong>method</strong> significantly reduces thenumber of possible <strong>trajectories</strong>, it still leaves a considerable amount of manual workwithout quantitative feedback. Moreover, none of the studies evaluated theircontribution to the actual reduction of the risk.We present a novel preoperative straight trajectory <strong>plann<strong>in</strong>g</strong> <strong>method</strong> <strong>for</strong> <strong>image</strong>guidedkeyhole neurosurgery. Our <strong>method</strong> quantifies the risks of multiple candidate<strong>trajectories</strong> and presents them on the outer head surface to assist the neurosurgeon <strong>in</strong>select<strong>in</strong>g the <strong>safe</strong>st path. For visualization, we color-code all the <strong>trajectories</strong> accord<strong>in</strong>gto their associated risk level and present them all at once on the relevant parts of theouter head surface. The surgeon can then select and revise the trajectory, and add oredit <strong>trajectories</strong> with visual <strong>3D</strong> feedback and updated risk <strong>in</strong><strong>for</strong>mation. Our <strong>method</strong><strong>in</strong>corporates <strong>in</strong>teractive <strong>3D</strong> visualization of critical structures and of surgical toolplacement uncerta<strong>in</strong>ty. The computed trajectory is presented to the physician alongwith a ‘risk card’ that <strong>in</strong>cludes quantitative risk measures such as the length of thetrajectory and distance between the trajectory and closest blood vessels. We observethat report<strong>in</strong>g only the maximum risk value may be partial and <strong>in</strong>complete andcompute both: the maximum and the summation of risks along trajectory. Moreover,we conduct a cl<strong>in</strong>ical comparative study on MRI head <strong>image</strong>s to rate our <strong>method</strong> vs.rout<strong>in</strong>e <strong>plann<strong>in</strong>g</strong> on five targets.2 Method overviewWe propose the follow<strong>in</strong>g eight-step preoperative <strong>plann<strong>in</strong>g</strong> workflow <strong>for</strong> <strong>image</strong>guided keyhole neurosurgery (Fig. 1). Initially, (1) the neurosurgeon selects the targetlocation on the CT/MRI preoperative <strong>image</strong>. Then, (2) the head outer surface iscomputed automatically and the neurosurgeon def<strong>in</strong>es (3) the surface region on whichthe entry po<strong>in</strong>t should be located. Afterwards, (4, 5) the anatomical structures
31Targetdef<strong>in</strong>itionMRI2Head surfaceextraction4Blood vesselssegmentation5Ventriclessegmentation3Entry po<strong>in</strong>tssurfacedef<strong>in</strong>ition6Risk volumecomputation78TrajectoriesriskcomputationandvisualizationTrajectoryselectionFig. 1. Preoperative <strong>plann<strong>in</strong>g</strong> workflow <strong>for</strong> <strong>image</strong> guided keyhole neurosurgery.of <strong>in</strong>terest <strong>for</strong> the surgery, e.g. blood vessels and ventricles, are segmented andassigned a risk value based on the potential damage of penetrat<strong>in</strong>g them with asurgical tool (this is done once <strong>for</strong> all patients). The <strong>in</strong>put segmentations and theassigned risk values are automatically comb<strong>in</strong>ed <strong>in</strong>to a s<strong>in</strong>gle volume (6), called therisk volume, <strong>in</strong> which voxel <strong>in</strong>tensity is associated with a value represent<strong>in</strong>g the levelof damage that may be caused by a surgical tool pass<strong>in</strong>g through it. A trajectory riskvalue is then computed (7) <strong>for</strong> each trajectory automatically and the candidate<strong>trajectories</strong> risks are color-coded and superimposed on the def<strong>in</strong>ed entry po<strong>in</strong>tssurface to <strong>for</strong>m risk maps (Fig. 2). F<strong>in</strong>ally, (8) the neurosurgeon <strong>in</strong>teractively selectsand ref<strong>in</strong>es a trajectory with visual and quantitative feedback (Figs. 2 and 3).We def<strong>in</strong>e a risk card as a summary of geometrical parameters regard<strong>in</strong>g criticalstructures and planned <strong>trajectories</strong>. The risk card provides the neurosurgeon withvaluable <strong>in</strong><strong>for</strong>mation regard<strong>in</strong>g the assessment of an <strong>in</strong>tervention’s risk and enablesthe direct quantitative comparison between candidate <strong>trajectories</strong>. The relevant riskparameters were identified by a senior neurosurgeon. They <strong>in</strong>clude measures <strong>for</strong>assess<strong>in</strong>g trajectory’s risk such as trajectory length, and distances of trajectory, targetand entry to closest blood vessels and ventricles.We use graphical illustrations to assist the surgeon <strong>in</strong> understand<strong>in</strong>g the geometricalmean<strong>in</strong>g of the measures. For example, when the neurosurgeon po<strong>in</strong>ts with the cursoron the risk card trajectory length column, it is illustrated graphically (Fig. 3).Trajectories can be added and modified based on the <strong>3D</strong> visualization of theirlocalization uncerta<strong>in</strong>ty and predef<strong>in</strong>ed critical structures. The visualization of toollocalization uncerta<strong>in</strong>ty eases the identification of cases where a planned l<strong>in</strong>etrajectory does not cross a critical structure, <strong>in</strong>clud<strong>in</strong>g the placement uncerta<strong>in</strong>ty, and<strong>in</strong>dicates the possible damage to critical structures.We describe next our <strong>method</strong> <strong>for</strong> the computation of the risk volume, the trajectoryrisk, and the visualization of multiple <strong>trajectories</strong> risks.
4(a) Maximum(b) SummationFig. 2. Risk maps of candidate <strong>trajectories</strong> with two computation <strong>method</strong>s: (a) maximum, and;(b) summation of voxels <strong>in</strong> the risk volume that are <strong>in</strong>tersected by the trajectory. Red zones areassociated with high-risk <strong>trajectories</strong>. Green and yellow zones <strong>in</strong>dicate <strong>safe</strong>r entry po<strong>in</strong>ts.2.1 Computation of risk volumeEach voxel <strong>in</strong> the risk volume is assigned with the estimated cost <strong>in</strong>curred bypenetrat<strong>in</strong>g the correspond<strong>in</strong>g region with a surgical tool. The risk volume isgenerated based on two key guidel<strong>in</strong>es: 1) the risk value is directly related to theestimated consequences and severity of the damage to the correspond<strong>in</strong>g bra<strong>in</strong> tissueor organ, severe complications and high morbidity regions are assigned with a higherrisk values than tissues with m<strong>in</strong>or and reversible complications, and; 2) voxels nearcritical structures are assigned with high risk values to reflect the <strong>in</strong>tr<strong>in</strong>sic localizationerror of the procedure, be it freehand, frame-based stereotaxy, or with an <strong>image</strong>guidedsurgery system. There<strong>for</strong>e, voxels that are closer to a critical structure areassociated with a higher risk value than those that reside further from them.The <strong>in</strong>put is a set of critical structures <strong>for</strong> which <strong>in</strong>sertion of a surgical tool is<strong>for</strong>bidden or undesired, S = { S1, S2, K , S p}, and their associated risk valuesR r1 r2r p= { , , K , }. The structure S i is a segmented <strong>image</strong>. The risk value r i is a nonnegativescalar. We def<strong>in</strong>e each voxel <strong>in</strong> the risk volume as:riskVolume( x )⎧ r ⎫k= max ⎨⎬⎩ dist ( x,Sk) + α ⎭k(1)where x is the voxel center location and α is a non-negative scal<strong>in</strong>g constant. Eq. 1assigns to each voxel the maximal expected risk computed with the above costfunction and with respect to the <strong>in</strong>put structures and risk values. For α = 1 anddist x,S = (e.g. voxel is located on the structure) the voxel value is thedistance ( ) 0ksame as the <strong>in</strong>put risk value r k . It decreases as the voxel is further from the structure.
5Fig. 3. Trajectory risk card show<strong>in</strong>g seven parameters (all values <strong>in</strong> mm) and <strong>3D</strong> illustration<strong>image</strong> of the “path length” risk parameter.In practice, we expect the neurosurgeon to def<strong>in</strong>e only a handful of risk levels, i.e.,risk values R = { r1, r2, K , r p} are selected from a small group of numbersri∈{ 0,1,2,..., c}. In cases where two or more structures are associated with the samerisk level, the voxel risk value is associated with the closest structure distance (Eq. 1).This allows comput<strong>in</strong>g one distance map <strong>for</strong> multiple structures that are associatedwith same risk level. With this approach, few distance maps can cover a large set ofsegmented structures.2.2 Trajectory risk computation and visualizationWe assign to a given trajectory two risk values: 1) the maximal value, and 2) the sumof voxels <strong>in</strong> the risk volume that are <strong>in</strong>tersected by the trajectory. The <strong>in</strong>put is a targetlocation, t, a set of candidate entry po<strong>in</strong>ts { e , e , K , e }1 2 n, and the risk volumeriskVolume. Each target and candidate entry po<strong>in</strong>t pair def<strong>in</strong>es a trajectory tr [ e ; t]The maximal trajectory risk is:{ }( , ) max ( x)max ix∩tr ii= .risk tr riskVolume = riskVolume≠∅(2)Note that this def<strong>in</strong>ition of trajectory risk does not <strong>in</strong>corporate some important riskfactors such as path length and thus provides only partial <strong>in</strong><strong>for</strong>mation regard<strong>in</strong>g thetrajectory risks. For example, this def<strong>in</strong>ition cannot differentiate between cases wheremany blood vessels surround the trajectory and those where only one blood vessel iswith<strong>in</strong> its proximity. There<strong>for</strong>e, it is also desired to compute the sum of the voxelsrisk values along the trajectory. This measure better reflects path length, andi
6<strong>in</strong>corporates all risks occur along the path. Note that this measure is also <strong>in</strong>completeand should be considered with the maximal risk [6].( , ) ( )= ∑ (3)risksumtririskVolume riskVolume xx∩tr i ≠∅To assist the neurosurgeon <strong>in</strong> select<strong>in</strong>g the <strong>safe</strong>st paths, we propose a visualization ofthe relevant candidate entry-po<strong>in</strong>ts zones on the outer head surface. Each candidateentry po<strong>in</strong>t on the relevant outer head surface zone is colored with respect to the riskvalue that was computed on its trajectory (Fig. 2). The user can change the riskcomputation <strong>method</strong> (Eqs. 2 or 3), the color-map, and can change the position andorientation of the <strong>3D</strong> surface.3 Experimental resultsWe compared our <strong>method</strong> to the current rout<strong>in</strong>e manual approach <strong>for</strong> trajectory<strong>plann<strong>in</strong>g</strong> on five targets selected at various locations on four cl<strong>in</strong>ical MRI head<strong>image</strong>s. The <strong>image</strong>s are 512×512×122 voxels 3 with voxel size of 0.47×0.47×1.0 mm 3 .For each target, a specialist neurosurgeon selected two <strong>trajectories</strong>: one with theconventional <strong>method</strong> based on the axial, sagittal, and coronal 2D views of the orig<strong>in</strong>alMRI <strong>image</strong>s, and the second trajectory was selected with our <strong>method</strong>. The <strong>plann<strong>in</strong>g</strong>protocol was as <strong>in</strong> Fig 1. A target was <strong>in</strong>itially def<strong>in</strong>ed on the MRI <strong>image</strong>. Then, theouter surface of the head was automatically segmented and extracted [12], andsampled with ~40K po<strong>in</strong>ts. For each target, the user def<strong>in</strong>ed surface areas on the outerhead surface from which the entry po<strong>in</strong>t can be chosen. Each candidate entry po<strong>in</strong>tdef<strong>in</strong>es a candidate trajectory with the predef<strong>in</strong>ed target. The blood vessels andventricles were semi-automatically segmented and their surfaces were reconstructed.Distance maps are computed with the <strong>method</strong> of Danielsson et al. [11]. The bloodvessels were associated with a risk level of r 1 = 255 and the ventricles wereassociated with a risk level of r 2 = 100. The risk volume was computed us<strong>in</strong>g Eq. 1with r 1 and r 2 as above andα = 1.For each possible trajectory, the risk volume voxels that were <strong>in</strong>tersected by thetrajectory were identified, and the trajectory risk was computed us<strong>in</strong>g Eq. 2 and 3.Next, the <strong>trajectories</strong> risks were color-coded and superimposed on the relevant part ofthe head surface. The neurosurgeon then <strong>in</strong>teractively selected an entry po<strong>in</strong>t. Thecorrespond<strong>in</strong>g risk card was automatically computed and a <strong>3D</strong> visualization of thelocalization uncerta<strong>in</strong>ty and blood vessels was generated and displayed <strong>for</strong> furtherref<strong>in</strong>ement. The <strong>method</strong> was implemented with the Visualization ToolKit (VTK) [13]and the Insight segmentation and registration ToolKit (ITK) [14] and was <strong>in</strong>tegratedas a set of modules <strong>in</strong> <strong>Slicer</strong> [15] on a standard PC runn<strong>in</strong>g W<strong>in</strong>dows XP OS.
7TargetnumberTargetlocationMethodTrajectorylength(mm)Distance:Trajectory toBloodVessels(mm)Distance:Trajectory toVentricles(mm)Time(m<strong>in</strong>)1 LF Rout<strong>in</strong>e 35.2 5.15 9.99 -Proposed 31.6 9.39 9.52 -2 LFTI Rout<strong>in</strong>e 27.0 1.88 37.8 19Proposed 40.5 3.58 37.1 63 RPO Rout<strong>in</strong>e 25.6 12.0 26.3 9Proposed 29.1 12.0 26.3 94 LFP Rout<strong>in</strong>e 56.2 7.16 12.0 9Proposed 57.8 7.99 13.1 65 MP Rout<strong>in</strong>e 94.4 0.0 2.74 6Proposed 96.3 1.0 4.9 10Average Rout<strong>in</strong>e 47.7 5.2 17.8 10.8Proposed 51.0 6.8 18.1 7.7Table 1. Comparison of the proposed and rout<strong>in</strong>e <strong>method</strong>s. Target codes are: LF – Leftand(delet) Frontal, LFTI – Left Fronto-Tempo-Insular, RPO – Right Parieto-Occipital, LFP –Left Frontal-Periventricular, and MP - Medial Perichiasmatic and anterior to the Midbra<strong>in</strong>.Table 1 summarizes the results. The mean trajectory <strong>plann<strong>in</strong>g</strong> time us<strong>in</strong>g the rout<strong>in</strong>e<strong>method</strong> was 10.8 m<strong>in</strong> (range 6-19 m<strong>in</strong>) compared to a mean of 7.7 m<strong>in</strong> (range 6-10m<strong>in</strong>) us<strong>in</strong>g our <strong>method</strong>. Us<strong>in</strong>g the rout<strong>in</strong>e <strong>method</strong>, the mean distance of a plannedtrajectory to closest Blood Vessel (BV) and closest ventricle are 5.2mm (range 0.0-12.0 mm) and 17.8 mm (range 2.7-37.8 mm), respectively. Our <strong>method</strong> yielded meandistances of 6.8 mm (range 1.0-12.0 mm) from a blood vessel and 18.1mm (range4.9-37.1 mm) from closest ventricle. The mean trajectory length with the rout<strong>in</strong>e<strong>method</strong> was 47.7mm (range 25.6-94.4 mm) compared to 51.0mm (range 29.1-96.3mm) us<strong>in</strong>g our <strong>method</strong>.4 DiscussionIn cases 1, 2, and 5 our <strong>method</strong> resulted <strong>in</strong> significantly larger distances of up-to4mm between <strong>trajectories</strong> and their closest blood vessel or ventricle. In cases 3 and 4,no significant difference was observed. The reason <strong>for</strong> the lack of improvement <strong>in</strong>case 3 is that the target po<strong>in</strong>t is located near the cranial surface where it was easier <strong>for</strong>the neurosurgeon to evaluate the risks and def<strong>in</strong>e a trajectory with the rout<strong>in</strong>e <strong>method</strong>.In case 4, the target location was the closest po<strong>in</strong>t along the trajectory to nearest bloodvessel and the ventricle, and there<strong>for</strong>e no improvement was recorded.The neurosurgeon that evaluated our <strong>method</strong> reports that it <strong>in</strong>creased the controland confidence levels, and improved the risk assessment. The colorization of outerhead surface facilitated the entry po<strong>in</strong>t selection. The <strong>3D</strong> visualization of bloodvessels greatly helped <strong>in</strong> understand<strong>in</strong>g their complex structure and their spatialrelations with respect to the planned trajectory. The risk card assisted <strong>in</strong> the trajectoryselection.
85 ConclusionsWe have presented a novel <strong>method</strong> to enhance the conventional trajectory <strong>plann<strong>in</strong>g</strong><strong>method</strong> by a visualization of <strong>trajectories</strong> risks and by provid<strong>in</strong>g quantitative risk<strong>in</strong><strong>for</strong>mation and <strong>in</strong>teractive <strong>3D</strong> visualization of localization uncerta<strong>in</strong>ty and structuresassociated with a high risk <strong>for</strong> better assessment of the possible risks <strong>in</strong> <strong>image</strong> guidedkeyhole neurosurgery. Our experimental results suggest that our <strong>method</strong> produces<strong>safe</strong>r <strong>trajectories</strong> <strong>in</strong> which a misplacement of a surgical tool is less likely to damage acritical structure.AcknowledgementsThis work was supported by FP7 ERC ROBOCAST Grant No. 21590.References1. Shamir, R.R., Joskowicz, L., Spektor, S., Shoshan, Y.: Localization and registration accuracy<strong>in</strong> <strong>image</strong> guided neurosurgery: a cl<strong>in</strong>ical study. In: Int J Comput Assist Radiol Surg. 4(1) pp.45-52 (2009).2. Mascott, C.R.: In vivo accuracy of <strong>image</strong> guidance per<strong>for</strong>med us<strong>in</strong>g optical track<strong>in</strong>g andoptimized registration. In: J. Neurosurgery 105(4), pp. 561-7 (2006)3. Tirelli, P., de Momi, E., Borghese, N.A., Ferrigno, G.: An <strong>in</strong>telligent atlas-based <strong>plann<strong>in</strong>g</strong>system <strong>for</strong> keyhole neurosurgery. In: Computer Assisted Radiology and Surgery (CARS2009) supplemental pp. S85-S86 (2009).4. Popovic, A., Trovato, K.: Path <strong>plann<strong>in</strong>g</strong> <strong>for</strong> reduc<strong>in</strong>g tissue damage <strong>in</strong> m<strong>in</strong>imally <strong>in</strong>vasivebra<strong>in</strong> access In: Computer Assisted Radiology and Surgery (CARS 2009) supplemental pp.S132-S133 (2009).5. Guo, T., Parrent, A.G., Peters, T.M.: Automatic target and trajectory identification <strong>for</strong> deepbra<strong>in</strong> stimulation (DBS) procedures. In: Med Image Comput Comput Assist Interv.(MICCAI) 10(Pt 1), pp. 483-90 (2007).6. Brunenberg, E.J., Vilanova, A., Visser-Vandewalle, V., Temel, Y., Ackermans, L., Platel, B.,et al.: Automatic trajectory <strong>plann<strong>in</strong>g</strong> <strong>for</strong> deep bra<strong>in</strong> stimulation: a feasibility study. In: MedImage Comput Comput Assist Interv (MICCAI) 10(Pt 1), pp. 584-92 (2007)7. Fujii, T., Emoto, H., Sugou, N., Mito, T., Shibata, I.: Neuropath planner–automatic pathsearch<strong>in</strong>g <strong>for</strong> neurosurgery. In: Computer Assisted Radiology and Surgery (CARS), pp.587– 96 (2003).8. Bourbakis, N.G., Awad, M.: A 3-D visualization <strong>method</strong> <strong>for</strong> <strong>image</strong>-guided bra<strong>in</strong> surgery. In:IEEE Trans Syst Man Cybern, Part B: Cybern. 33(5), pp. 766-81 (2003)9. Lee, J.D., Huang, C.H., Lee, S.T.: Improv<strong>in</strong>g stereotactic surgery us<strong>in</strong>g 3-D reconstruction.In: IEEE Eng Med Biol Mag. 21(6), pp. 109-16 (2002)10. Vaillant, M., Davatzikos, C., Taylor, R.H., Bryan, R.N.: A path-<strong>plann<strong>in</strong>g</strong> algorithm <strong>for</strong><strong>image</strong>-guided neurosurgery. In: First Jo<strong>in</strong>t Conference Computer Vision, Virtual Realityand Robotics <strong>in</strong> Med. and Med. Robotics and Comp. Assisted Surgery, pp. 467-76, (1997)11. Danielsson, P.E.: Euclidean distance mapp<strong>in</strong>g. In: Computer Vision, Graphics, and ImageProcess<strong>in</strong>g, pp. 227–48 (1980)12. Joskowicz, L., Shamir, R., Freiman, M., Shoham, M., Zehavi, E., Umansky, F., et al.:Image-guided system with m<strong>in</strong>iature robot <strong>for</strong> precise position<strong>in</strong>g and target<strong>in</strong>g <strong>in</strong> keyholeneurosurgery. In: Comput Aided Surg. 11(4), 181-93 (2006)13. The Visualization Toolkit (VTK), http://www.vtk.org/.14. The Insight Segmentation and Registration Toolkit (ITK), http://www.itk.org/.15. <strong>3D</strong> <strong>Slicer</strong>, http://www.slicer.org/.