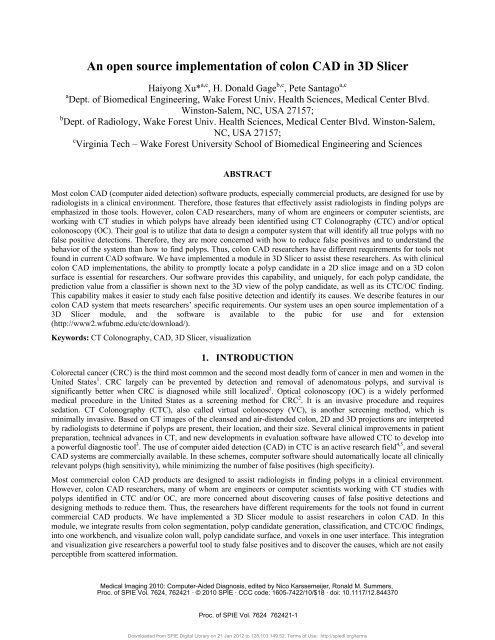
An open source implementation of colon CAD in 3D Slicer
An open source implementation of colon CAD in 3D Slicer
An open source implementation of colon CAD in 3D Slicer

You also want an ePaper? Increase the reach of your titles
YUMPU automatically turns print PDFs into web optimized ePapers that Google loves.
<strong>An</strong> <strong>open</strong> <strong>source</strong> <strong>implementation</strong> <strong>of</strong> <strong>colon</strong> <strong>CAD</strong> <strong>in</strong> <strong>3D</strong> <strong>Slicer</strong>Haiyong Xu* a,c , H. Donald Gage b,c , Pete Santago a,ca Dept. <strong>of</strong> Biomedical Eng<strong>in</strong>eer<strong>in</strong>g, Wake Forest Univ. Health Sciences, Medical Center Blvd.W<strong>in</strong>ston-Salem, NC, USA 27157;b Dept. <strong>of</strong> Radiology, Wake Forest Univ. Health Sciences, Medical Center Blvd. W<strong>in</strong>ston-Salem,NC, USA 27157;c Virg<strong>in</strong>ia Tech – Wake Forest University School <strong>of</strong> Biomedical Eng<strong>in</strong>eer<strong>in</strong>g and SciencesABSTRACTMost <strong>colon</strong> <strong>CAD</strong> (computer aided detection) s<strong>of</strong>tware products, especially commercial products, are designed for use byradiologists <strong>in</strong> a cl<strong>in</strong>ical environment. Therefore, those features that effectively assist radiologists <strong>in</strong> f<strong>in</strong>d<strong>in</strong>g polyps areemphasized <strong>in</strong> those tools. However, <strong>colon</strong> <strong>CAD</strong> researchers, many <strong>of</strong> whom are eng<strong>in</strong>eers or computer scientists, arework<strong>in</strong>g with CT studies <strong>in</strong> which polyps have already been identified us<strong>in</strong>g CT Colonography (CTC) and/or optical<strong>colon</strong>oscopy (OC). Their goal is to utilize that data to design a computer system that will identify all true polyps with n<strong>of</strong>alse positive detections. Therefore, they are more concerned with how to reduce false positives and to understand thebehavior <strong>of</strong> the system than how to f<strong>in</strong>d polyps. Thus, <strong>colon</strong> <strong>CAD</strong> researchers have different requirements for tools notfound <strong>in</strong> current <strong>CAD</strong> s<strong>of</strong>tware. We have implemented a module <strong>in</strong> <strong>3D</strong> <strong>Slicer</strong> to assist these researchers. As with cl<strong>in</strong>ical<strong>colon</strong> <strong>CAD</strong> <strong>implementation</strong>s, the ability to promptly locate a polyp candidate <strong>in</strong> a 2D slice image and on a <strong>3D</strong> <strong>colon</strong>surface is essential for researchers. Our s<strong>of</strong>tware provides this capability, and uniquely, for each polyp candidate, theprediction value from a classifier is shown next to the <strong>3D</strong> view <strong>of</strong> the polyp candidate, as well as its CTC/OC f<strong>in</strong>d<strong>in</strong>g.This capability makes it easier to study each false positive detection and identify its causes. We describe features <strong>in</strong> our<strong>colon</strong> <strong>CAD</strong> system that meets researchers’ specific requirements. Our system uses an <strong>open</strong> <strong>source</strong> <strong>implementation</strong> <strong>of</strong> a<strong>3D</strong> <strong>Slicer</strong> module, and the s<strong>of</strong>tware is available to the pubic for use and for extension(http://www2.wfubmc.edu/ctc/download/).Keywords: CT Colonography, <strong>CAD</strong>, <strong>3D</strong> <strong>Slicer</strong>, visualization1. INTRODUCTIONColorectal cancer (CRC) is the third most common and the second most deadly form <strong>of</strong> cancer <strong>in</strong> men and women <strong>in</strong> theUnited States 1 . CRC largely can be prevented by detection and removal <strong>of</strong> adenomatous polyps, and survival issignificantly better when CRC is diagnosed while still localized 2 . Optical <strong>colon</strong>oscopy (OC) is a widely performedmedical procedure <strong>in</strong> the United States as a screen<strong>in</strong>g method for CRC 2 . It is an <strong>in</strong>vasive procedure and requiressedation. CT Colonography (CTC), also called virtual <strong>colon</strong>oscopy (VC), is another screen<strong>in</strong>g method, which ism<strong>in</strong>imally <strong>in</strong>vasive. Based on CT images <strong>of</strong> the cleansed and air-distended <strong>colon</strong>, 2D and <strong>3D</strong> projections are <strong>in</strong>terpretedby radiologists to determ<strong>in</strong>e if polyps are present, their location, and their size. Several cl<strong>in</strong>ical improvements <strong>in</strong> patientpreparation, technical advances <strong>in</strong> CT, and new developments <strong>in</strong> evaluation s<strong>of</strong>tware have allowed CTC to develop <strong>in</strong>toa powerful diagnostic tool 3 . The use <strong>of</strong> computer aided detection (<strong>CAD</strong>) <strong>in</strong> CTC is an active research field 4,5 , and several<strong>CAD</strong> systems are commercially available. In these schemes, computer s<strong>of</strong>tware should automatically locate all cl<strong>in</strong>icallyrelevant polyps (high sensitivity), while m<strong>in</strong>imiz<strong>in</strong>g the number <strong>of</strong> false positives (high specificity).Most commercial <strong>colon</strong> <strong>CAD</strong> products are designed to assist radiologists <strong>in</strong> f<strong>in</strong>d<strong>in</strong>g polyps <strong>in</strong> a cl<strong>in</strong>ical environment.However, <strong>colon</strong> <strong>CAD</strong> researchers, many <strong>of</strong> whom are eng<strong>in</strong>eers or computer scientists work<strong>in</strong>g with CT studies withpolyps identified <strong>in</strong> CTC and/or OC, are more concerned about discover<strong>in</strong>g causes <strong>of</strong> false positive detections anddesign<strong>in</strong>g methods to reduce them. Thus, the researchers have different requirements for the tools not found <strong>in</strong> currentcommercial <strong>CAD</strong> products. We have implemented a <strong>3D</strong> <strong>Slicer</strong> module to assist researchers <strong>in</strong> <strong>colon</strong> <strong>CAD</strong>. In thismodule, we <strong>in</strong>tegrate results from <strong>colon</strong> segmentation, polyp candidate generation, classification, and CTC/OC f<strong>in</strong>d<strong>in</strong>gs,<strong>in</strong>to one workbench, and visualize <strong>colon</strong> wall, polyp candidate surface, and voxels <strong>in</strong> one user <strong>in</strong>terface. This <strong>in</strong>tegrationand visualization give researchers a powerful tool to study false positives and to discover the causes, which are not easilyperceptible from scattered <strong>in</strong>formation.Medical Imag<strong>in</strong>g 2010: Computer-Aided Diagnosis, edited by Nico Karssemeijer, Ronald M. Summers,Proc. <strong>of</strong> SPIE Vol. 7624, 762421 · © 2010 SPIE · CCC code: 1605-7422/10/$18 · doi: 10.1117/12.844370Proc. <strong>of</strong> SPIE Vol. 7624 762421-1Downloaded from SPIE Digital Library on 21 Jan 2012 to 128.103.149.52. Terms <strong>of</strong> Use: http://spiedl.org/terms
<strong>3D</strong> <strong>Slicer</strong> (<strong>Slicer</strong>) 6 is a free, <strong>open</strong> <strong>source</strong> s<strong>of</strong>tware package for visualization and image comput<strong>in</strong>g. It providesfunctionality for segmentation, registration, and <strong>3D</strong> visualization <strong>of</strong> multi-modal medical image data. <strong>Slicer</strong> began as animage-guided surgery system developed at the MIT AI Lab <strong>in</strong> collaboration with the Surgical Plann<strong>in</strong>g Laboratory at theBrigham and Women’s Hospital <strong>in</strong> 1999 7 and has evolved to support a wide variety <strong>of</strong> cl<strong>in</strong>ical applications. <strong>Slicer</strong><strong>in</strong>cludes rout<strong>in</strong>es to read and write various file formats, manipulate 2D and <strong>3D</strong> coord<strong>in</strong>ate systems, and present aconsistent user <strong>in</strong>terface paradigm and visualization metaphor 8 . <strong>Slicer</strong>’s component architecture is based on the concept<strong>of</strong> modules that can provide new user <strong>in</strong>terface components, new s<strong>of</strong>tware services, or a comb<strong>in</strong>ation there<strong>of</strong>. Almost allfunctionalities <strong>of</strong> <strong>Slicer</strong> are implemented as modules (command-l<strong>in</strong>e module or <strong>in</strong>teractive module). In this paper, wedescribe our <strong>implementation</strong> <strong>of</strong> an <strong>in</strong>teractive module <strong>in</strong> <strong>Slicer</strong> to assist CTC researchers <strong>in</strong> discover<strong>in</strong>g causes <strong>of</strong> falsepositive detections and design<strong>in</strong>g methods to reduce them.To the best knowledge <strong>of</strong> the authors, the most recent work <strong>of</strong> CTC <strong>in</strong> <strong>Slicer</strong> was published by Na<strong>in</strong>, et al. 9 The proposed<strong>3D</strong> virtual endoscopy system allows the user to <strong>in</strong>teractively explore the <strong>in</strong>ternal surface <strong>of</strong> a <strong>3D</strong> anatomical model andto create and update a fly-through trajectory through the model to simulate endoscopy. The goal <strong>in</strong> that work was tocomb<strong>in</strong>e the strength <strong>of</strong> 2D imag<strong>in</strong>g techniques with <strong>3D</strong> visualization <strong>in</strong> order to simulate the surgical environment andprovides the user with navigational and path creation options. Like most commercial <strong>colon</strong> <strong>CAD</strong> products, that systemassists radiologists <strong>in</strong> f<strong>in</strong>d<strong>in</strong>g polyps <strong>in</strong> CTC rather than helps CTC researchers <strong>in</strong> discover<strong>in</strong>g causes <strong>of</strong> false positivedetections. In our <strong>colon</strong> <strong>CAD</strong>, we developed a free, <strong>open</strong> <strong>source</strong> <strong>colon</strong> <strong>CAD</strong> system to meet the researchers’requirements.2. METHODOLOGY2.1 Overview <strong>of</strong> <strong>colon</strong> <strong>CAD</strong>A <strong>colon</strong> <strong>CAD</strong> system is a multi-step procedure, typically consist<strong>in</strong>g <strong>of</strong> (1) <strong>colon</strong> wall segmentation, (2) <strong>in</strong>termediatepolyp candidate generation, (3) classification for detection <strong>of</strong> f<strong>in</strong>al candidates, and (4) f<strong>in</strong>al polyp candidatepresentation 10 . The purpose <strong>of</strong> segmentation is to limit the search area for polyps to reduce primary process<strong>in</strong>g time, andto reduce causes <strong>of</strong> false positive detections com<strong>in</strong>g from the small bowel and extra <strong>colon</strong>ic structures. Generat<strong>in</strong>g<strong>in</strong>termediate polyp candidates is applied to f<strong>in</strong>d regions which are likely polyps; each <strong>in</strong>termediate polyp candidate isrepresented by features gathered from the candidate region. The goal <strong>of</strong> polyp candidate generation is to identify asmany true polyps as possible while m<strong>in</strong>imiz<strong>in</strong>g false positives. However, s<strong>in</strong>ce high sensitivity is important at this stage,many false positives are generated. Thus, the <strong>in</strong>termediate polyp candidates are fed <strong>in</strong>to a classifier that is tra<strong>in</strong>ed toreduce false positives. Positive polyp candidates filtered by a classifier are presented to users as f<strong>in</strong>al polyp candidates.In this paper, we focus on the last step (f<strong>in</strong>al polyp candidate presentation) and describe a <strong>Slicer</strong> module which shows alist <strong>of</strong> polyp candidates and display <strong>3D</strong> view for each polyp candidate.2.2 Segmentation, <strong>in</strong>termediate polyp candidate generation, and classificationThe details <strong>of</strong> segmentation, generat<strong>in</strong>g <strong>in</strong>termediate polyp candidates, and classification are published <strong>in</strong> 11,12,13,14 . In thissection, we briefly describe the procedure <strong>in</strong> each step.A fully automatic segmentation method that has been proposed <strong>in</strong> 11 was used <strong>in</strong> our <strong>colon</strong> <strong>CAD</strong>. The algorithm uses thegeometry <strong>of</strong> the <strong>colon</strong> as features to detect and segment the lumen. First, segmentation <strong>of</strong> the volume background is doneus<strong>in</strong>g a region grower. The result<strong>in</strong>g connected region is used as a mask to elim<strong>in</strong>ate the background dur<strong>in</strong>g furtherprocess<strong>in</strong>g. Next, a set <strong>of</strong> thresholds is applied to generate a b<strong>in</strong>ary image <strong>of</strong> gas and tissue. A distance transform is thenused to locate a po<strong>in</strong>t <strong>in</strong>side the gas regions with a maximal distance from other tissues. This seed po<strong>in</strong>t is used by theregion grow<strong>in</strong>g algorithm to segment the gas-filled portion <strong>of</strong> the <strong>colon</strong>. <strong>An</strong> estimate <strong>of</strong> the amount <strong>of</strong> elongation <strong>of</strong> thegas-filled object is obta<strong>in</strong>ed dur<strong>in</strong>g the segmentation process and is used with the location <strong>of</strong> the seed po<strong>in</strong>t to decide ifthe object is bowel or stomach. If the object is relatively elongated or occurs below the top one-quarter <strong>of</strong> the volume, itis considered part <strong>of</strong> the bowel and is added to the segmentation. The algorithm then proceeds by mask<strong>in</strong>g the previousgrown region from the distance transform image and search<strong>in</strong>g for another seed po<strong>in</strong>t <strong>in</strong> the rema<strong>in</strong><strong>in</strong>g gas-filledsegments. Besides gas, the <strong>colon</strong> is also filled with reta<strong>in</strong>ed residue after bowel preparation, which is homogeneouscontrast enhanced fluid (CEF). To <strong>in</strong>clude these CEF-filled lumen sections, the mean and Gaussian curvature at eachpo<strong>in</strong>t on the surface are computed and relatively large areas <strong>of</strong> low curvature <strong>in</strong>dicate a fluid boundary. Selective dilationacross the boundary is used to extend the gas segmentation <strong>in</strong> the residual CEF.Proc. <strong>of</strong> SPIE Vol. 7624 762421-2Downloaded from SPIE Digital Library on 21 Jan 2012 to 128.103.149.52. Terms <strong>of</strong> Use: http://spiedl.org/terms
In generat<strong>in</strong>g <strong>in</strong>termediate polyp candidates, a polyp candidate consists <strong>of</strong> a group <strong>of</strong> connected voxels, from whichgeometric features are calculated and classified to identify a polyp. These candidates are <strong>in</strong>itially detected us<strong>in</strong>g a subset<strong>of</strong> features and segmented roughly us<strong>in</strong>g various heuristic means to form candidate polyp regions, over which statisticscan be computed per polyp. At each <strong>colon</strong>ic wall voxel, pr<strong>in</strong>cipal, Gaussian, mean curvatures, shape <strong>in</strong>dex (SI) andcurvedness (CV) values are computed respectively. Voxels that have SI and CV values with<strong>in</strong> predef<strong>in</strong>ed range areextracted as seed voxels by threshold<strong>in</strong>g (SI: [0, 0.11], CV [0.075, 0.2]). From those seed voxels, a region grow<strong>in</strong>gprocedure then extracts the major part <strong>of</strong> a polyp. It is reasonable to relax the ranges (SI: [0, 0.22], CV [0.05, 0.25])around polyps’ peripheral region. Then a fuzzy c-means cluster<strong>in</strong>g 15 is applied to remove some polyp candidates due toimage noise and effectively group voxels belong<strong>in</strong>g to the same polyp <strong>in</strong> a large cluster. The cluster<strong>in</strong>g is based onvoxels’ feature values, which <strong>in</strong>clude SI, CV, magnitude <strong>of</strong> the gradient, CT <strong>in</strong>tensity value, and spatial coord<strong>in</strong>ates.Further features such as gradient concentration, directional gradient concentrate, sphericity, compactness, wall/regiondensity and polyp radius are computed after the cluster<strong>in</strong>g step. These features are further characterized by statisticaloperations (mean, max, m<strong>in</strong>, variance, etc.) to form polyp candidates’ features. <strong>An</strong> <strong>in</strong>termediate polyp candidate isconsidered as a true positive detection if the distance between it and the center <strong>of</strong> a polyp (detected <strong>in</strong> CTC/OC) is equalto or less than the polyp size measured <strong>in</strong> CTC/OC.In classification for detection <strong>of</strong> f<strong>in</strong>al candidates, several algorithms have been <strong>in</strong>vestigated <strong>in</strong> our <strong>CAD</strong> system,<strong>in</strong>clud<strong>in</strong>g support vector mach<strong>in</strong>es (SVMs), AdaBoost, artificial neural network, C4.5 decision tree, etc. We use theclassification results from SVMs <strong>in</strong> this paper for its balanced performance <strong>in</strong> terms <strong>of</strong> sensitivity, specificity, and areaunder ROC curve (AUC) 13,14 . For the classification task <strong>in</strong> a <strong>colon</strong> <strong>CAD</strong> system, the tra<strong>in</strong><strong>in</strong>g data is extremelyimbalanced because there are many more false positive detections than true positive ones <strong>in</strong> the <strong>in</strong>termediate polypcandidates. Simply tra<strong>in</strong><strong>in</strong>g a classifier with this imbalanced data will produce an un<strong>in</strong>formative result s<strong>in</strong>ce the classifiercan reach very high accuracy by classify<strong>in</strong>g all polyp candidates as false positive detections. In order to overcome thisimbalanced data problem, we employed the SMOTE oversampl<strong>in</strong>g technique 16 dur<strong>in</strong>g classifier tra<strong>in</strong><strong>in</strong>g. <strong>An</strong>other issue<strong>in</strong> classification task is to determ<strong>in</strong>e the value for parameters for each classification algorithm, e.g., what kernel functionshould be used <strong>in</strong> SVMs. In our <strong>colon</strong> <strong>CAD</strong>, we tuned the parameters experimentally. A classifier with different valuesfor each parameter is tra<strong>in</strong>ed and tested <strong>in</strong> a computer cluster environment. Tra<strong>in</strong>ed classifiers are evaluated us<strong>in</strong>g 10-fold cross-validation method and are ranked accord<strong>in</strong>g to different comb<strong>in</strong>ations <strong>of</strong> criteria: sensitivity, specificity, andAUC. The output <strong>of</strong> each classifier is mapped to a prediction value rang<strong>in</strong>g from 0 to 1. In the <strong>implementation</strong>, we usethe <strong>open</strong> <strong>source</strong> mach<strong>in</strong>e learn<strong>in</strong>g s<strong>of</strong>tware WEKA 17 .2.3 Presentation <strong>of</strong> the polyp candidates – a <strong>Slicer</strong> module to <strong>in</strong>tegrate and visualize polyp candidatesThe <strong>in</strong>put to the <strong>Slicer</strong> module <strong>in</strong>cludes three parts: 1) the segmentation file <strong>of</strong> the <strong>colon</strong> wall, which is label map<strong>in</strong>dicat<strong>in</strong>g <strong>in</strong>side and outside <strong>of</strong> <strong>colon</strong> wall. 2) The <strong>in</strong>termediate polyp candidates’ feature files. As mentioned above,each <strong>in</strong>termediate polyp candidate is generated from cluster<strong>in</strong>g seed voxels. The features for <strong>in</strong>termediate polypcandidates and features for seed voxels are stored separately, and the relationship between each <strong>in</strong>termediate and its seedvoxels are established through an assigned polyp id. 3) The classification file that <strong>in</strong>cludes the predication value for each<strong>in</strong>termediate polyp candidate and the CTC/OC f<strong>in</strong>d<strong>in</strong>g (“1” <strong>in</strong>dicates an <strong>in</strong>termediate polyp candidate is true positive;“0” <strong>in</strong>dicates false positive). Normally these three <strong>in</strong>puts are stored <strong>in</strong> different files mak<strong>in</strong>g it difficult to analyze thefalse positive <strong>in</strong>termediate polyp candidates. In the next sections, we describe a <strong>Slicer</strong> module that <strong>in</strong>tegrates this<strong>in</strong>formation <strong>in</strong>to one workbench and allows one to the visualize <strong>colon</strong> wall, polyp candidate surface, and voxels <strong>in</strong> oneuser <strong>in</strong>terface. In this way, allow<strong>in</strong>g discovery <strong>of</strong> the basis for the many false positives.Figure 1 illustrates how to use this <strong>Slicer</strong> module. This <strong>in</strong>cludes the follow<strong>in</strong>g steps: load CT study, load <strong>in</strong>termediatepolyp candidates (<strong>in</strong>clud<strong>in</strong>g its seed voxels), load segmentation result, locate a polyp candidate, observe the polypcandidate <strong>in</strong> 2D views (sagittal, coronal, and axial), and visualize the polyp candidate <strong>in</strong> a <strong>3D</strong> view. The first step, loadCT study, is done through <strong>Slicer</strong>’s volumes module. In load<strong>in</strong>g <strong>in</strong>termediate polyp candidates, the filenames for polypcandidates’ features, seed voxels’ features, and classifier’s prediction value are specified <strong>in</strong> a panel as shown <strong>in</strong> figure 2.Each file is a text file; the appendix describes its format. After this step, a list <strong>of</strong> <strong>in</strong>termediate polyp candidates is shownas <strong>in</strong> the lower part <strong>of</strong> the figure 2. The 1st column is the assigned polyp id. The next three columns are DICOMcoord<strong>in</strong>ates for each <strong>in</strong>termediate polyp candidate. The 4th column, pred 0, is the classifier’s predication value for this<strong>in</strong>termediate polyp candidate. A value close to 1 means this <strong>in</strong>termediate polyp candidate is most likely to be a negativedetection. In the 5th column, a value close to 1 means this <strong>in</strong>termediate polyp candidate is most likely to be positive. Thelast column, target, is the CTC/OC f<strong>in</strong>d<strong>in</strong>g; A value <strong>of</strong> “1” <strong>in</strong>dicates that there is a true polyp found near the location <strong>of</strong>that <strong>in</strong>termediate polyp candidate <strong>in</strong> CTC/OC, while “0” <strong>in</strong>dicates no nearby polyp. In the third step, load segmentationProc. <strong>of</strong> SPIE Vol. 7624 762421-<strong>3D</strong>ownloaded from SPIE Digital Library on 21 Jan 2012 to 128.103.149.52. Terms <strong>of</strong> Use: http://spiedl.org/terms
esult, a label map file (<strong>in</strong> VTK format as described <strong>in</strong> appendix) is loaded and a contour is applied to generate the <strong>colon</strong>surface. S<strong>in</strong>ce <strong>Slicer</strong> uses a RAS (Right, <strong>An</strong>terior, Superior) coord<strong>in</strong>ate system, which is different from a DICOMcoord<strong>in</strong>ate system (Left, Posterior, Superior), the <strong>colon</strong> surface must be transformed <strong>in</strong> order to properly locate eachpolyp candidate on the <strong>colon</strong> wall.Load CT study Load polyps/voxels Load segmentationLocate a polyp candidate Observe it <strong>in</strong> 2D Visualize it <strong>in</strong> <strong>3D</strong>Figure 1. Overall procedure <strong>of</strong> us<strong>in</strong>g the <strong>Slicer</strong> module to <strong>in</strong>tegrate and visualize polyp candidatesFigure 3 shows the user <strong>in</strong>terface <strong>of</strong> the <strong>Slicer</strong> module which is designed to present polyp candidates. To locate an<strong>in</strong>termediate polyp candidate <strong>in</strong> step four, users click on a polyp candidate <strong>in</strong> the list (figure 2). The three 2D views <strong>of</strong>the CT image (sagittal, coronal, and axial) will automatically display the correct slice accord<strong>in</strong>g to the polyp candidate’slocation, and a square is placed at the location <strong>of</strong> the polyp candidate (figure 3, right bottom). At the same time, a dot isshown on the <strong>colon</strong> surface <strong>in</strong> the <strong>3D</strong> view (figure 3, right top). Users can either observe the details <strong>of</strong> the polypcandidate <strong>in</strong> 2D views or visualize it <strong>in</strong> <strong>3D</strong> view by click<strong>in</strong>g on the dot on the <strong>colon</strong> surface. To display the <strong>3D</strong> view <strong>of</strong>the polyp candidate, a small segment <strong>of</strong> CT volume is extracted and a contour operation is applied to generate the polypcandidate surface. All seed voxels for that polyp candidate are shown as small dots <strong>in</strong>side the polyp candidate region(figure 5, 6). As we can see <strong>in</strong> figure 3, all distributed <strong>in</strong>formation from different steps <strong>in</strong> a <strong>colon</strong> <strong>CAD</strong> is <strong>in</strong>tegrated <strong>in</strong>tothis user <strong>in</strong>terface. Easy access to both 2D and <strong>3D</strong> views <strong>of</strong> each polyp candidates gives CTC researchers a goodopportunity to discover the root causes <strong>of</strong> false positive detections. Moreover, the distribution <strong>of</strong> all <strong>in</strong>termediate polypcandidates for a CT study could be seen <strong>in</strong> one diagram as shown <strong>in</strong> figure 4.3. DATA AND RESULTSWe conducted an experiment on WRAMC CTC data acquired by Pickhardt 18 and provided by the NIH. We selected fivepatients with 12 polyps (>=6mm) found <strong>in</strong> CTC/OC. Our <strong>CAD</strong> detected 66 polyps, 12 be<strong>in</strong>g true positives and 54 be<strong>in</strong>gfalse positives. Among the false positives, 33 are on haustral folds (figure 6a and 6b), 5 are small bump clusters (figure6c), 4 are small polyps (figure 6d), and 1 is rectal tube (figure 6e).Proc. <strong>of</strong> SPIE Vol. 7624 762421-4Downloaded from SPIE Digital Library on 21 Jan 2012 to 128.103.149.52. Terms <strong>of</strong> Use: http://spiedl.org/terms
Figure 2. A panel to load and display <strong>in</strong>termediate polyp candidatesFigure 3. The user <strong>in</strong>terface <strong>of</strong> the <strong>Slicer</strong> module to present polyp candidatesProc. <strong>of</strong> SPIE Vol. 7624 762421-5Downloaded from SPIE Digital Library on 21 Jan 2012 to 128.103.149.52. Terms <strong>of</strong> Use: http://spiedl.org/terms
Figure 4. All <strong>in</strong>termediate polyp candidates for a CT study which are <strong>in</strong>dicated by dots on a <strong>colon</strong> wall3.1 True positive detectionsFigure 5 shows examples <strong>of</strong> polyps that are successfully detected <strong>in</strong> our <strong>CAD</strong>. The prediction values <strong>of</strong> these polypcandidates are close to 1, which strongly suggests that these are true positive detections. The seed voxels for these polypcandidates are closely clustered <strong>in</strong>side <strong>of</strong> the polyp. The pattern <strong>of</strong> spatial distribution <strong>of</strong> voxels <strong>in</strong> true positives (figure5d) is a strong contrast to the one <strong>in</strong> false positives (figure 6b): the voxels for true positives form a dense cloud <strong>of</strong> whitedots <strong>in</strong>side a polyp whereas voxels belong<strong>in</strong>g to false positives (on haustral folds) are adjacent to <strong>colon</strong> wall. Thisdifference <strong>in</strong> spatial distribution <strong>of</strong> seed voxels implies that this distribution could be a useful feature <strong>in</strong> false positivesreduction.a b c dFigure 5. Examples <strong>of</strong> true positive detections. The red surface is <strong>colon</strong> wall around polyp candidate region and white dotsare seed voxels for that polyp candidate.3.2 False positive detectionsFigure 6 shows four typical causes <strong>of</strong> false positives <strong>in</strong> our <strong>CAD</strong>. The majority <strong>of</strong> false positives are on haustral folds,which comprises up to 61% <strong>of</strong> all false positives <strong>in</strong> our experiment. In the majority <strong>of</strong> these false positives, voxels areclose to <strong>colon</strong> wall as <strong>in</strong> figure 6b. <strong>An</strong>other type <strong>of</strong> false positives (figure 6c) consists <strong>of</strong> several clusters <strong>of</strong> small bumps.Although each <strong>in</strong>dividual bump could be recognized by the classifier as a non-polyp because <strong>of</strong> its small size, threeclosely located small bumps may cause a false positive. Figure 6d is a small size polyp, and figure 6e is a rectal tube.Proc. <strong>of</strong> SPIE Vol. 7624 762421-6Downloaded from SPIE Digital Library on 21 Jan 2012 to 128.103.149.52. Terms <strong>of</strong> Use: http://spiedl.org/terms
a b c d eFigure 6. Four causes <strong>of</strong> false positives: (a, b) haustral fold, (c) clusters <strong>of</strong> small bump (d) small polyp (e) rectal tube4. DISCUSSION AND CONCLUSIONSWe implemented a <strong>Slicer</strong> module based on version 3.3 <strong>of</strong> <strong>Slicer</strong> on the W<strong>in</strong>dows XP platform. Port<strong>in</strong>g it to L<strong>in</strong>ux andMac platforms shouldn’t be difficult s<strong>in</strong>ce platform <strong>in</strong>dependence is seriously considered <strong>in</strong> our <strong>implementation</strong>.In our <strong>colon</strong> <strong>CAD</strong>, we present all <strong>in</strong>termediate polyp candidates rather than f<strong>in</strong>al candidates for two reasons. First, eventhough some <strong>in</strong>termediate polyp candidates are correctly classified as negative detections, the prediction value for themare close to 0.5 which implies that the classifier is not very confident to put it as a negative one. Only present<strong>in</strong>g f<strong>in</strong>alpolyp candidates, as most commercial <strong>colon</strong> <strong>CAD</strong> products do, prevents researchers from study<strong>in</strong>g some <strong>in</strong>termediatepolyp candidates that are similar to polyps. Therefore, we list all <strong>in</strong>termediate polyp candidates to researchers and letthem select one to study. Second, present<strong>in</strong>g all <strong>in</strong>termediate polyp candidates makes it easier to evaluate theperformance <strong>of</strong> each step <strong>in</strong> a <strong>colon</strong> <strong>CAD</strong>, i.e., segmentation, generat<strong>in</strong>g <strong>in</strong>termediate polyp candidates, andclassification. <strong>An</strong>d it encourages researchers to design a better subsystem <strong>in</strong> a <strong>colon</strong> <strong>CAD</strong>.In our <strong>colon</strong> <strong>CAD</strong> system, several parameters need to be configured experimentally. Please see previouspublication 11,12,13,14 for parameter configuration <strong>in</strong> each <strong>in</strong>dividual subsystem. In this <strong>Slicer</strong> module, two parameters areset <strong>in</strong> accord<strong>in</strong>g to the visual effect <strong>of</strong> polyp candidates. The first parameter is the size <strong>of</strong> CT volume for each polypcandidate. We crop a CT volume <strong>of</strong> about 30mm x 30mm x 30mm to get a better coverage <strong>of</strong> polyp candidates. Thesecond parameter is the threshold value to contour polyp surface. We use -800 as the threshold because it provides thebest view <strong>of</strong> the polyp surface.In conclusion, we implemented an <strong>open</strong> <strong>source</strong> <strong>colon</strong> <strong>CAD</strong> system to meet the requirements <strong>of</strong> researchers <strong>in</strong> CTC -f<strong>in</strong>d<strong>in</strong>g causes <strong>of</strong> false positive detections and design methods to reduce them. We use <strong>Slicer</strong> as a platform and <strong>in</strong>tegrateresults from segmentation, <strong>in</strong>termediate polyp candidate generation, and classification <strong>in</strong>to one user <strong>in</strong>terface. Thevisualization <strong>of</strong> <strong>colon</strong> surface, polyp candidates, and seed voxels <strong>of</strong> each polyp candidate gives researchers more power<strong>in</strong> study<strong>in</strong>g false positive detections. Us<strong>in</strong>g this <strong>colon</strong> <strong>CAD</strong> we identified four typical causes <strong>of</strong> false positives <strong>in</strong> ourexperimental data. In the future, we will analyze more false positives and design methods to improve the detectionperformance <strong>of</strong> our <strong>colon</strong> <strong>CAD</strong>.5. APPENDIX5.1 Format <strong>of</strong> segmentation file:In the VTK file, the follow<strong>in</strong>g code scheme is used to represent the type <strong>of</strong> each voxel.0: background: not <strong>in</strong> <strong>colon</strong> lumen or adjacent to <strong>colon</strong> wall.1: lumen: voxel on the <strong>in</strong>terior <strong>of</strong> the <strong>colon</strong>100: <strong>colon</strong> wall: any voxel adjacent to lumen, may or may not be a polyp candidate.100+ID: polyp id: polyp candidate voxel which belongs to polyp candidate number ID.5.2 Format <strong>of</strong> <strong>in</strong>termediate polyp candidate feature file:There are 94 columns with 89 <strong>of</strong> which are polyp features. Each row represents an <strong>in</strong>termediate polyp candidate:#Study_id,polyp_id,centerx,centery,centerz,mean_SI,max_SI,m<strong>in</strong>_SI,var_SIskew_SI,kurt_SI,contrast_SI,…Proc. <strong>of</strong> SPIE Vol. 7624 762421-7Downloaded from SPIE Digital Library on 21 Jan 2012 to 128.103.149.52. Terms <strong>of</strong> Use: http://spiedl.org/terms
1,1,4.0347,-40.2952,-350.4048,0.1546,0.2485,0.0232,0.0042,-0.568, -0.6806,0.0932,…5.3 Format <strong>of</strong> seed voxels feature file:There are 16 columns with nice <strong>of</strong> which are voxel features. Each row represents a seed voxel:#polypid,centerx,centery,centerz,<strong>in</strong>dex_x,<strong>in</strong>dex_y,<strong>in</strong>dex_z,SI,CV,DGC,GC,Gradient_mag,Gaussian_curvature,Mean_curvature,M<strong>in</strong>_curvature,Max_curvature1,4.0347,-40.2952,-350.4048,111,212,336,0.1052,0.1164,0.0953,0.467,54.4643,0.0107,0.1101,0.0724,0.14795.4 Format <strong>of</strong> classifier’s prediction file:There are five columns with each row represent<strong>in</strong>g an <strong>in</strong>termediate polyp candidate:#study_id,polyp_id,CTC/OC f<strong>in</strong>d<strong>in</strong>g,prediction value for negative, prediction value for positiveWRAMC_VC-008/2/15,12,0,0.9318,0.0682ACKNOWLEDGEMENTSWe would like to thank Christopher Wyatt, Ph.D. and Yuan Shen from the Department <strong>of</strong> Electrical and ComputerEng<strong>in</strong>eer<strong>in</strong>g at Virg<strong>in</strong>ia Tech for their work <strong>in</strong> <strong>colon</strong> segmentation and polyp candidate generation. We would also liketo thank James Perumpillichira, M.D. from the Department <strong>of</strong> Radiology at Wake Forest University Health Sciences forhis help <strong>in</strong> read<strong>in</strong>g CT studies and f<strong>in</strong>d<strong>in</strong>g the location and size <strong>of</strong> polyps <strong>in</strong> our experimental data. This research wassupported <strong>in</strong> part by NIH grant 5R01CA114492-03.REFERENCES[1] Jemal, A., Siegel, R., Ward, E., Hao, Y., Xu, J., Murray, T., and Thun, M. J., “Cancer statistics, 2008,” CA Cancer JCl<strong>in</strong> (58), 71-96(2008).[2] Lev<strong>in</strong>, B., Lieberman, D. A., McFarland, B., et al. “Screen<strong>in</strong>g and surveillance for the early detection <strong>of</strong> colorectalcancer and adenomatous polyps, 2008: a jo<strong>in</strong>t guidel<strong>in</strong>e from the American Cancer Society, the US Multi-SocietyTask Force on Colorectal Cancer, and the American College <strong>of</strong> Radiology,” CA Cancer J Cl<strong>in</strong> 58(3), 130-160(2008).[3] Mang, T., Graser, A., Schima, W., and Maier, A., “Ct <strong>colon</strong>ography: Techniques, <strong>in</strong>dications, f<strong>in</strong>d<strong>in</strong>gs,” EuropeanJournal <strong>of</strong> Radiology, 61(3), 388-399 (2007).[4] Yoshida, H. and Dachman, A. H., “<strong>CAD</strong> techniques, challenges, and controversies <strong>in</strong> computed tomographic<strong>colon</strong>ography,” Abdom<strong>in</strong>al Imag<strong>in</strong>g 30(1), 26–41 (2005).[5] Yoshida, H. and Nappi, J., “<strong>CAD</strong> <strong>in</strong> CT <strong>colon</strong>ography without and with oral contrast agents: progress andchallenges,” Computerized medical imag<strong>in</strong>g and graphic 31(4-5), 267–284 (2007).[6] http://www.slicer.org[7] Ger<strong>in</strong>g, D., Nabavi, A., Kik<strong>in</strong>is, R., Grimson, W., Hata, N., Everett, P., Jolesz, F., and Wells, W., “<strong>An</strong> IntegratedVisualization System for Surgical Plann<strong>in</strong>g and Guidance us<strong>in</strong>g Image Fusion and Interventional Imag<strong>in</strong>g”, Int ConfMed Image Comput Comput Assist Interv, 2, 809-819 (1999).[8] Pieper, S., Halle, M., and Kik<strong>in</strong>is, R., “<strong>3D</strong> SLICER,” Proceed<strong>in</strong>gs <strong>of</strong> the 1st IEEE International Symposium onBiomedical Imag<strong>in</strong>g: From Nano to Macro 1, 632-635 (2004).[9] Na<strong>in</strong>, D., Haker, S., Kik<strong>in</strong>is, R., Eric, W., and Grimson, L., “<strong>An</strong> <strong>in</strong>teractive virtual endoscopy tool,” <strong>in</strong> SatelliteWorkshop at the Fourth International Conference on Medical Image Comput<strong>in</strong>g and Computer-AssistedIntervention (MICCAI'2001), 55-60 (2001).[10] Bielen, D. and Kiss, G., “Computer-aided detection for CT <strong>colon</strong>ography: update 2007,” Abdom<strong>in</strong>al Imag<strong>in</strong>g,vol. 32(5), 571-581 (2007).[11] Wyatt, C.L., Ge, Y., V<strong>in</strong><strong>in</strong>g, and D.J., “Automatic segmentation <strong>of</strong> the <strong>colon</strong> for virtual <strong>colon</strong>oscopy,”Computerized medical imag<strong>in</strong>g and graphics, 24(1), 1-9 (2000).Proc. <strong>of</strong> SPIE Vol. 7624 762421-8Downloaded from SPIE Digital Library on 21 Jan 2012 to 128.103.149.52. Terms <strong>of</strong> Use: http://spiedl.org/terms
[12] Shen, Y. and Wyatt, C. L., “Open <strong>implementation</strong> <strong>of</strong> feature extraction methods for computer aided polyp detectionwith pr<strong>in</strong>cipal component analysis,” <strong>in</strong> 11th International Conference on Medical Image Comput<strong>in</strong>g and ComputerAssisted Intervention, 141-147 (2008).[13] http://www.siim2009.org/abstracts/SS2_Xu/SS2_Xu.html[14] Xu, H., Santago, P., Wyatt, C. L., Shen, Y., and Gage, H. D., Computer-aided polyp detection classifier design <strong>in</strong>CT <strong>colon</strong>ography. Journal <strong>of</strong> Digital Imag<strong>in</strong>g 2009 (In Review).[15] Yoshida, H. and Nappi, J., “Three-dimensional computer-aided diagnosis scheme for detection <strong>of</strong> <strong>colon</strong>ic polyps,”IEEE Trans. Med. Imag., 20, 1261-1274 (2001).[16] Chawla, N. V., Bowyer, K. W., Hall, L. O., and Kegelmeyer, W. P., “Smote: Synthetic m<strong>in</strong>ority over-sampl<strong>in</strong>gtechnique,” Journal <strong>of</strong> Artificial Intelligence Research, 16, 321-347 (2002).[17] Witten, I. H. and Frank E., [Data M<strong>in</strong><strong>in</strong>g: Practical Mach<strong>in</strong>e Learn<strong>in</strong>g Tools and Techniques], 2nd ed., MorganKaufmann, (2005).[18] Pickhardt, P. J., Choi, J. R., Hwang, I., Butler, J. A., Puckett, M. L., Hildebrandt, H. A., Wong, R. K., Nugent, P. A.,Mysliwiec, P.A., and Sch<strong>in</strong>dler, W.R., “Computed Tomographic Virtual Colonoscopy to Screen for ColorectalNeoplasia <strong>in</strong> Asymptomatic Adults”, The New England Journal <strong>of</strong> Medic<strong>in</strong>e, 349(23), 2191–2200 (2003).Proc. <strong>of</strong> SPIE Vol. 7624 762421-9Downloaded from SPIE Digital Library on 21 Jan 2012 to 128.103.149.52. Terms <strong>of</strong> Use: http://spiedl.org/terms