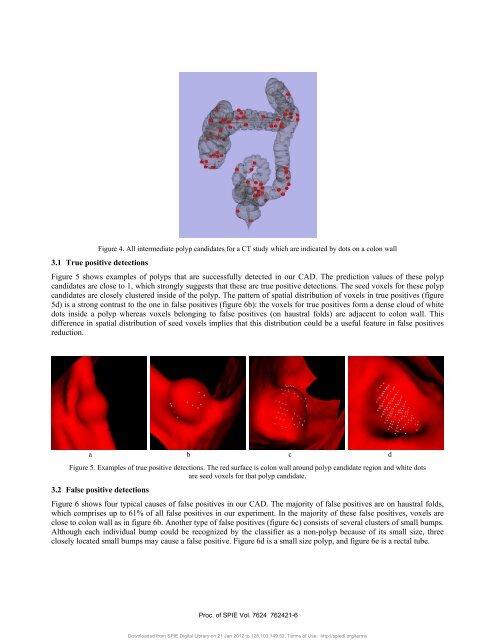
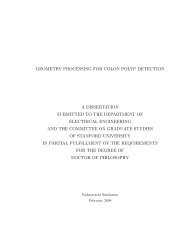
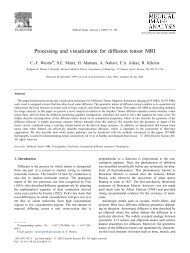
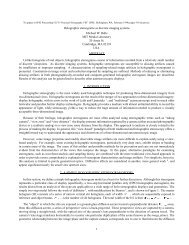
Figure 4. All <strong>in</strong>termediate polyp candidates for a CT study which are <strong>in</strong>dicated by dots on a <strong>colon</strong> wall3.1 True positive detectionsFigure 5 shows examples <strong>of</strong> polyps that are successfully detected <strong>in</strong> our <strong>CAD</strong>. The prediction values <strong>of</strong> these polypcandidates are close to 1, which strongly suggests that these are true positive detections. The seed voxels for these polypcandidates are closely clustered <strong>in</strong>side <strong>of</strong> the polyp. The pattern <strong>of</strong> spatial distribution <strong>of</strong> voxels <strong>in</strong> true positives (figure5d) is a strong contrast to the one <strong>in</strong> false positives (figure 6b): the voxels for true positives form a dense cloud <strong>of</strong> whitedots <strong>in</strong>side a polyp whereas voxels belong<strong>in</strong>g to false positives (on haustral folds) are adjacent to <strong>colon</strong> wall. Thisdifference <strong>in</strong> spatial distribution <strong>of</strong> seed voxels implies that this distribution could be a useful feature <strong>in</strong> false positivesreduction.a b c dFigure 5. Examples <strong>of</strong> true positive detections. The red surface is <strong>colon</strong> wall around polyp candidate region and white dotsare seed voxels for that polyp candidate.3.2 False positive detectionsFigure 6 shows four typical causes <strong>of</strong> false positives <strong>in</strong> our <strong>CAD</strong>. The majority <strong>of</strong> false positives are on haustral folds,which comprises up to 61% <strong>of</strong> all false positives <strong>in</strong> our experiment. In the majority <strong>of</strong> these false positives, voxels areclose to <strong>colon</strong> wall as <strong>in</strong> figure 6b. <strong>An</strong>other type <strong>of</strong> false positives (figure 6c) consists <strong>of</strong> several clusters <strong>of</strong> small bumps.Although each <strong>in</strong>dividual bump could be recognized by the classifier as a non-polyp because <strong>of</strong> its small size, threeclosely located small bumps may cause a false positive. Figure 6d is a small size polyp, and figure 6e is a rectal tube.Proc. <strong>of</strong> SPIE Vol. 7624 762421-6Downloaded from SPIE Digital Library on 21 Jan 2012 to 128.103.149.52. Terms <strong>of</strong> Use: http://spiedl.org/terms
a b c d eFigure 6. Four causes <strong>of</strong> false positives: (a, b) haustral fold, (c) clusters <strong>of</strong> small bump (d) small polyp (e) rectal tube4. DISCUSSION AND CONCLUSIONSWe implemented a <strong>Slicer</strong> module based on version 3.3 <strong>of</strong> <strong>Slicer</strong> on the W<strong>in</strong>dows XP platform. Port<strong>in</strong>g it to L<strong>in</strong>ux andMac platforms shouldn’t be difficult s<strong>in</strong>ce platform <strong>in</strong>dependence is seriously considered <strong>in</strong> our <strong>implementation</strong>.In our <strong>colon</strong> <strong>CAD</strong>, we present all <strong>in</strong>termediate polyp candidates rather than f<strong>in</strong>al candidates for two reasons. First, eventhough some <strong>in</strong>termediate polyp candidates are correctly classified as negative detections, the prediction value for themare close to 0.5 which implies that the classifier is not very confident to put it as a negative one. Only present<strong>in</strong>g f<strong>in</strong>alpolyp candidates, as most commercial <strong>colon</strong> <strong>CAD</strong> products do, prevents researchers from study<strong>in</strong>g some <strong>in</strong>termediatepolyp candidates that are similar to polyps. Therefore, we list all <strong>in</strong>termediate polyp candidates to researchers and letthem select one to study. Second, present<strong>in</strong>g all <strong>in</strong>termediate polyp candidates makes it easier to evaluate theperformance <strong>of</strong> each step <strong>in</strong> a <strong>colon</strong> <strong>CAD</strong>, i.e., segmentation, generat<strong>in</strong>g <strong>in</strong>termediate polyp candidates, andclassification. <strong>An</strong>d it encourages researchers to design a better subsystem <strong>in</strong> a <strong>colon</strong> <strong>CAD</strong>.In our <strong>colon</strong> <strong>CAD</strong> system, several parameters need to be configured experimentally. Please see previouspublication 11,12,13,14 for parameter configuration <strong>in</strong> each <strong>in</strong>dividual subsystem. In this <strong>Slicer</strong> module, two parameters areset <strong>in</strong> accord<strong>in</strong>g to the visual effect <strong>of</strong> polyp candidates. The first parameter is the size <strong>of</strong> CT volume for each polypcandidate. We crop a CT volume <strong>of</strong> about 30mm x 30mm x 30mm to get a better coverage <strong>of</strong> polyp candidates. Thesecond parameter is the threshold value to contour polyp surface. We use -800 as the threshold because it provides thebest view <strong>of</strong> the polyp surface.In conclusion, we implemented an <strong>open</strong> <strong>source</strong> <strong>colon</strong> <strong>CAD</strong> system to meet the requirements <strong>of</strong> researchers <strong>in</strong> CTC -f<strong>in</strong>d<strong>in</strong>g causes <strong>of</strong> false positive detections and design methods to reduce them. We use <strong>Slicer</strong> as a platform and <strong>in</strong>tegrateresults from segmentation, <strong>in</strong>termediate polyp candidate generation, and classification <strong>in</strong>to one user <strong>in</strong>terface. Thevisualization <strong>of</strong> <strong>colon</strong> surface, polyp candidates, and seed voxels <strong>of</strong> each polyp candidate gives researchers more power<strong>in</strong> study<strong>in</strong>g false positive detections. Us<strong>in</strong>g this <strong>colon</strong> <strong>CAD</strong> we identified four typical causes <strong>of</strong> false positives <strong>in</strong> ourexperimental data. In the future, we will analyze more false positives and design methods to improve the detectionperformance <strong>of</strong> our <strong>colon</strong> <strong>CAD</strong>.5. APPENDIX5.1 Format <strong>of</strong> segmentation file:In the VTK file, the follow<strong>in</strong>g code scheme is used to represent the type <strong>of</strong> each voxel.0: background: not <strong>in</strong> <strong>colon</strong> lumen or adjacent to <strong>colon</strong> wall.1: lumen: voxel on the <strong>in</strong>terior <strong>of</strong> the <strong>colon</strong>100: <strong>colon</strong> wall: any voxel adjacent to lumen, may or may not be a polyp candidate.100+ID: polyp id: polyp candidate voxel which belongs to polyp candidate number ID.5.2 Format <strong>of</strong> <strong>in</strong>termediate polyp candidate feature file:There are 94 columns with 89 <strong>of</strong> which are polyp features. Each row represents an <strong>in</strong>termediate polyp candidate:#Study_id,polyp_id,centerx,centery,centerz,mean_SI,max_SI,m<strong>in</strong>_SI,var_SIskew_SI,kurt_SI,contrast_SI,…Proc. <strong>of</strong> SPIE Vol. 7624 762421-7Downloaded from SPIE Digital Library on 21 Jan 2012 to 128.103.149.52. Terms <strong>of</strong> Use: http://spiedl.org/terms