An open source implementation of colon CAD in 3D Slicer
An open source implementation of colon CAD in 3D Slicer
An open source implementation of colon CAD in 3D Slicer

Create successful ePaper yourself
Turn your PDF publications into a flip-book with our unique Google optimized e-Paper software.
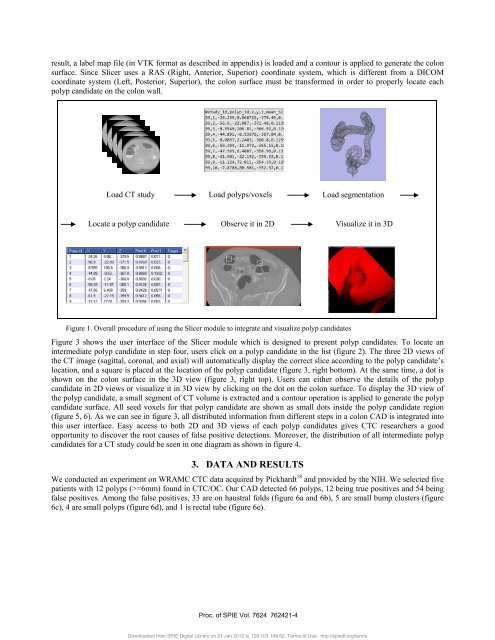
esult, a label map file (<strong>in</strong> VTK format as described <strong>in</strong> appendix) is loaded and a contour is applied to generate the <strong>colon</strong>surface. S<strong>in</strong>ce <strong>Slicer</strong> uses a RAS (Right, <strong>An</strong>terior, Superior) coord<strong>in</strong>ate system, which is different from a DICOMcoord<strong>in</strong>ate system (Left, Posterior, Superior), the <strong>colon</strong> surface must be transformed <strong>in</strong> order to properly locate eachpolyp candidate on the <strong>colon</strong> wall.Load CT study Load polyps/voxels Load segmentationLocate a polyp candidate Observe it <strong>in</strong> 2D Visualize it <strong>in</strong> <strong>3D</strong>Figure 1. Overall procedure <strong>of</strong> us<strong>in</strong>g the <strong>Slicer</strong> module to <strong>in</strong>tegrate and visualize polyp candidatesFigure 3 shows the user <strong>in</strong>terface <strong>of</strong> the <strong>Slicer</strong> module which is designed to present polyp candidates. To locate an<strong>in</strong>termediate polyp candidate <strong>in</strong> step four, users click on a polyp candidate <strong>in</strong> the list (figure 2). The three 2D views <strong>of</strong>the CT image (sagittal, coronal, and axial) will automatically display the correct slice accord<strong>in</strong>g to the polyp candidate’slocation, and a square is placed at the location <strong>of</strong> the polyp candidate (figure 3, right bottom). At the same time, a dot isshown on the <strong>colon</strong> surface <strong>in</strong> the <strong>3D</strong> view (figure 3, right top). Users can either observe the details <strong>of</strong> the polypcandidate <strong>in</strong> 2D views or visualize it <strong>in</strong> <strong>3D</strong> view by click<strong>in</strong>g on the dot on the <strong>colon</strong> surface. To display the <strong>3D</strong> view <strong>of</strong>the polyp candidate, a small segment <strong>of</strong> CT volume is extracted and a contour operation is applied to generate the polypcandidate surface. All seed voxels for that polyp candidate are shown as small dots <strong>in</strong>side the polyp candidate region(figure 5, 6). As we can see <strong>in</strong> figure 3, all distributed <strong>in</strong>formation from different steps <strong>in</strong> a <strong>colon</strong> <strong>CAD</strong> is <strong>in</strong>tegrated <strong>in</strong>tothis user <strong>in</strong>terface. Easy access to both 2D and <strong>3D</strong> views <strong>of</strong> each polyp candidates gives CTC researchers a goodopportunity to discover the root causes <strong>of</strong> false positive detections. Moreover, the distribution <strong>of</strong> all <strong>in</strong>termediate polypcandidates for a CT study could be seen <strong>in</strong> one diagram as shown <strong>in</strong> figure 4.3. DATA AND RESULTSWe conducted an experiment on WRAMC CTC data acquired by Pickhardt 18 and provided by the NIH. We selected fivepatients with 12 polyps (>=6mm) found <strong>in</strong> CTC/OC. Our <strong>CAD</strong> detected 66 polyps, 12 be<strong>in</strong>g true positives and 54 be<strong>in</strong>gfalse positives. Among the false positives, 33 are on haustral folds (figure 6a and 6b), 5 are small bump clusters (figure6c), 4 are small polyps (figure 6d), and 1 is rectal tube (figure 6e).Proc. <strong>of</strong> SPIE Vol. 7624 762421-4Downloaded from SPIE Digital Library on 21 Jan 2012 to 128.103.149.52. Terms <strong>of</strong> Use: http://spiedl.org/terms