

Vanguard International Stock Index Funds Annual Report
Vanguard International Stock Index Funds Annual Report
Vanguard International Stock Index Funds Annual Report

You also want an ePaper? Increase the reach of your titles
YUMPU automatically turns print PDFs into web optimized ePapers that Google loves.
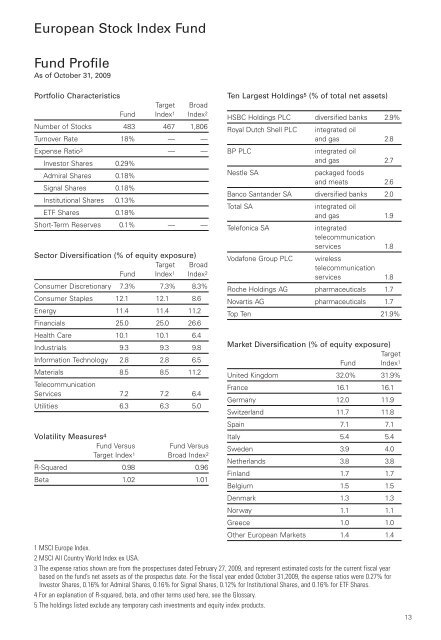
European <strong>Stock</strong> <strong>Index</strong> Fund<br />
Fund Profile<br />
As of October 31, 2009<br />
Portfolio Characteristics<br />
Target Broad<br />
Fund <strong>Index</strong>1 <strong>Index</strong>2 Number of <strong>Stock</strong>s 483 467 1,806<br />
Turnover Rate 18% — —<br />
Expense Ratio3 — —<br />
Investor Shares 0.29%<br />
Admiral Shares 0.18%<br />
Signal Shares 0.18%<br />
Institutional Shares 0.13%<br />
ETF Shares 0.18%<br />
Short-Term Reserves 0.1% — —<br />
Sector Diversification (% of equity exposure)<br />
Target Broad<br />
Fund <strong>Index</strong>1 <strong>Index</strong>2 Consumer Discretionary 7.3% 7.3% 8.3%<br />
Consumer Staples 12.1 12.1 8.6<br />
Energy 11.4 11.4 11.2<br />
Financials 25.0 25.0 26.6<br />
Health Care 10.1 10.1 6.4<br />
Industrials 9.3 9.3 9.8<br />
Information Technology 2.8 2.8 6.5<br />
Materials<br />
Telecommunication<br />
8.5 8.5 11.2<br />
Services 7.2 7.2 6.4<br />
Utilities 6.3 6.3 5.0<br />
Volatility Measures4 Fund Versus Fund Versus<br />
Target <strong>Index</strong>1 Broad <strong>Index</strong>2 R-Squared 0.98 0.96<br />
Beta 1.02 1.01<br />
Ten Largest Holdings 5 (% of total net assets)<br />
HSBC Holdings PLC diversified banks 2.9%<br />
Royal Dutch Shell PLC integrated oil<br />
and gas 2.8<br />
BP PLC integrated oil<br />
and gas 2.7<br />
Nestle SA packaged foods<br />
and meats 2.6<br />
Banco Santander SA diversified banks 2.0<br />
Total SA integrated oil<br />
and gas 1.9<br />
Telefonica SA integrated<br />
telecommunication<br />
services 1.8<br />
Vodafone Group PLC wireless<br />
telecommunication<br />
services 1.8<br />
Roche Holdings AG pharmaceuticals 1.7<br />
Novartis AG pharmaceuticals 1.7<br />
Top Ten 21.9%<br />
Market Diversification (% of equity exposure)<br />
Target<br />
Fund <strong>Index</strong>1 United Kingdom 32.0% 31.9%<br />
France 16.1 16.1<br />
Germany 12.0 11.9<br />
Switzerland 11.7 11.8<br />
Spain 7.1 7.1<br />
Italy 5.4 5.4<br />
Sweden 3.9 4.0<br />
Netherlands 3.8 3.8<br />
Finland 1.7 1.7<br />
Belgium 1.5 1.5<br />
Denmark 1.3 1.3<br />
Norway 1.1 1.1<br />
Greece 1.0 1.0<br />
Other European Markets 1.4 1.4<br />
1 MSCI Europe <strong>Index</strong>.<br />
2 MSCI All Country World <strong>Index</strong> ex USA.<br />
3 The expense ratios shown are from the prospectuses dated February 27, 2009, and represent estimated costs for the current fiscal year<br />
based on the fund’s net assets as of the prospectus date. For the fiscal year ended October 31,2009, the expense ratios were 0.27% for<br />
Investor Shares, 0.16% for Admiral Shares, 0.16% for Signal Shares, 0.12% for Institutional Shares, and 0.16% for ETF Shares.<br />
4 For an explanation of R-squared, beta, and other terms used here, see the Glossary.<br />
5 The holdings listed exclude any temporary cash investments and equity index products.<br />
13


