

Vanguard International Stock Index Funds Annual Report
Vanguard International Stock Index Funds Annual Report
Vanguard International Stock Index Funds Annual Report

Create successful ePaper yourself
Turn your PDF publications into a flip-book with our unique Google optimized e-Paper software.
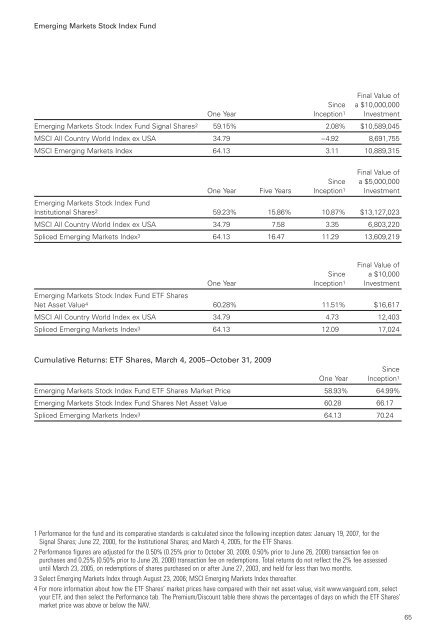
Emerging Markets <strong>Stock</strong> <strong>Index</strong> Fund<br />
Since<br />
Final Value of<br />
a $10,000,000<br />
One Year Inception1 Investment<br />
Emerging Markets <strong>Stock</strong> <strong>Index</strong> Fund Signal Shares2 59.15% 2.08% $10,589,045<br />
MSCI All Country World <strong>Index</strong> ex USA 34.79 –4.92 8,691,755<br />
MSCI Emerging Markets <strong>Index</strong> 64.13 3.11 10,889,315<br />
Since<br />
Final Value of<br />
a $5,000,000<br />
One Year Five Years Inception1 Investment<br />
Emerging Markets <strong>Stock</strong> <strong>Index</strong> Fund<br />
Institutional Shares2 59.23% 15.86% 10.87% $13,127,023<br />
MSCI All Country World <strong>Index</strong> ex USA 34.79 7.58 3.35 6,803,220<br />
Spliced Emerging Markets <strong>Index</strong>3 64.13 16.47 11.29 13,609,219<br />
Since<br />
Final Value of<br />
a $10,000<br />
One Year Inception1 Investment<br />
Emerging Markets <strong>Stock</strong> <strong>Index</strong> Fund ETF Shares<br />
Net Asset Value4 60.28% 11.51% $16,617<br />
MSCI All Country World <strong>Index</strong> ex USA 34.79 4.73 12,403<br />
Spliced Emerging Markets <strong>Index</strong>3 64.13 12.09 17,024<br />
Cumulative Returns: ETF Shares, March 4, 2005–October 31, 2009<br />
One Year<br />
Since<br />
Inception1 Emerging Markets <strong>Stock</strong> <strong>Index</strong> Fund ETF Shares Market Price 58.93% 64.99%<br />
Emerging Markets <strong>Stock</strong> <strong>Index</strong> Fund Shares Net Asset Value 60.28 66.17<br />
Spliced Emerging Markets <strong>Index</strong>3 64.13 70.24<br />
1 Performance for the fund and its comparative standards is calculated since the following inception dates: January 19, 2007, for the<br />
Signal Shares; June 22, 2000, for the Institutional Shares; and March 4, 2005, for the ETF Shares.<br />
2 Performance figures are adjusted for the 0.50% (0.25% prior to October 30, 2009, 0.50% prior to June 26, 2008) transaction fee on<br />
purchases and 0.25% (0.50% prior to June 26, 2008) transaction fee on redemptions. Total returns do not reflect the 2% fee assessed<br />
until March 23, 2005, on redemptions of shares purchased on or after June 27, 2003, and held for less than two months.<br />
3 Select Emerging Markets <strong>Index</strong> through August 23, 2006; MSCI Emerging Markets <strong>Index</strong> thereafter.<br />
4 For more information about how the ETF Shares’ market prices have compared with their net asset value, visit www.vanguard.com, select<br />
your ETF, and then select the Performance tab. The Premium/Discount table there shows the percentages of days on which the ETF Shares’<br />
market price was above or below the NAV.<br />
65


