

Vanguard International Stock Index Funds Annual Report
Vanguard International Stock Index Funds Annual Report
Vanguard International Stock Index Funds Annual Report

Create successful ePaper yourself
Turn your PDF publications into a flip-book with our unique Google optimized e-Paper software.
64<br />
Emerging Markets <strong>Stock</strong> <strong>Index</strong> Fund<br />
Performance Summary<br />
All of the returns in this report represent past performance, which is not a guarantee of future<br />
results that may be achieved by the fund. (Current performance may be lower or higher than<br />
the performance data cited. For performance data current to the most recent month-end, visit<br />
our website at www.vanguard.com/performance.) Note, too, that both investment returns and<br />
principal value can fluctuate widely, so an investor’s shares, when sold, could be worth more<br />
or less than their original cost. The returns shown do not reflect taxes that a shareholder would<br />
pay on fund distributions or on the sale of fund shares.<br />
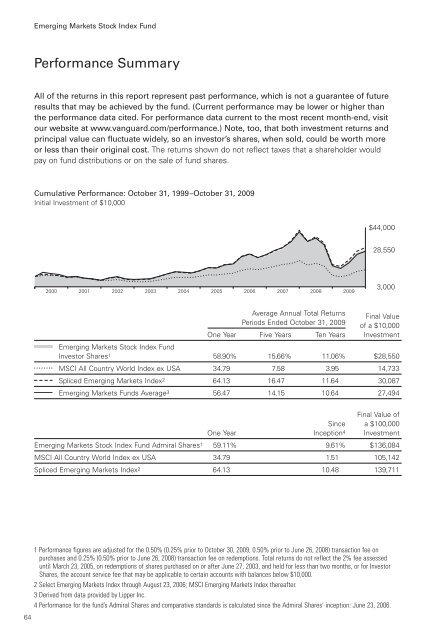
Cumulative Performance: October 31, 1999–October 31, 2009<br />
Initial Investment of $10,000<br />
2000<br />
2001<br />
2002<br />
2003<br />
2004<br />
2005<br />
1 Performance figures are adjusted for the 0.50% (0.25% prior to October 30, 2009, 0.50% prior to June 26, 2008) transaction fee on<br />
purchases and 0.25% (0.50% prior to June 26, 2008) transaction fee on redemptions. Total returns do not reflect the 2% fee assessed<br />
until March 23, 2005, on redemptions of shares purchased on or after June 27, 2003, and held for less than two months, or for Investor<br />
Shares, the account service fee that may be applicable to certain accounts with balances below $10,000.<br />
2 Select Emerging Markets <strong>Index</strong> through August 23, 2006; MSCI Emerging Markets <strong>Index</strong> thereafter.<br />
3 Derived from data provided by Lipper Inc.<br />
4 Performance for the fund’s Admiral Shares and comparative standards is calculated since the Admiral Shares’ inception: June 23, 2006.<br />
2006<br />
2007<br />
2008<br />
2009<br />
$44,000<br />
28,550<br />
3,000<br />
Average <strong>Annual</strong> Total Returns<br />
Periods Ended October 31, 2009<br />
Final Value<br />
of a $10,000<br />
One Year Five Years Ten Years Investment<br />
Emerging Markets <strong>Stock</strong> <strong>Index</strong> Fund<br />
Investor Shares1 58.90% 15.66% 11.06% $28,550<br />
MSCI All Country World <strong>Index</strong> ex USA 34.79 7.58 3.95 14,733<br />
Spliced Emerging Markets <strong>Index</strong>2 64.13 16.47 11.64 30,087<br />
Emerging Markets <strong>Funds</strong> Average3 56.47 14.15 10.64 27,494<br />
Since<br />
Final Value of<br />
a $100,000<br />
One Year Inception4 Investment<br />
Emerging Markets <strong>Stock</strong> <strong>Index</strong> Fund Admiral Shares1 59.11% 9.61% $136,084<br />
MSCI All Country World <strong>Index</strong> ex USA 34.79 1.51 105,142<br />
Spliced Emerging Markets <strong>Index</strong>2 64.13 10.48 139,711


