

Vanguard International Stock Index Funds Annual Report
Vanguard International Stock Index Funds Annual Report
Vanguard International Stock Index Funds Annual Report

Create successful ePaper yourself
Turn your PDF publications into a flip-book with our unique Google optimized e-Paper software.
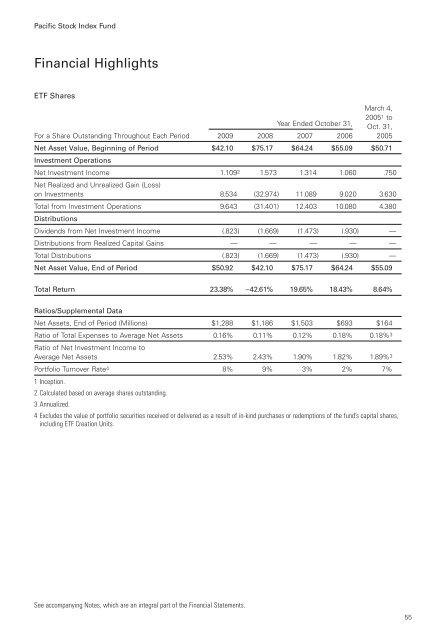
Pacific <strong>Stock</strong> <strong>Index</strong> Fund<br />
Financial Highlights<br />
ETF Shares<br />
March 4,<br />
20051 to<br />
Year Ended October 31,<br />
Oct. 31,<br />
For a Share Outstanding Throughout Each Period 2009 2008 2007 2006 2005<br />
Net Asset Value, Beginning of Period $42.10 $75.17 $64.24 $55.09 $50.71<br />
Investment Operations<br />
Net Investment Income 1.1092 Net Realized and Unrealized Gain (Loss)<br />
1.573 1.314 1.060 .750<br />
on Investments 8.534 (32.974) 11.089 9.020 3.630<br />
Total from Investment Operations<br />
Distributions<br />
9.643 (31.401) 12.403 10.080 4.380<br />
Dividends from Net Investment Income (.823) (1.669) (1.473) (.930) —<br />
Distributions from Realized Capital Gains — — — — —<br />
Total Distributions (.823) (1.669) (1.473) (.930) —<br />
Net Asset Value, End of Period $50.92 $42.10 $75.17 $64.24 $55.09<br />
Total Return 23.38% –42.61% 19.65% 18.43% 8.64%<br />
Ratios/Supplemental Data<br />
Net Assets, End of Period (Millions) $1,288 $1,186 $1,503 $693 $164<br />
Ratio of Total Expenses to Average Net Assets 0.16% 0.11% 0.12% 0.18% 0.18% 3<br />
Ratio of Net Investment Income to<br />
Average Net Assets 2.53% 2.43% 1.90% 1.82% 1.89% 3<br />
Portfolio Turnover Rate4 1 Inception.<br />
2 Calculated based on average shares outstanding.<br />
3 <strong>Annual</strong>ized.<br />
8% 9% 3% 2% 7%<br />
4 Excludes the value of portfolio securities received or delivered as a result of in-kind purchases or redemptions of the fund’s capital shares,<br />
including ETF Creation Units.<br />
See accompanying Notes, which are an integral part of the Financial Statements.<br />
55


