Retail Entitlement Offer - Documents Mailed to ... - AWB Limited
Retail Entitlement Offer - Documents Mailed to ... - AWB Limited
Retail Entitlement Offer - Documents Mailed to ... - AWB Limited

You also want an ePaper? Increase the reach of your titles
YUMPU automatically turns print PDFs into web optimized ePapers that Google loves.
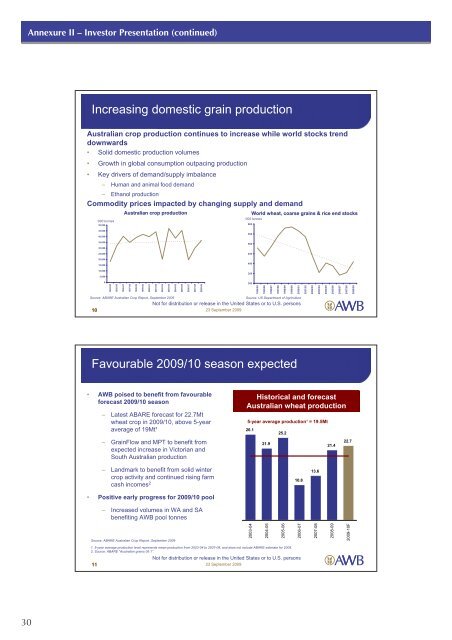
Annexure II – Inves<strong>to</strong>r Presentation (continued)Increasing domestic grain productionAustralian crop production continues <strong>to</strong> increase while world s<strong>to</strong>cks trenddownwards• Solid domestic production volumes• Growth in global consumption outpacing production• Key drivers of demand/supply imbalance– Human and animal food demand– Ethanol productionCommodity prices impacted by changing supply and demand‘000 <strong>to</strong>nnes50,000Australian crop productionWorld wheat, coarse grains & rice end s<strong>to</strong>cks‘000 <strong>to</strong>nnes60045,00040,00035,00030,00025,00055050045020,00015,00040010,0005,00035001994-951995-961996-971997-981998-991999-002000-012001-022002-032003-042004-052005-062006-072007-082008-093001994/951995/961996/971997/981998/991999/002000/012001/022002/032003/042004/052005/062006/072007/082008/09Source: ABARE Australian Crop Report, September 2009Source: US Department of AgricultureNot for distribution or release in the United States or <strong>to</strong> U.S. persons1023 September 2009Favourable 2009/10 season expected• <strong>AWB</strong> poised <strong>to</strong> benefit from favourableforecast 2009/10 season– Latest ABARE forecast for 22.7Mtwheat crop in 2009/10, above 5-yearaverage of 19Mt¹– GrainFlow and MPT <strong>to</strong> benefit fromexpected increase in Vic<strong>to</strong>rian andSouth Australian productionHis<strong>to</strong>rical and forecastAustralian wheat production5-year average production¹ = 19.5Mt26.125.221.921.422.7– Landmark <strong>to</strong> benefit from solid wintercrop activity and continued rising farmcash incomes 2• Positive early progress for 2009/10 pool– Increased volumes in WA and SAbenefiting <strong>AWB</strong> pool <strong>to</strong>nnes10.813.6Source: ABARE Australian Crop Report, September 20092003-042004-052005-062006-072007-082008-092009-10F1. 5-year average production level represents mean production from 2003-04 <strong>to</strong> 2007-08, and does not include ABARE estimate for 2009.2. Source: ABARE “Australian grains 09.1”.Not for distribution or release in the United States or <strong>to</strong> U.S. persons1123 September 200930