102 S. P. R<strong>in</strong>ger <strong>and</strong> K. Honoma<strong>in</strong><strong>in</strong>g problems <strong>in</strong> the physical metallurgyof age-hardenable alum<strong>in</strong>ium alloys.This is also of current technological <strong>in</strong>terest,given that variations <strong>in</strong> the heat treatment,stra<strong>in</strong> conditions prior to ag<strong>in</strong>g, <strong>and</strong>alloy composition <strong>in</strong>duce significant changes<strong>in</strong> microstructure, <strong>and</strong> there rema<strong>in</strong>s considerablepotential for the design of highstrengthalum<strong>in</strong>ium alloys. Recent technologicalimpetus for explor<strong>in</strong>g the alloy design<strong>and</strong> development has ma<strong>in</strong>ly comefrom the aerospace <strong>and</strong> automobile <strong>in</strong>dustries[1].The purpose of this review is to exam<strong>in</strong>ethe microstructural mechanisms underly<strong>in</strong>gthe ag<strong>in</strong>g processes <strong>in</strong> a selection ofwrought heat-treatable alloys. A feature ofthis review is the application of atom probefield-ion microscopy (APFIM) <strong>and</strong> transmissionelectron microscopy (TEM) <strong>in</strong> provid<strong>in</strong>gdirect observations of the evolutionof microstructure <strong>and</strong> an <strong>in</strong>sight to the ageharden<strong>in</strong>gprocesses.EXPERIMENTALMost of the studies reported here were performedon scientific alloys. Ingots wereconventionally cast <strong>in</strong>to book molds, homogenizedat 525C for 72 h, <strong>and</strong> scalped(5mm from each face). Samples (5 10 10mm) were mach<strong>in</strong>ed for hardness test<strong>in</strong>g,while some material was cold rolled tosheet for TEM studies. Samples for APFIMxwere spark mach<strong>in</strong>ed from the bulk to 0.3 0.3 10mm or obta<strong>in</strong>ed from materialdrawn to wire. Solution treatment was carriedout <strong>in</strong> either salt or Ar atmospheres,followed by cold-water quench<strong>in</strong>g. Elevatedtemperature ag<strong>in</strong>g was performed <strong>in</strong>silicone oil baths, <strong>and</strong> hardness monitoredus<strong>in</strong>g a st<strong>and</strong>ard Vickers hardness <strong>in</strong>dentorunder a load of 5kg. Samples for APFIM<strong>and</strong> TEM were prepared us<strong>in</strong>g st<strong>and</strong>ardelectropolish<strong>in</strong>g techniques [3, 4].Details describ<strong>in</strong>g the APFIM <strong>in</strong>strumentationare provided <strong>in</strong> references [5–7]. Animportant feature of the APFIM <strong>in</strong>strumentationused <strong>in</strong> these studies is the ability tocool specimens to 20K, which allows stablefield ion microscopy (FIM) of alum<strong>in</strong>iumalloys. Until recently, FIM <strong>and</strong> atomprobeanalyses of alum<strong>in</strong>ium alloys wasuncommon, while other major <strong>in</strong>dustrialmetallic materials such as steels were extensivelystudied. This was ma<strong>in</strong>ly becauseof the low evaporation field of Al, whichmakes the observation of FIM images difficult.By lower<strong>in</strong>g the specimen temperatureto 20K, the evaporation field of Albecomes as high as the ionization fields ofNe <strong>and</strong> He, allow<strong>in</strong>g stable FIM observationsus<strong>in</strong>g these imag<strong>in</strong>g gases [3]. Thefirst FIM image of an Al alloy was obta<strong>in</strong>edby Boyes et al. [8], us<strong>in</strong>g a cold f<strong>in</strong>gercooled down by liquid He. Later, us<strong>in</strong>g adedicated FIM, good-quality FIM images ofAl–Cu alloys were obta<strong>in</strong>ed by Abe et al.[9], Wada et al. [10], <strong>and</strong> Hono et al. [11]. Inan atom probe, however, a specimen-tilt<strong>in</strong>gmechanism must be <strong>in</strong>corporated <strong>in</strong> theFIM, <strong>and</strong> achiev<strong>in</strong>g 20K is not trivial. Inall of the studies reviewed here, FIM imageswere obta<strong>in</strong>ed us<strong>in</strong>g either Ne gas at35K, or He gas at 25K. The one-dimensional(1D) atom probes employed eitherPoschenrieder or reflectron energy compensat<strong>in</strong>glenses. The 1DAP analyses weretypically performed with 0.5nm spatialresolution <strong>in</strong> the lateral direction <strong>and</strong>atomic layer resolution <strong>in</strong> the depth direction.A three-dimensional atom probe(3DAP), equipped with CAMECA’s tomographicatom probe [7] was also employed.Both 1D <strong>and</strong> 3DAP analyses were performedat a specimen temperature of 20–30K <strong>in</strong> ultrahigh vacuum (10 11 Torr) us<strong>in</strong>ga pulse fraction of either 15 or 20% <strong>and</strong> apulse rate of 100 or 600Hz. Visualization<strong>and</strong> analysis of the 3DAP data was carriedout us<strong>in</strong>g the K<strong>in</strong>dbrisk SDV 3DAP dataanalysis software runn<strong>in</strong>g on the AdvancedVisualization System (AVS).The present work also conta<strong>in</strong>s resultsfrom conventional transmission electronmicroscopy (CTEM) <strong>and</strong> high-resolutiontransmission electron microscopy (HRTEM).A suite of microscopes were used <strong>in</strong>clud<strong>in</strong>ga Philips CM12 (120kV), Philips CM20(200kV), JEOL 2000 EX (200kV), JEOL 4000
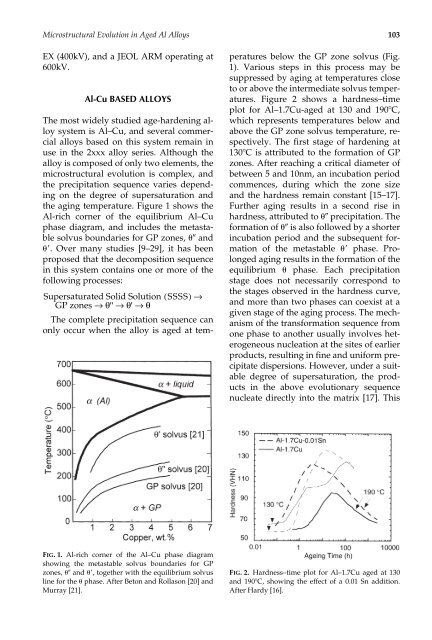
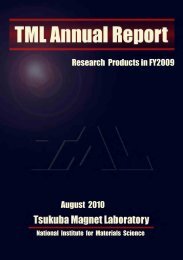
<strong>Microstructural</strong> <strong>Evolution</strong> <strong>in</strong> <strong>Age</strong>d Al <strong>Alloys</strong> 103EX (400kV), <strong>and</strong> a JEOL ARM operat<strong>in</strong>g at600kV.Al-Cu BASED ALLOYSThe most widely studied age-harden<strong>in</strong>g alloysystem is Al–Cu, <strong>and</strong> several commercialalloys based on this system rema<strong>in</strong> <strong>in</strong>use <strong>in</strong> the 2xxx alloy series. Although thealloy is composed of only two elements, themicrostructural evolution is complex, <strong>and</strong>the precipitation sequence varies depend<strong>in</strong>gon the degree of supersaturation <strong>and</strong>the ag<strong>in</strong>g temperature. Figure 1 shows theAl-rich corner of the equilibrium Al–Cuphase diagram, <strong>and</strong> <strong>in</strong>cludes the metastablesolvus boundaries for GP zones, <strong>and</strong>. Over many studies [9–29], it has beenproposed that the decomposition sequence<strong>in</strong> this system conta<strong>in</strong>s one or more of thefollow<strong>in</strong>g processes:Supersaturated Solid Solution ( SSSS)→GP zones →θ'' →θ' →θThe complete precipitation sequence canonly occur when the alloy is aged at tem-peratures below the GP zone solvus (Fig.1). Various steps <strong>in</strong> this process may besuppressed by ag<strong>in</strong>g at temperatures closeto or above the <strong>in</strong>termediate solvus temperatures.Figure 2 shows a hardness–timeplot for Al–1.7Cu-aged at 130 <strong>and</strong> 190C,which represents temperatures below <strong>and</strong>above the GP zone solvus temperature, respectively.The first stage of harden<strong>in</strong>g at130C is attributed to the formation of GPzones. After reach<strong>in</strong>g a critical diameter ofbetween 5 <strong>and</strong> 10nm, an <strong>in</strong>cubation periodcommences, dur<strong>in</strong>g which the zone size<strong>and</strong> the hardness rema<strong>in</strong> constant [15–17].Further ag<strong>in</strong>g results <strong>in</strong> a second rise <strong>in</strong>hardness, attributed to precipitation. Theformation of is also followed by a shorter<strong>in</strong>cubation period <strong>and</strong> the subsequent formationof the metastable phase. Prolongedag<strong>in</strong>g results <strong>in</strong> the formation of theequilibrium phase. Each precipitationstage does not necessarily correspond tothe stages observed <strong>in</strong> the hardness curve,<strong>and</strong> more than two phases can coexist at agiven stage of the ag<strong>in</strong>g process. The mechanismof the transformation sequence fromone phase to another usually <strong>in</strong>volves heterogeneousnucleation at the sites of earlierproducts, result<strong>in</strong>g <strong>in</strong> f<strong>in</strong>e <strong>and</strong> uniform precipitatedispersions. However, under a suitabledegree of supersaturation, the products<strong>in</strong> the above evolutionary sequencenucleate directly <strong>in</strong>to the matrix [17]. ThisFIG. 1. Al-rich corner of the Al–Cu phase diagramshow<strong>in</strong>g the metastable solvus boundaries for GPzones, <strong>and</strong> , together with the equilibrium solvusl<strong>in</strong>e for the phase. After Beton <strong>and</strong> Rollason [20] <strong>and</strong>Murray [21].FIG. 2. Hardness–time plot for Al–1.7Cu aged at 130<strong>and</strong> 190C, show<strong>in</strong>g the effect of a 0.01 Sn addition.After Hardy [16].