Negative differential conductance in two-dimensional electron grids
Negative differential conductance in two-dimensional electron grids
Negative differential conductance in two-dimensional electron grids

You also want an ePaper? Increase the reach of your titles
YUMPU automatically turns print PDFs into web optimized ePapers that Google loves.
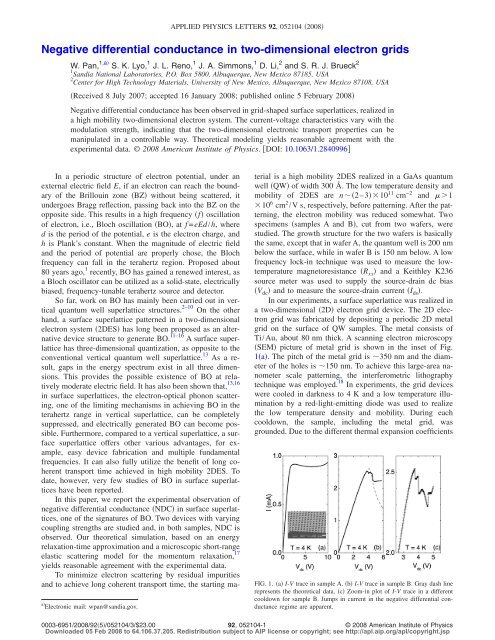
APPLIED PHYSICS LETTERS 92, 052104 2008<strong>Negative</strong> <strong>differential</strong> <strong>conductance</strong> <strong>in</strong> <strong>two</strong>-<strong>dimensional</strong> <strong>electron</strong> <strong>grids</strong>W. Pan, 1,a S. K. Lyo, 1 J. L. Reno, 1 J. A. Simmons, 1 D. Li, 2 and S. R. J. Brueck 21 Sandia National Laboratories, P.O. Box 5800, Albuquerque, New Mexico 87185, USA2 Center for High Technology Materials, University of New Mexico, Albuquerque, New Mexico 87108, USAReceived 8 July 2007; accepted 16 January 2008; published onl<strong>in</strong>e 5 February 2008<strong>Negative</strong> <strong>differential</strong> <strong>conductance</strong> has been observed <strong>in</strong> grid-shaped surface superlattices, realized <strong>in</strong>a high mobility <strong>two</strong>-<strong>dimensional</strong> <strong>electron</strong> system. The current-voltage characteristics vary with themodulation strength, <strong>in</strong>dicat<strong>in</strong>g that the <strong>two</strong>-<strong>dimensional</strong> <strong>electron</strong>ic transport properties can bemanipulated <strong>in</strong> a controllable way. Theoretical model<strong>in</strong>g yields reasonable agreement with theexperimental data. © 2008 American Institute of Physics. DOI: 10.1063/1.2840996a Electronic mail: wpan@sandia.gov.In a periodic structure of <strong>electron</strong> potential, under anexternal electric field E, if an <strong>electron</strong> can reach the boundaryof the Brillou<strong>in</strong> zone BZ without be<strong>in</strong>g scattered, itundergoes Bragg reflection, pass<strong>in</strong>g back <strong>in</strong>to the BZ on theopposite side. This results <strong>in</strong> a high frequency f oscillationof <strong>electron</strong>, i.e., Bloch oscillation BO, atf =eEd/h, whered is the period of the potential, e is the <strong>electron</strong> charge, andh is Plank’s constant. When the magnitude of electric fieldand the period of potential are properly chose, the Blochfrequency can fall <strong>in</strong> the terahertz region. Proposed about80 years ago, 1 recently, BO has ga<strong>in</strong>ed a renewed <strong>in</strong>terest, asa Bloch oscillator can be utilized as a solid-state, electricallybiased, frequency-tunable terahertz source and detector.So far, work on BO has ma<strong>in</strong>ly been carried out <strong>in</strong> verticalquantum well superlattice structures. 2–10 On the otherhand, a surface superlattice patterned <strong>in</strong> a <strong>two</strong>-<strong>dimensional</strong><strong>electron</strong> system 2DES has long been proposed as an alternativedevice structure to generate BO. 11–16 A surface superlatticehas three-<strong>dimensional</strong> quantization, as opposite to theconventional vertical quantum well superlattice. 13 As a result,gaps <strong>in</strong> the energy spectrum exist <strong>in</strong> all three dimensions.This provides the possible existence of BO at relativelymoderate electric field. It has also been shown that, 13,16<strong>in</strong> surface superlattices, the <strong>electron</strong>-optical phonon scatter<strong>in</strong>g,one of the limit<strong>in</strong>g mechanisms <strong>in</strong> achiev<strong>in</strong>g BO <strong>in</strong> theterahertz range <strong>in</strong> vertical superlattice, can be completelysuppressed, and electrically generated BO can become possible.Furthermore, compared to a vertical superlattice, a surfacesuperlattice offers other various advantages, for example,easy device fabrication and multiple fundamentalfrequencies. It can also fully utilize the benefit of long coherenttransport time achieved <strong>in</strong> high mobility 2DES. Todate, however, very few studies of BO <strong>in</strong> surface superlatticeshave been reported.In this paper, we report the experimental observation ofnegative <strong>differential</strong> <strong>conductance</strong> NDC <strong>in</strong> surface superlattices,one of the signatures of BO. Two devices with vary<strong>in</strong>gcoupl<strong>in</strong>g strengths are studied and, <strong>in</strong> both samples, NDC isobserved. Our theoretical simulation, based on an energyrelaxation-time approximation and a microscopic short-rangeelastic scatter<strong>in</strong>g model for the momentum relaxation, 17yields reasonable agreement with the experimental data.To m<strong>in</strong>imize <strong>electron</strong> scatter<strong>in</strong>g by residual impuritiesand to achieve long coherent transport time, the start<strong>in</strong>g materialis a high mobility 2DES realized <strong>in</strong> a GaAs quantumwell QW of width 300 Å. The low temperature density andmobility of 2DES are n2–310 11 cm −2 and 110 6 cm 2 /V s, respectively, before pattern<strong>in</strong>g. After the pattern<strong>in</strong>g,the <strong>electron</strong> mobility was reduced somewhat. Twospecimens samples A and B, cut from <strong>two</strong> wafers, werestudied. The growth structure for the <strong>two</strong> wafers is basicallythe same, except that <strong>in</strong> wafer A, the quantum well is 200 nmbelow the surface, while <strong>in</strong> wafer B is 150 nm below. A lowfrequency lock-<strong>in</strong> technique was used to measure the lowtemperaturemagnetoresistance R xx and a Keithley K236source meter was used to supply the source-dra<strong>in</strong> dc biasV dc and to measure the source-dra<strong>in</strong> current I ds .In our experiments, a surface superlattice was realized <strong>in</strong>a <strong>two</strong>-<strong>dimensional</strong> 2D <strong>electron</strong> grid device. The 2D <strong>electron</strong>grid was fabricated by deposit<strong>in</strong>g a periodic 2D metalgrid on the surface of QW samples. The metal consists ofTi/Au, about 80 nm thick. A scann<strong>in</strong>g <strong>electron</strong> microscopySEM picture of metal grid is shown <strong>in</strong> the <strong>in</strong>set of Fig.1a. The pitch of the metal grid is 350 nm and the diameterof the holes is 150 nm. To achieve this large-area nanometerscale pattern<strong>in</strong>g, the <strong>in</strong>terferometric lithographytechnique was employed. 18 In experiments, the grid deviceswere cooled <strong>in</strong> darkness to 4 K and a low temperature illum<strong>in</strong>ationby a red-light-emitt<strong>in</strong>g diode was used to realizethe low temperature density and mobility. Dur<strong>in</strong>g eachcooldown, the sample, <strong>in</strong>clud<strong>in</strong>g the metal grid, wasgrounded. Due to the different thermal expansion coefficientsFIG. 1. a I-V trace <strong>in</strong> sample A. b I-V trace <strong>in</strong> sample B. Gray dash l<strong>in</strong>erepresents the theoretical data. c Zoom-<strong>in</strong> plot of I-V trace <strong>in</strong> a differentcooldown for sample B. Jumps <strong>in</strong> current <strong>in</strong> the negative <strong>differential</strong> <strong>conductance</strong>regime are apparent.0003-6951/2008/925/052104/3/$23.0092, 052104-1© 2008 American Institute of PhysicsDownloaded 05 Feb 2008 to 64.106.37.205. Redistribution subject to AIP license or copyright; see http://apl.aip.org/apl/copyright.jsp
052104-2 Pan et al. Appl. Phys. Lett. 92, 052104 2008of the metal and the GaAs/AlGaAs semiconductor, the mechanicalstress <strong>in</strong>duces a <strong>two</strong>-<strong>dimensional</strong> <strong>electron</strong> potentialmodulation of the 2DES. To characterize this modulation, wehave adopted well-documented methods 19 by measur<strong>in</strong>g R xx .Similar to previous results, a positive magnetoresistance nearzero magnetic B field and the commensurate oscillationswere observed. From the saturation B field of the positivemagnetoresistance, 20 we estimated that the modulation amplitudeis 3% of the Fermi energy E F or 0.3 meV forsample A, and 15% 1 meV for sample B. To compare, <strong>in</strong>a reference sample without pattern<strong>in</strong>g neither positive magnetoresistancenor commensurate oscillation was observed <strong>in</strong>R xx .Current-voltage I-V measurement was carried out at4 K, us<strong>in</strong>g a Keithley K236 source meter. In Fig. 1, the I-Vcurves of samples A and B are shown. At small V dc , bothdevices show Ohmic behavior, and the correspond<strong>in</strong>g resistanceis 1500 for sample A and 3000 for sample B.These resistances <strong>in</strong>clude wire and contact resistance <strong>in</strong> additionto the sample resistance. In sample A Fig. 1a, I dsreaches a maximal value of 0.92 mA at V dc 2.7 V, andthen decreases as V dc cont<strong>in</strong>ues to <strong>in</strong>crease, reach<strong>in</strong>g a localm<strong>in</strong>imum of 0.89 mA around 6.5 V. After this, I ds <strong>in</strong>creasesaga<strong>in</strong> with <strong>in</strong>creas<strong>in</strong>g V dc . In other words, a negative<strong>differential</strong> <strong>conductance</strong> is observed between 2.7 and6.5 V. In sample B, where a stronger modulation isachieved, aga<strong>in</strong>, a NDC is observed. In Figs. 1b and 1c,we show the I-V curves from <strong>two</strong> different cooldowns. Twofeatures are worthwhile emphasiz<strong>in</strong>g: 1 the maximal currentis significantly higher than that <strong>in</strong> sample A, 2.5 mAat V dc 3.8 V; 2 more complex structures are observed <strong>in</strong>the NDC regime. In particular, <strong>in</strong> Fig. 1c, three currentjumps are observed at V dc 3.8, 4.0, and 4.6 V.The observation of NDC is excit<strong>in</strong>g. Recall that NDCwas predicted and taken as the evidence of Bloch oscillations<strong>in</strong> vertical quantum well superlattices by Esaki and Tsu <strong>in</strong>their orig<strong>in</strong>al paper. 2 In surface superlattices, it wasshown 11–15 that the bend over <strong>in</strong> the I-V curve could also bedue to the onset of Bloch oscillations, where <strong>electron</strong>s areable to cycle many times through the reduced Brillou<strong>in</strong> zonebefore a scatter<strong>in</strong>g event can happen. 13 Thus, the observedNDC may <strong>in</strong>deed represent the evidence of <strong>electron</strong> selfoscillations<strong>in</strong> our 2D <strong>electron</strong> <strong>grids</strong>. Furthermore, the I-Vcurves show different characteristics <strong>in</strong> the <strong>two</strong> samples, <strong>in</strong>dicat<strong>in</strong>gthat the I-V characteristics and the 2D <strong>electron</strong>ictransport properties can be manipulated by adjust<strong>in</strong>g thestructure. F<strong>in</strong>ally, we note the observation of current jumps<strong>in</strong> the NDC region <strong>in</strong> our GaAs surface superlattice. Similarcurrent jumps have been observed <strong>in</strong> InGaAs/InAlAs verticalsuperlattices 21 and <strong>in</strong> InAs/AlSb resonant-tunnel<strong>in</strong>gdiodes, 22 and were attributed to self-rectification of the <strong>electron</strong>oscillation. 23Of course, other mechanisms such as the formation ofhigh electric-field doma<strong>in</strong>s and the so-called thermal runaway,can also <strong>in</strong>duce an apparent NDC. It has been shownthat stationary or propagat<strong>in</strong>g doma<strong>in</strong>s can form <strong>in</strong> 2Dstructures. 24 In this regard, it is possible that current jumpsmight be produced as the doma<strong>in</strong> boundary moves throughthe <strong>in</strong>terface fluctuations <strong>in</strong>duced by surface superlattice. 25On the other hand, the <strong>two</strong>-<strong>dimensional</strong> nature of conduct<strong>in</strong>gchannels should help to stabilize the electrical field <strong>in</strong> surfacesuperlattices and prevent the formation of high electric-fielddoma<strong>in</strong>s. It is <strong>in</strong>terest<strong>in</strong>g to study <strong>in</strong> future experimentsFIG. 2. Color onl<strong>in</strong>e Differential measurement for verify<strong>in</strong>g the thermalrunaway orig<strong>in</strong> of the observed NDC. The <strong>in</strong>set shows the experimentalsetup. R 0 is a th<strong>in</strong>-film resistor.whether the current jump observed <strong>in</strong> our device is related tothe doma<strong>in</strong> formation.To experimentally elim<strong>in</strong>ate the possibility of thermalrunaway orig<strong>in</strong>, we employ a “<strong>differential</strong>” measurementsetup as shown <strong>in</strong> the <strong>in</strong>set of Fig. 2, where a th<strong>in</strong> filmresistor of constant value R 0 =1500 is connected <strong>in</strong> serieswith the <strong>two</strong>-<strong>dimensional</strong> <strong>electron</strong> grid sample B. A smallalternat<strong>in</strong>g current bias V ac is added to V dc . The voltagemeasured by a lock-<strong>in</strong> amplifier is given by V=V ac R 0 /R 0+r, where r=dV/dI is the <strong>differential</strong> resistance of the <strong>two</strong><strong>dimensional</strong><strong>electron</strong> grid. Here, we have omitted the wireand contact resistance, s<strong>in</strong>ce they are relatively small comparedto r <strong>in</strong> the NDC region. If the observed NDC is ofthermal runaway orig<strong>in</strong>, r is always positive. Consequently,V is expected to be positive, at any V dc . On the other hand, ifr is caused by dynamic localization through BO, then r0.In the case of r R 0 , V is expected to be negative <strong>in</strong> theNDC region. In Fig. 2, we show V as a function of V dc .Atsmall V dc , V is nearly constant, consistent with the observation<strong>in</strong> Fig. 1 that our <strong>electron</strong> grid is Ohmic at small V dc .Start<strong>in</strong>g from V dc 8V, V beg<strong>in</strong>s to decrease. At V dc8.9 V, V becomes negative. 26 The observation of negativeV shows that, <strong>in</strong>deed, the observed NDC is not a result ofthermal effects.To help understand the physical orig<strong>in</strong> of NDC, a theoreticalstudy was carried out for sample B with 15% modulation.We first calculate the energy band structures. In ourdevice with a periodic <strong>in</strong>-plane potential modulation, theorig<strong>in</strong>al modulation-free s<strong>in</strong>gle conduction band is folded<strong>in</strong>to many Bloch m<strong>in</strong>ibands with small m<strong>in</strong>iband gaps. Surpris<strong>in</strong>gly,each m<strong>in</strong>iband can be represented by a fewcomponentcos<strong>in</strong>e function similar to Esaki’s band withnegligible contributions from higher harmonics. To calculatethe I-V characteristic, we use a model similar to that byGerhardt, 17 except that our model treats a degenerate 2D<strong>electron</strong> gas and assumes that the matrix element for elasticscatter<strong>in</strong>g is <strong>in</strong>dependent of the <strong>in</strong>itial and f<strong>in</strong>al momentumrelevant to short-range impurity potentials, thereby treat<strong>in</strong>g2D <strong>in</strong>terband scatter<strong>in</strong>g with an equal weight. Also, <strong>in</strong> ourcalculation, a simplified model, where the <strong>electron</strong> potentialmodulation is one-<strong>dimensional</strong> <strong>in</strong> the field direction, is used.We believe that the physics for a qualitative understand<strong>in</strong>gDownloaded 05 Feb 2008 to 64.106.37.205. Redistribution subject to AIP license or copyright; see http://apl.aip.org/apl/copyright.jsp
052104-3 Pan et al. Appl. Phys. Lett. 92, 052104 2008should essentially be the same as <strong>in</strong> the <strong>two</strong>-<strong>dimensional</strong><strong>electron</strong> grid. Details of our theoretical calculations will bepublished elsewhere. The theoretical result is shown <strong>in</strong> Fig.1b by the gray dash l<strong>in</strong>e. Overall, the theoretical result is <strong>in</strong>a reasonable agreement with the experimental data, exceptthat the decrease of current <strong>in</strong> the NDC regime is steeperthan that of the experimental data. We also note here that theeffective current cross section employed <strong>in</strong> theoretical calculationsis smaller than the geometric cross section of realdevice by a factor of a few, and the <strong>electron</strong> scatter<strong>in</strong>g rate islarger than that deduced from the mobility. Those discrepanciesprobably are related to the assumptions of 1 a one<strong>dimensional</strong>model and 2 field-<strong>in</strong>dependent <strong>in</strong>elastic scatter<strong>in</strong>grate we made <strong>in</strong> the calculation. F<strong>in</strong>ally, for a selfconsistentcheck, for a parabolic band <strong>in</strong> the absence ofperiodic potential modulation, our model yields l<strong>in</strong>ear fielddependence of current and therefore no NDC.In conclusion, we have observed a NDC <strong>in</strong> <strong>two</strong><strong>dimensional</strong><strong>electron</strong> grid devices, and <strong>in</strong> one sample, severalcurrent jumps <strong>in</strong> the NDC region. Our theoretical model<strong>in</strong>gyields reasonable agreement with the experimental data. Theobserved NDC may represent the evidence of Bloch oscillation<strong>in</strong> our <strong>two</strong>-<strong>dimensional</strong> <strong>electron</strong> <strong>grids</strong>.We are grateful to Mark Lee for suggest<strong>in</strong>g to us themeasurement <strong>in</strong> Fig. 2, and Mike Wanke for br<strong>in</strong>g<strong>in</strong>g ourattention to Ref. 24. We thank Denise Tibbetts for her excellenttechnical assistance. This project was supported, <strong>in</strong> part,by LDRD and DOE/BES at Sandia National Laboratories.Sandia is a multiprogram laboratory operated by Sandia Corporation,a Lockheed Mart<strong>in</strong> company, for the United StatesDepartment of Energy’s National Nuclear Security Adm<strong>in</strong>istrationunder Contract No. DE-AC04-94AL85000. The facilitiesof the NSF-sponsored NNIN node at the Universityof New Mexico were used for the fabrication.1 F. Bloch, Z. Phys. 52, 555 1928.2 L. Esaki and R. Tsu, IBM J. Res. Dev. 14, 611970.3 K. K. Choi, B. F. Lev<strong>in</strong>e, R. J. Malik, J. Walker, and C. G. Betha, Phys.Rev. B 35, 4172 1987.4 J. Bleuse, G. Bastard, and P. Vois<strong>in</strong>, Phys. Rev. Lett. 60, 220 1988.5 E. E. Mendez, F. Agullo-Rueda, and J. M. Hong, Phys. Rev. Lett. 60,2426 1988.6 A. Sibille, J. F. Palmier, H. Wang, and F. Mollot, Phys. Rev. Lett. 64, 521990.7 F. Beltram, F. Capasso, D. L. Sivco, A. L. Hutch<strong>in</strong>son, S. N. G. Chu, andA. Y. Cho, Phys. Rev. Lett. 64, 3167 1990.8 K. Utnterra<strong>in</strong>er, B. J. Keay, M. C. Wanke, S. J. Allen, D. Leonard, G.Medeiros-Ribeiro, U. Bhattacharya, and M. J. W. Rodwell, Phys. Rev.Lett. 76, 29731996.9 Y. Shimada, N. Sek<strong>in</strong>e, and K. Hirakawa, Appl. Phys. Lett. 84, 49262004.10 T. Feil, H.-P. Tranitz, M. Re<strong>in</strong>wald, and W. Wegscheider, Appl. Phys. Lett.87, 212112 2005.11 H. Sakaki, K. Wagatsuma, J. Hamasaki, and S. Saito, Th<strong>in</strong> Solid Films 36,497 1976.12 G. J. Iafrate, D. K. Ferry, and R. K. Reich, Surf. Sci. 113, 4851982.13 R. Reich, Ph.D. thesis, Colorado State University at Fort Coll<strong>in</strong>s, 1982.14 G. Bernste<strong>in</strong> and D. K. Ferry, J. Vac. Sci. Technol. B 5, 9641987.15 K. Ismail, W. Chu, D. A. Antoniadis, and H. I. Smith, Appl. Phys. Lett.54, 460 1989.16 I. A. Dmitriev and R. A. Suris, Semiconductors 35, 212 2001.17 R. F. Gerhardt, Phys. Rev. B 48, 9178 1993.18 S. C. Lee and S. R. J. Brueck, J. Vac. Sci. Technol. B 22, 1949 2004.19 D. Weiss, M. L. Roukes, A. Menschig, P. Grambow, K. von Klitz<strong>in</strong>g, andG. Weimann, Phys. Rev. Lett. 66, 27901991.20 P. H. Benton, E. S. Alves, P. C. Ma<strong>in</strong>, L. Eaves, M. W. Dellow, M. Hen<strong>in</strong>i,O. H. Hughes, S. P. Beaumont, and C. D. W. Wilk<strong>in</strong>son, Phys. Rev. B 42,9229 1990.21 E. Schomburg, R. Scheuerer, S. Brandl, K. F. Renk, D. G. Pavel’ev, Yu.Koschur<strong>in</strong>ov, V. Ust<strong>in</strong>ov, A. Zhukov, A. Kovsh, and P. S. Kop’ev, Electron.Lett. 35, 1491 1999.22 E. R. Brown, J. R. Soderstrom, C. D. Parker, L. J. Mahoney, K. M.Molvar, and T. C. McGrill, Appl. Phys. Lett. 58, 2291 1991.23 H. C. Liu, Appl. Phys. Lett. 53, 4851988.24 B. K. Ridley, Semicond. Sci. Technol. 3, 5421988.25 K. J. Luo, K.-J. Friedland, H. T. Grahn, and K. H. Ploog, Phys. Rev. B 61,4477 2000.26 Due to the load resistance R 0 , the NDC region is pushed to higher V dc ,compared to Fig. 1b.Downloaded 05 Feb 2008 to 64.106.37.205. Redistribution subject to AIP license or copyright; see http://apl.aip.org/apl/copyright.jsp