Signaling currency crises in South Africa - South African Reserve Bank
Signaling currency crises in South Africa - South African Reserve Bank
Signaling currency crises in South Africa - South African Reserve Bank

Create successful ePaper yourself
Turn your PDF publications into a flip-book with our unique Google optimized e-Paper software.
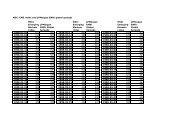
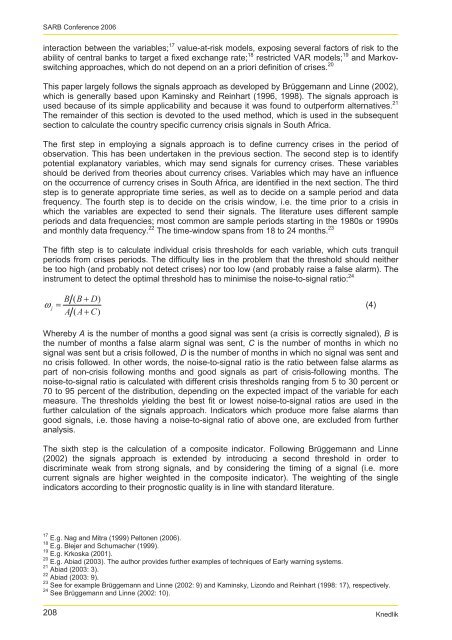
SARB Conference 2006<strong>in</strong>teraction between the variables; 17 value-at-risk models, expos<strong>in</strong>g several factors of risk to theability of central banks to target a fixed exchange rate; 18 restricted VAR models; 19 and Markovswitch<strong>in</strong>gapproaches, which do not depend on an a priori def<strong>in</strong>ition of <strong>crises</strong>. 20This paper largely follows the signals approach as developed by Brüggemann and L<strong>in</strong>ne (2002),which is generally based upon Kam<strong>in</strong>sky and Re<strong>in</strong>hart (1996, 1998). The signals approach isused because of its simple applicability and because it was found to outperform alternatives. 21The rema<strong>in</strong>der of this section is devoted to the used method, which is used <strong>in</strong> the subsequentsection to calculate the country specific <strong>currency</strong> crisis signals <strong>in</strong> <strong>South</strong> <strong>Africa</strong>.The first step <strong>in</strong> employ<strong>in</strong>g a signals approach is to def<strong>in</strong>e <strong>currency</strong> <strong>crises</strong> <strong>in</strong> the period ofobservation. This has been undertaken <strong>in</strong> the previous section. The second step is to identifypotential explanatory variables, which may send signals for <strong>currency</strong> <strong>crises</strong>. These variablesshould be derived from theories about <strong>currency</strong> <strong>crises</strong>. Variables which may have an <strong>in</strong>fluenceon the occurrence of <strong>currency</strong> <strong>crises</strong> <strong>in</strong> <strong>South</strong> <strong>Africa</strong>, are identified <strong>in</strong> the next section. The thirdstep is to generate appropriate time series, as well as to decide on a sample period and datafrequency. The fourth step is to decide on the crisis w<strong>in</strong>dow, i.e. the time prior to a crisis <strong>in</strong>which the variables are expected to send their signals. The literature uses different sampleperiods and data frequencies; most common are sample periods start<strong>in</strong>g <strong>in</strong> the 1980s or 1990sand monthly data frequency. 22 The time-w<strong>in</strong>dow spans from 18 to 24 months. 23The fifth step is to calculate <strong>in</strong>dividual crisis thresholds for each variable, which cuts tranquilperiods from <strong>crises</strong> periods. The difficulty lies <strong>in</strong> the problem that the threshold should neitherbe too high (and probably not detect <strong>crises</strong>) nor too low (and probably raise a false alarm). The<strong>in</strong>strument to detect the optimal threshold has to m<strong>in</strong>imise the noise-to-signal ratio: 24ω =jB ( B+D)A ( A+C)(4)Whereby A is the number of months a good signal was sent (a crisis is correctly signaled), B isthe number of months a false alarm signal was sent, C is the number of months <strong>in</strong> which nosignal was sent but a crisis followed, D is the number of months <strong>in</strong> which no signal was sent andno crisis followed. In other words, the noise-to-signal ratio is the ratio between false alarms aspart of non-crisis follow<strong>in</strong>g months and good signals as part of crisis-follow<strong>in</strong>g months. Thenoise-to-signal ratio is calculated with different crisis thresholds rang<strong>in</strong>g from 5 to 30 percent or70 to 95 percent of the distribution, depend<strong>in</strong>g on the expected impact of the variable for eachmeasure. The thresholds yield<strong>in</strong>g the best fit or lowest noise-to-signal ratios are used <strong>in</strong> thefurther calculation of the signals approach. Indicators which produce more false alarms thangood signals, i.e. those hav<strong>in</strong>g a noise-to-signal ratio of above one, are excluded from furtheranalysis.The sixth step is the calculation of a composite <strong>in</strong>dicator. Follow<strong>in</strong>g Brüggemann and L<strong>in</strong>ne(2002) the signals approach is extended by <strong>in</strong>troduc<strong>in</strong>g a second threshold <strong>in</strong> order todiscrim<strong>in</strong>ate weak from strong signals, and by consider<strong>in</strong>g the tim<strong>in</strong>g of a signal (i.e. morecurrent signals are higher weighted <strong>in</strong> the composite <strong>in</strong>dicator). The weight<strong>in</strong>g of the s<strong>in</strong>gle<strong>in</strong>dicators accord<strong>in</strong>g to their prognostic quality is <strong>in</strong> l<strong>in</strong>e with standard literature.17 E.g. Nag and Mitra (1999) Peltonen (2006).18 E.g. Blejer and Schumacher (1999).19 E.g. Krkoska (2001).20 E.g. Abiad (2003). The author provides further examples of techniques of Early warn<strong>in</strong>g systems.21 Abiad (2003: 3).22 Abiad (2003: 9).23 See for example Brüggemann and L<strong>in</strong>ne (2002: 9) and Kam<strong>in</strong>sky, Lizondo and Re<strong>in</strong>hart (1998: 17), respectively.24 See Brüggemann and L<strong>in</strong>ne (2002: 10).208Knedlik