TEAMING UP GAMING MARKET MOBILE CREATIVITY - Betsson AB
TEAMING UP GAMING MARKET MOBILE CREATIVITY - Betsson AB
TEAMING UP GAMING MARKET MOBILE CREATIVITY - Betsson AB
- No tags were found...

You also want an ePaper? Increase the reach of your titles
YUMPU automatically turns print PDFs into web optimized ePapers that Google loves.
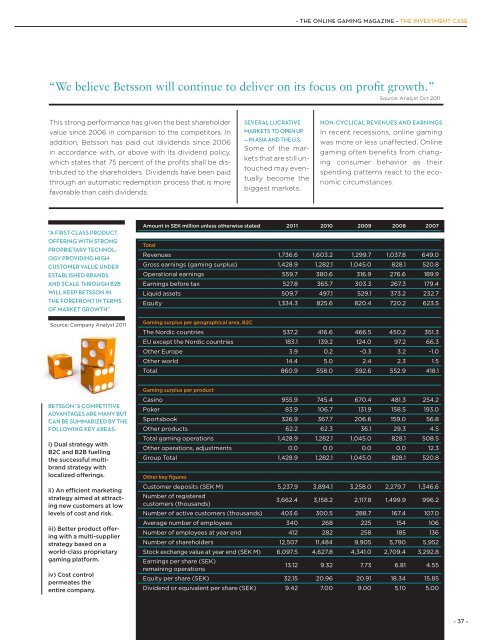
– THE ONLINE <strong>GAMING</strong> MAGAZINE – The Investment Case“We believe <strong>Betsson</strong> will continue to deliver on its focus on profit growth.”Source: Analyst Oct 2011This strong performance has given the best shareholdervalue since 2006 in comparison to the competitors. Inaddition, <strong>Betsson</strong> has paid out dividends since 2006in accordance with, or above with its dividend policy,which states that 75 percent of the profits shall be distributedto the shareholders. Dividends have been paidthrough an automatic redemption process that is morefavorable than cash dividends.Several lucrativemarkets to open up— in Asia and the U.S.Some of the marketsthat are still untouchedmay eventuallybecome thebiggest markets.Non-cyclical revenues and earningsIn recent recessions, online gamingwas more or less unaffected. Onlinegaming often benefits from changingconsumer behavior as theirspending patterns react to the economiccircumstances.“A first-class productoffering with strongproprietary technologyproviding highcustomer value underestablished brandsand scale through B2Bwill keep <strong>Betsson</strong> inthe forefront in termsof market growth”Source: Company Analyst 2011Amount in SEK million unless otherwise stated 2011 2010 2009 2008 2007TotalRevenues 1,736.6 1,603.2 1,299.7 1,037.8 649.0Gross earnings (gaming surplus) 1,428.9 1,282.1 1,045.0 828.1 520.8Operational earnings 559.7 380.6 316.9 276.6 189.9Earnings before tax 527.8 365.7 303.3 267.3 179.4Liquid assets 509.7 497.1 529.1 373.2 232.7Equity 1,334.3 825.6 820.4 720.2 623.5Gaming surplus per geographical area, B2CThe Nordic countries 537.2 416.6 466.5 450.2 351.3EU except the Nordic countries 183.1 139.2 124.0 97.2 66.3Other Europe 3.9 0.2 -0.3 3.2 -1.0Other world 14.4 5.0 2.4 2.3 1.5Total 860.9 558.0 592.6 552.9 418.1Gaming surplus per product<strong>Betsson</strong>´s competitiveadvantages are many butcan be summarized by thefollowing key areas:i) Dual strategy withB2C and B2B fuellingthe successful multibrandstrategy withlocalized offerings.ii) An efficient marketingstrategy aimed at attractingnew customers at lowlevels of cost and risk.iii) Better product offeringwith a multi-supplierstrategy based on aworld-class proprietarygaming platform.iv) Cost controlpermeates theentire company.Casino 955.9 745.4 670.4 481.3 254.2Poker 83.9 106.7 131.9 158.5 193.0Sportsbook 326.9 367.7 206.6 159.0 56.8Other products 62.2 62.3 36.1 29.3 4.5Total gaming operations 1,428.9 1,282.1 1,045.0 828.1 508.5Other operations, adjustments 0.0 0.0 0.0 0.0 12.3Group Total 1,428.9 1,282.1 1,045.0 828.1 520.8Other key figuresCustomer deposits (SEK M) 5,237.9 3,894.1 3,258.0 2,279.7 1,346.6Number of registeredcustomers (thousands)3,662.4 3,158.2 2,117.8 1,499.9 996.2Number of active customers (thousands) 403.6 300.5 288.7 167.4 107.0Average number of employees 340 268 225 154 106Number of employees at year end 412 282 258 185 136Number of shareholders 12,507 11,484 9,905 5,790 5,952Stock exchange value at year end (SEK M) 6,097.5 4,627.8 4,341.0 2,709.4 3,292.8Earnings per share (SEK)remaining operations13.12 9.32 7.73 6.81 4.55Equity per share (SEK) 32.15 20.96 20.91 18.34 15.85Dividend or equivalent per share (SEK) 9.42 7.00 9.00 5.10 5.00– 37 –